
Assessing Signal Noise Effects on Machine Learning Models
for ECG-Based Cardiac Diagnosis
Emanuela Guglielmi
1
, Davide Donato Russo
1
, Pasquale Trinchese
1
,
Gennaro Laudato
1
, Simone Scalabrino
1
, Gianluca Testa
2
and Rocco Oliveto
1
1
Department of Bioscience and Territory, University of Molise, Italy
2
Department of Medicine and Health Sciences, University of Molise, Italy
Keywords:
Signal Noise, Machine Learning, Empirical Study, Atrial Fibrillation, Ventricular Tachycardia.
Abstract:
The Internet of Medical Things (IoMT) plays a vital role in healthcare by enhancing preventive careand chronic
disease management through continuous monitoring using smart sensors and wearable devices. However, the
reliability of IoMT systems can be compromised by noise in the acquired vital signals, which can negatively
impact the accuracy of Machine Learning (ML) models used for anomaly detection. This study evaluates the
impact of various disturbances on the performance of ML models in predicting cardiac conditions, with a fo-
cus on assessing the reliability and effectiveness of these systems in real-world applications. We investigated
the effects of three types of noise—baseline wander, muscle artifact noise, and electrode motion artifact—on
the performance of two advanced ML models designed to predict cardiac conditions, specifically atrial fibril-
lation (AF) and ventricular tachycardia (VT). Our analysis centered on how different noise intensities (i.e., the
“loudness” of the noise) and durations (i.e., the length of time the noise persists) impacted the classification
performance of these models. The VT detection model showed robust performance, with minimal impact even
under intense and prolonged noise conditions. In contrast, AF detection was affected by all types of noise,
with classification accuracy decreasing by up to ∼59% in the most challenging scenarios.
1 INTRODUCTION
The Internet of Things (IoT) represents a major tech-
nological advancement in computing and communi-
cation, fueled by ongoing developments in wireless
sensor technology and nanotechnology. Among its
various applications, healthcare stands out as a crit-
ical area of impact.
The Internet of Medical Things (IoMT) is instru-
mental in preventive care and chronic disease man-
agement, enabling the early detection of symptoms
and health risks through continuous data collection
from patients. Smart sensors have significantly en-
hanced healthcare management by improving effi-
ciency, while wearable devices that monitor various
physiological parameters have become increasingly
user-friendly, requiring no specialized training. These
devices are capable of tracking metrics such as blood
oxygen levels, insulin levels, blood pressure, temper-
ature, and chemical balances.
Numerous studies have investigated the role of
IoMT devices, which are central to telemedicine. For
instance Balestrieri et al. (2019) introduced ATTI-
CUS, an IoMT system that continuously monitors vi-
tal signs such as ECG, respiration, and temperature.
These signals are analyzed by a Decision Support
System (DSS) that employs Machine Learning (ML)
models trained to detect anomalies, sending alerts to
medical staff when such anomalies are detected.
In real-world applications, IoMT systems like AT-
TICUS frequently face challenges related to noise in
acquired vital signals. For example, patient move-
ment—such as walking or running—can cause fric-
tion between electrodes and skin, leading to measure-
ment artifacts. Common types of noise in ECG sig-
nals include: (1) Baseline wander, characterized by
low-frequency fluctuations from movement; (2) Mus-
cle artifact noise, caused by high-frequency myogenic
activity; and (3) Electrode motion artifacts, marked
by high-intensity spikes due to temporary electrode
detachment.
These artifacts are particularly problematic in con-
tinuous anomaly detection, where noise increases the
likelihood of ML models generating false positives
(i.e., detecting non-existent anomalies). This not only
burdens medical personnel with filtering out false
alarms but also reduces the efficiency of monitoring
systems.
Although prior research has proposed noise re-
moval methods Hamil et al. (2022); Sadr et al. (2018),
458
Guglielmi, E., Russo, D. D., Trinchese, P., Laudato, G., Scalabrino, S., Testa, G. and Oliveto, R.
Assessing Signal Noise Effects on Machine Learning Models for ECG-Based Cardiac Diagnosis.
DOI: 10.5220/0013126800003911
Paper published under CC license (CC BY-NC-ND 4.0)
In Proceedings of the 18th International Joint Conference on Biomedical Engineering Systems and Technologies (BIOSTEC 2025) - Volume 2: HEALTHINF, pages 458-466
ISBN: 978-989-758-731-3; ISSN: 2184-4305
Proceedings Copyright © 2025 by SCITEPRESS – Science and Technology Publications, Lda.

most studies have focused on specific noise types or
detectors Christiansen et al. (1996); Oster and Clif-
ford (2015). There is a need for comprehensive anal-
ysis on how different real-world noise types affect ML
model accuracy, which is critical to improving the re-
liability and effectiveness of IoMT systems in prac-
tice.
In this paper, we evaluate the impact of differ-
ent noise types on the performance of two ML mod-
els for predicting cardiac conditions: Atrial Fibrilla-
tion (AF) and Ventricular Tachycardia (VT). Specif-
ically, we analyze baseline wander, muscle artifact
noise, and electrode motion artifacts. Our experi-
ments were conducted using datasets from the Phy-
sioNet repository, including the MIT-BIH Atrial Fib-
rillation Database (AFDB) for AF detection and the
MIT-BIH Normal Sinus Rhythm (NSRDB) and Ma-
lignant Ventricular Ectopy (VFDB) databases for VT
detection.
To simulate real-world noise conditions, we began
with clean signals from the databases and artificially
introduced three types of noise using the MIT-BIH
Noise Stress Test Dataset (NSTDB). We tested var-
ious noise intensities, ranging from -12dB to 12dB,
and applied noise over three different durations (25%,
50%, and 75% of the signal length).
Additionally, to assess the practical impact of
noise, we employed state-of-the-art noise-removal
techniques after introducing the artificial noise, mim-
icking the typical preprocessing steps used in IoMT
signal analysis. The performance of two state-of-the-
art ML models for AF detection Zhou et al. (2015)
and VT detection Mohammad-Taheri et al. (2016)
was then evaluated.
Our findings show that the accuracy of the AF de-
tection model gradually decreases as both the inten-
sity and duration of noise increase. This pattern was
consistent across all noise types, with electrode mo-
tion artifacts having the most significant negative im-
pact on the AF detector’s performance. In contrast,
the VT detection model demonstrated exceptional ro-
bustness, showing little to no degradation from any
type of noise, regardless of its intensity.
These results suggest that, while the current VT
detection model Mohammad-Taheri et al. (2016) is
highly resilient, further research should prioritize im-
proving the noise robustness of AF detection models
to enhance their reliability in IoMT devices.
2 BACKGROUND AND RELATED
WORK
Over the years, many researchers have leveraged elec-
trocardiogram (ECG) signals to diagnose cardiac ab-
normalities such as VT and AF Kaplan Berkaya et al.
(2018); Guandalini et al. (2019); Ramkumar et al.
(2018); Mandala and Di (2017). Among the tech-
niques used for ECG signal analysis, the application
of machine learning Strik et al. (2023) and deep learn-
ing Murat et al. (2021) has gained significant atten-
tion. Additionally, there is growing interest in uti-
lizing not only specialized medical devices but also
general-purpose devices such as smartwatches Burke
et al. (2020) and smartphones Chong et al. (2018) for
this purpose.
2.1 Ventricular Tachycardia
Ventricular Tachycardia (VT) is a type of tachycardia
that originates from rapid, abnormal electrical activ-
ity in the ventricles Wellens (2001). Since VT is a de-
fibrillable rhythm, it can be corrected and restored to
normal sinus rhythm if cardiopulmonary resuscitation
(CPR) and defibrillation are promptly administered.
Consequently, the reliable and rapid detection of VT
is critical for any medical device or system managing
cardiac arrhythmias. Several approaches have been
proposed for the detection and classification of VT
from ECG signals. Rajeshwari and Kavitha (2021)
provide a comprehensive review of the current state-
of-the-art techniques for feature extraction and clas-
sification algorithms used in ventricular fibrillation
(VF) detection. Ramakrishnan et al. (2017) integrated
these techniques into an Automatic External Defibril-
lator (AED), which delivers a shock when ventricular
fibrillation (VF) or rapid VT is detected. Their al-
gorithm extracts features from slope, time, and fre-
quency domains to classify the rhythms and deter-
mine if a shock is necessary. Aparna et al. (2017);
Aparna and Sharma (2020) proposed an algorithm
that detects VT by analyzing the morphological fea-
tures of ECG signals and classifying them using sup-
port vector machines (SVM).
Among the various methods for detecting VT, one
of the most effective is the approach proposed by
Mohammad-Taheri et al. (2016). They developed
three algorithms based on analyzing the slope his-
togram, slope count, and slope complexity of ECG
signals. These methods analyze all slope values
within an 8-second window, comparing the distri-
butions of normal sinus rhythm (NSR) and VT sig-
nals. NSR typically exhibits regular patterns with
abrupt changes in slope in the QRS segments, result-
Assessing Signal Noise Effects on Machine Learning Models for ECG-Based Cardiac Diagnosis
459

ing in a super-Gaussian distribution, whereas VT sig-
nals display a broader range, often appearing Gaus-
sian or sub-Gaussian. The slope count method proved
to be the most effective, achieving an overall accu-
racy of over 96.5%. The ATTICUS platform utilizes
this algorithm, and the authors suggest a discrimina-
tive threshold count of 91 for distinguishing VT from
NSR Laudato et al. (2021b).
2.2 Atrial Fibrillation
Atrial Fibrillation (AF) is a prevalent and dangerous
cardiac condition and the leading cause of cardioem-
bolic stroke Migdady et al. (2021). Affecting mil-
lions globally, the early identification of AF is cru-
cial for maintaining health. AF is associated with an
increased risk of stroke, heart failure, and mortality,
significantly impacting the quality and longevity of
life. Although treatment strategies for AF exist, the
paroxysmal and often minimally symptomatic nature
of AF, especially in its early stages, presents a signifi-
cant challenge for clinicians and researchers Pritchett
(1992). Therefore, there has been a critical need to
develop automated and continuous methods for accu-
rate AF detection.
Over the years, various automated AF detection
methods have been proposed, showing promising re-
sults through heart rhythm analysis Colloca et al.
(2013), support vector machines Mohebbi and Ghas-
semian (2008), machine learning Sepulveda-Suescun
et al. (2017), neural networks Xiong et al. (2017),
and deep learning Yuan et al. (2016). One of the
most accurate AF detection methods on the MIT-
BIH AF database is the approach proposed by Zhou
et al. (2015). Their AF detection algorithm consists
of three main steps. First, the heart rate sequence is
transformed into a symbolic sequence over a set inter-
val. Then, a probability distribution is created from
this sequence, and a simplified version of Shannon
entropy is applied to measure the information con-
tent. Finally, AF episodes are distinguished using a
predefined threshold. After trial and error, a threshold
of 0.639 provided the best results, achieving 97.83%
sensitivity, 99.68% specificity, and an overall accu-
racy of 88.51%.
2.3 Impact of Noise on the Detection of
VT and AF
Noise in ECG signals has long been a significant chal-
lenge in signal analysis, prompting researchers to de-
velop various strategies to mitigate its effects. Some
approaches involve detecting and removing noise be-
fore analysis Hamil et al. (2022); Sadr et al. (2018),
while others focus on creating robust detection al-
gorithms that can tolerate specific noise types within
reasonable levels and intensities Chong et al. (2018).
To our knowledge, no comprehensive studies
have systematically analyzed the impact of real-world
noise types on both AF and VT detection tech-
niques. The closest related works include those by
Christiansen et al. (1996) and Oster and Clifford
(2015). Christiansen et al. (1996) examined the effect
of residual noise levels on identifying patients with
sustained monomorphic ventricular tachycardia (VT)
post-myocardial infarction. They analyzed ECGs
from 16 patients with documented VT and 41 patients
without VT, using noise levels of 0.2µV and 0.4µV .
Their findings showed that signal-averaged ECGs per-
formed better at a noise level of 0.4µV compared to
0.2µV for identifying VT patients. While lowering
noise levels increased sensitivity, it significantly re-
duced specificity. Unlike their work, our research fo-
cuses on more impactful noise types—baseline wan-
der, muscle artifact, and electrode motion—rather
than residual noise.
Oster and Clifford (2015) conducted an in-depth
analysis of AF detection algorithms under different
noise conditions and QRS detection accuracy. They
found a linear decrease in AF detection accuracy as
SNR decreased, and demonstrated that an automatic
signal quality index could maintain AF detection ac-
curacy above 95% when analyzing segments with a
median Spectral Quality Index (SQI) over 0.8. While
their study primarily addressed muscle artifact noise
and AF detection, our research expands the analysis
to include multiple noise types and detection meth-
ods, including VT.
3 EMPIRICAL STUDY DESIGN
The goal of our study is to assess the impact of var-
ious types of noise on the performance of machine
learning models designed to detect atrial fibrillation
(AF) and ventricular tachycardia (VT). Specifically,
our investigation is guided by the following research
questions (RQs):
• RQ
1
: To what extent does noise affect the perfor-
mance of a state-of-the-art atrial fibrillation detec-
tion model?
• RQ
2
: To what extent does noise impact the de-
tection accuracy of a state-of-the-art ventricular
tachycardia detection model?
RQ
1
aims to evaluate the robustness of highly accu-
rate rhythm detection methods, particularly those re-
lying solely on R-peak information, such as the atrial
HEALTHINF 2025 - 18th International Conference on Health Informatics
460

fibrillation detector. In contrast, RQ
2
seeks to assess
the robustness of a precise ventricular tachycardia de-
tector, based on the ECG signal slopes.
3.1 Experimental Context
The context of our study involves ECG signals col-
lected from both healthy individuals and patients di-
agnosed with atrial fibrillation and ventricular tachy-
cardia. For this purpose, we utilized three datasets:
the MIT-BIH Atrial Fibrillation Database (AF-DB)
for AF detection, the MIT-BIH Malignant Ventricular
Ectopy Database (VF-DB) for VT detection, and the
MIT-BIH Normal Sinus Rhythm Database (NSR-DB)
as a baseline dataset representing healthy individuals.
AF-DB contains 25 long-term ECG recordings
from individuals with atrial fibrillation, each lasting
10 hours and sampled at 250 Hz. VF-DB includes
22 half-hour ECG recordings from individuals who
experienced episodes of sustained ventricular tachy-
cardia, ventricular flutter, and ventricular fibrillation.
NSR-DB consists of 18 long-term ECG recordings
from individuals with no significant arrhythmia, in-
cluding 5 men (aged 26-45) and 13 women (aged 20-
50). Finally, the Noise Stress Test Database provides
12 half-hour ECG recordings and 3 half-hour noise
recordings simulating common noise sources in am-
bulatory ECG recordings.
3.2 Experimental Procedure
For atrial fibrillation (AF) detection, we adopted the
methodology proposed by Zhou et al. (2015). This
method includes three key steps:
• Converting the heart rate (HR) sequence into a
symbolic sequence within a fixed interval.
• Constructing a probability distribution from the
word sequence derived from the symbolic se-
quence.
• Utilizing a simplified version of Shannon entropy
to quantify the information content of the HR se-
quence, allowing binary classification of ECG sig-
nals as AF or non-AF.
This approach was selected for its strong perfor-
mance, low computational complexity, and presumed
robustness due to its focus on R-peaks, which are less
susceptible to signal noise compared to other ECG
features, such as the P-wave Laudato et al. (2021a).
For ventricular tachycardia (VT) detection,
we implemented the methodology proposed by
Mohammad-Taheri Mohammad-Taheri et al. (2016).
This approach involves three algorithms based on
analyzing the slope of the ECG signals:
• Analyzing the number of QRS peaks that exceed a
predefined threshold within an 8-second window.
• Counting these peaks to establish a boundary
value that can correctly classify more than 96%
of the signals.
• Using a threshold of 91 peaks, as identified in the
ATTICUS platform, to discriminate between VT
and normal sinus rhythm (NSR) Laudato et al.
(2021b).
In the context of our study, we analyzed the effects of
three distinct types of noise:
• Baseline Wander (BW): Caused primarily by res-
piration and body movements.
• Muscle Artifact (MA): Resulting from the electri-
cal activity of muscles.
• Electrode Motion Artifact (EM): Induced by tem-
porary loss of electrode adhesion to the skin..
To address our research questions, we injected these
noise types into ECG sequences before processing
them with the respective detectors. We manipulated
two parameters for each noise type: (i) duration (the
percentage of the ECG signal affected by noise); and
(ii) intensity (the magnitude of the disturbance).
We tested three duration levels for each
noise/methodology combination: 25%, 50%,
and 75%. For negative instances (healthy signals),
noise was uniformly distributed throughout the
signal. For positive instances (signals with AF or
VT), noise was introduced starting from a randomly
chosen point within the segment where the AF/VT
event occurs. This approach helps determine if
the noise can obscure the presence of an AF/VT
event when applying the detector. To ensure robust
results, each analysis was repeated ten times, with
the average results reported. To inject the noise in
the signals, we used noise recordings from the Noise
Stress Test Database for the three noise types. The
noise signal was resampled to match the desired
window length and added to a specific segment of
the ECG signal. The noise was scaled according to
a specified signal-to-noise ratio (SNR) to simulate
realistic conditions. The noise pattern was then
applied to the ECG signal by adding the noise signal
to the ECG data. For intensity, we used the SNR scale
from Mohd Apandi et al. (2020), which includes
these values: [-12, -6, -3, 0, +3, +6, +12] dB. We
evaluated each detection approach (with and without
noise) at the specified noise durations and intensities.
Sensitivity and specificity were measured for each
model/noise combination. Figure 1 illustrates an
example of a 2-second ECG signal fragment from the
NSRDB dataset, showing the original signal and the
signal affected by BW, MA, and EM noise types.
Assessing Signal Noise Effects on Machine Learning Models for ECG-Based Cardiac Diagnosis
461
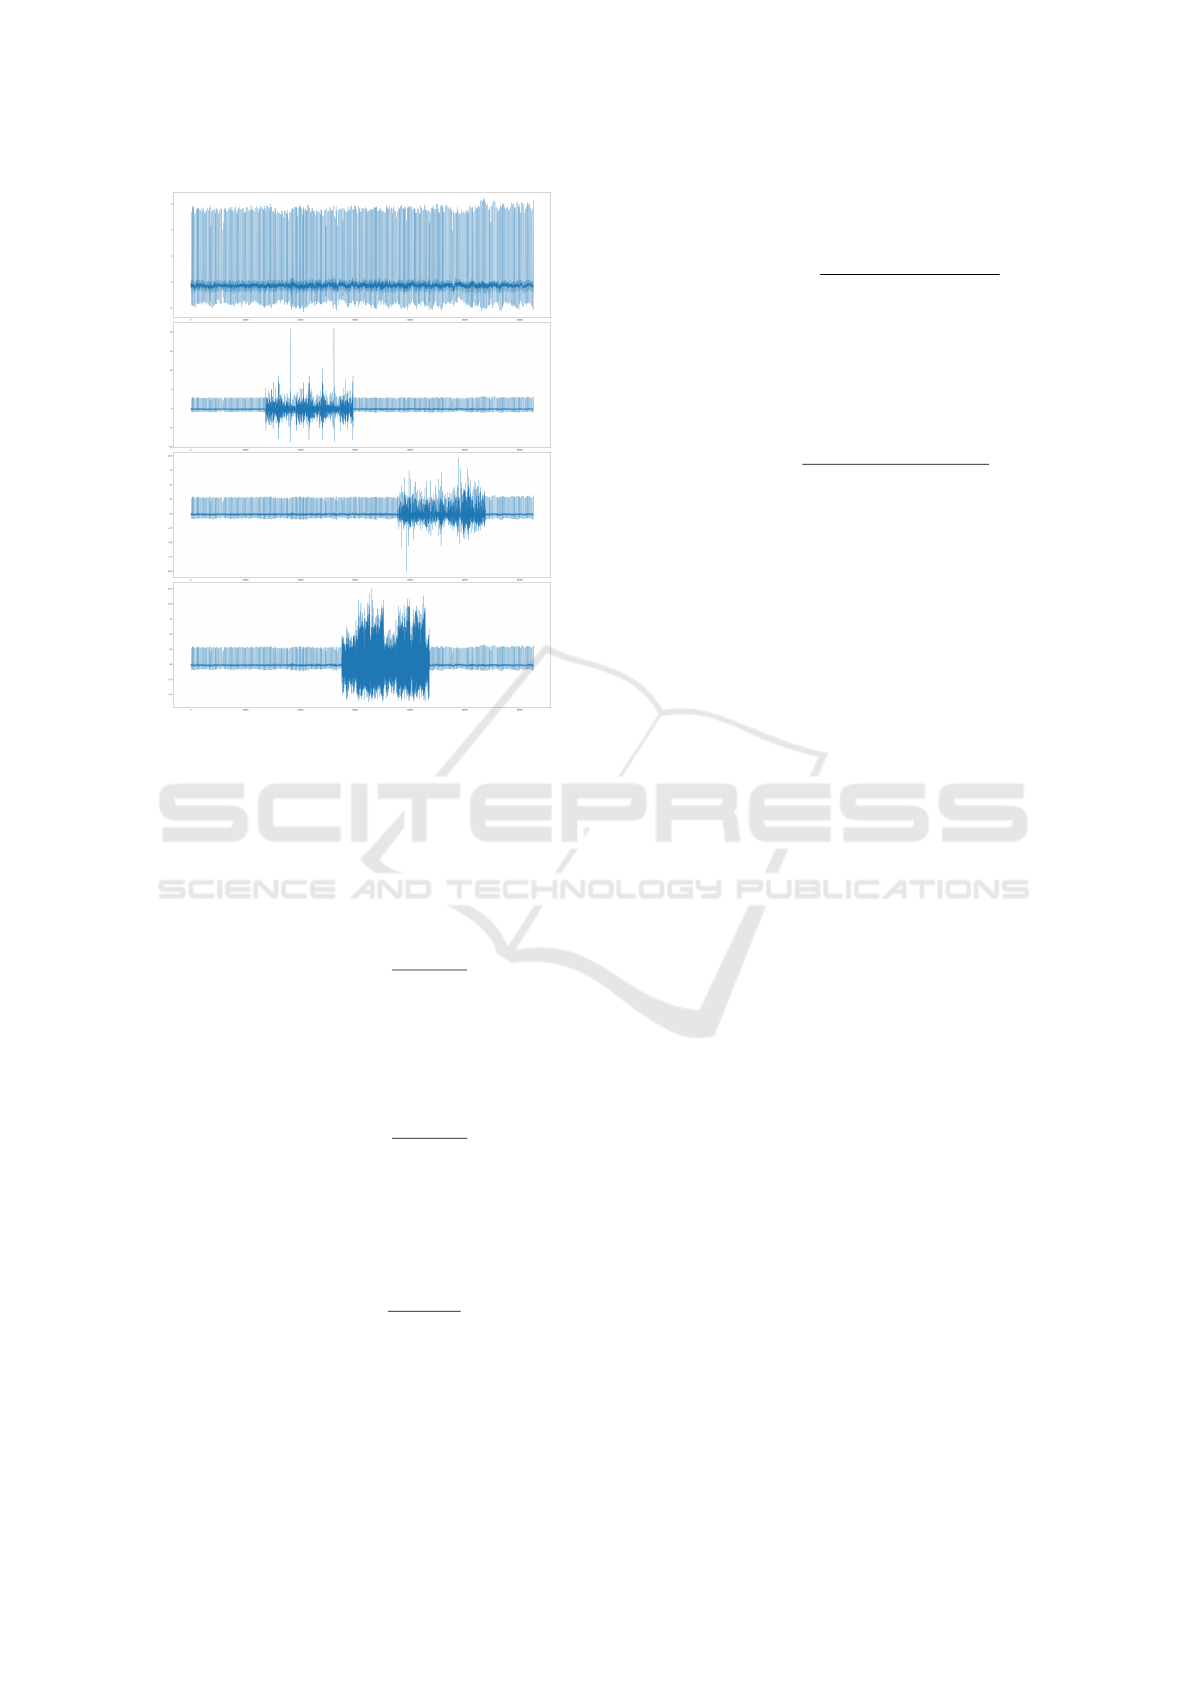
Figure 1: Original ECG signal and the version of the ECG
affected by Baseline Wander (BW), Muscle Artifact (MA),
and Electrode Motion (EM) noise types at -12 dB intensity
and 25% duration.
For each combination of detector (AF/VT), noise
type, duration, and intensity, we report the metrics:
• Sensitivity or Recall (True Positive Rate): Pro-
portion of actual positives correctly identified by
the model. Calculated as:
Sensitivity =
T P
T P + FN
High sensitivity indicates effective detection of
true positive cases.
• Specificity (True Negative Rate): Proportion of
actual negatives correctly identified.
Specificity =
T N
T N + FP
High specificity means accurate identification of
true negatives.
• Precision (Positive Predictive Value): Propor-
tion of positive identifications that are actually
correct.
Precision =
T P
T P + FP
High precision indicates a low rate of false posi-
tives among predicted positives, reducing the bur-
den on medical teams.
• F1-Score: Harmonic mean of precision and sen-
sitivity, balancing the trade-off between them.
F1-Score = 2 ×
Precision × Sensitivity
Precision + Sensitivity
A high F1-score reflects a good balance between
precision and sensitivity, minimizing false posi-
tives and false negatives.
• Accuracy: Overall correctness of the model, cal-
culated as:
Accuracy =
T P + T N
(T P + T N + FP + FN)
Accuracy provides a general measure of model
performance across both positive and negative
cases.
It is worth noting that after the introduction of ar-
tificial noise, we employed standard noise-removal
methods Kher (2019). Specifically, our preprocessing
procedure consists of the following steps:
• First Stage: A high-pass filter with a cutoff
frequency of 1 Hz is applied to remove low-
frequency components typical of baseline wander
(around 0.5 Hz) and to reduce signal drifting.
• Second Stage: A low-pass filter with a cutoff
frequency of 30 Hz is used to eliminate high-
frequency noise, such as interspersion and muscle
noise.
This preprocessing, in addition to being a standard
procedure for ECG analysis, is the same method used
in the VT detection approach Amann et al. (2005).
Additionally, it is important to mention that we ap-
plied the same noise-removal preprocessing for both
AF and VT detection. This consistency was neces-
sary because the baseline VT approach incorporated
this preprocessing as a core component. On the other
hand, the baseline AF approach, which begins with
a heart rate sequence, did not specify any particular
noise-removal method.
4 ANALYSIS OF THE RESULTS
This section presents the results obtained from the ex-
periments described in the previous section.
4.1 RQ
1
: Atrial Fibrillation Robustness
Table 1 shows the results for AF detection across
varying noise intensities and durations for all three
noise types. It is important to note that 12dB rep-
resents the absence of noise (i.e.,, the performance
HEALTHINF 2025 - 18th International Conference on Health Informatics
462

Table 1: Atrial Fibrillation detection performance across varying noise intensities, durations, and types.
Duration = 25%
Baseline Wander Muscle Artifact Electrode Motion
Intensity Specificity Precision Sensitivity Accuracy F1 Specificity Precision Sensitivity Accuracy F1 Specificity Precision Sensitivity Accuracy F1
-12dB 0.99 1.00 0.83 0.90 0.91 0.99 1.00 0.80 0.89 0.89 1.00 1.00 0.77 0.87 0.87
-6dB 0.91 0.93 0.92 0.91 0.92 0.90 0.92 0.89 0.90 0.91 1.00 1.00 0.77 0.87 0.87
-3dB 0.84 0.88 0.88 0.87 0.88 0.94 0.95 0.89 0.91 0.92 0.91 0.91 0.77 0.83 0.83
0dB 0.94 0.95 0.88 0.90 0.91 0.97 0.98 0.87 0.91 0.92 0.87 0.89 0.77 0.82 0.83
3dB 0.98 0.99 0.88 0.92 0.93 0.99 1.00 0.88 0.93 0.94 0.93 0.94 0.80 0.86 0.87
6dB 0.99 0.99 0.84 0.91 0.91 1.00 1.00 0.86 0.92 0.92 0.99 0.99 0.83 0.90 0.90
12dB 1.00 1.00 0.83 0.90 0.90 1.00 1.00 0.83 0.90 0.90 1.00 1.00 0.83 0.90 0.90
Duration = 50%
Baseline Wander Muscle Artifact Electrode Motion
Intensity Specificity Precision Sensitivity Accuracy F1 Specificity Precision Sensitivity Accuracy F1 Specificity Precision Sensitivity Accuracy F1
-12dB 0.17 0.61 0.99 0.63 0.75 0.73 0.83 1.00 0.88 0.90 1.00 1.00 0.53 0.74 0.70
-6dB 0.43 0.67 0.91 0.70 0.77 0.20 0.61 0.98 0.64 0.75 1.00 1.00 0.64 0.80 0.78
-3dB 0.74 0.82 0.91 0.84 0.86 0.49 0.70 0.95 0.75 0.81 1.00 1.00 0.67 0.81 0.80
0dB 0.94 0.95 0.87 0.90 0.91 0.82 0.87 0.91 0.87 0.89 0.90 0.90 0.70 0.79 0.79
3dB 0.99 0.99 0.83 0.90 0.90 0.99 0.99 0.89 0.93 0.94 0.95 0.95 0.75 0.83 0.83
6dB 1.00 1.00 0.83 0.90 0.90 1.00 1.00 0.85 0.92 0.92 0.94 0.94 0.81 0.87 0.87
12dB 1.00 1.00 0.83 0.90 0.90 1.00 1.00 0.83 0.90 0.90 1.00 1.00 0.83 0.90 0.90
Duration = 75%
Baseline Wander Muscle Artifact Electrode Motion
Intensity Specificity Precision Sensitivity Accuracy F1 Specificity Precision Sensitivity Accuracy F1 Specificity Precision Sensitivity Accuracy F1
-12dB 0.01 0.56 0.97 0.55 0.71 0.11 0.59 0.98 0.60 0.73 1.00 1.00 0.03 0.46 0.09
-6dB 0.70 0.80 0.91 0.82 0.85 0.16 0.60 0.99 0.62 0.75 1.00 1.00 0.13 0.51 0.22
-3dB 0.93 0.94 0.87 0.90 0.90 0.60 0.75 0.91 0.78 0.82 1.00 1.00 0.23 0.57 0.37
0dB 0.96 0.97 0.83 0.89 0.89 0.84 0.88 0.91 0.88 0.90 0.75 0.67 0.39 0.55 0.49
3dB 1.00 1.00 0.83 0.90 0.90 0.98 0.99 0.87 0.92 0.92 0.86 0.84 0.55 0.69 0.66
6dB 1.00 1.00 0.83 0.90 0.90 1.00 1.00 0.83 0.90 0.91 0.94 0.94 0.78 0.85 0.85
12dB 1.00 1.00 0.83 0.90 0.90 1.00 1.00 0.83 0.90 0.90 1.00 1.00 0.81 0.90 0.90
of the model without any noise), while -12dB indi-
cates the highest noise intensity. On the datasets used,
the AF detection approach achieved an accuracy of
0.90, a sensitivity of 0.83, and a specificity and preci-
sion of 1.00. The results indicate that different noise
types and their associated variables (intensity and du-
ration) affect the AF detection model in varying de-
grees. However, it is evident that both noise intensity
and, more critically, noise duration significantly de-
crease the effectiveness of the model. As expected,
increasing the duration of any noise type significantly
reduces the performance of the model. The most pro-
nounced degradation occurs with the highest noise in-
tensity (-12dB) and the longest duration (75%), par-
ticularly with electrode motion (EM) noise. In this
scenario, accuracy drops by 48.8%, and the F1 score
decreases by 90%. This suggests that the AF detec-
tion approach by Zhou et al. (2015) is highly inef-
fective when signals are heavily affected by EM ar-
tifacts. For baseline wander (BW) and muscle arti-
fact (MA) noise, the accuracy reductions (38.8% and
33.3%, respectively) and F1 score reductions (21.1%
and 18.8%) are more moderate.
A deeper analysis reveals that for BW and MA
noise, precision decreases while sensitivity (recall)
increases as noise levels rise. This implies that the
model tends to classify more instances as AF-positive,
albeit with an increasing number of false positives.
This behavior likely occurs because the AF detection
algorithm primarily identifies anomalies in R-R inter-
vals, and both BW and MA noise may introduce peaks
that are mistaken for R-peaks, leading the model to
detect false anomalies. However, it is important to
note that the number of true positives remains stable
(or even increases slightly) as noise increases. This
suggests that while BW and MA noise lead to higher
false positive rates, the model still maintains a good
ability to detect actual AF cases. Conversely, with
EM noise, the opposite trend is observed: precision
increases while sensitivity decreases as noise levels
rise. This indicates that the model tends to classify
most instances as AF-negative, making the algorithm
unreliable as it may fail to detect true AF events.
4.2 RQ
2
: Ventricular Tachycardia
Robustness
Table 2 presents the results for VT detection. Our
findings indicate that increasing the intensity and
duration of baseline wander (BW), muscle artifact
(MA), and electrode motion (EM) noise does not sig-
nificantly affect the reliability of the VT detector.
This suggests a high level of robustness to noisy sig-
nals.
As shown, there are only minor performance
drops under extreme noise conditions (e.g.,, 75% du-
ration, 3dB BW noise), but these are negligible in
most practical scenarios (e.g.,, 1.1% lower accu-
racy and F1-score). In conclusion, noise perturbation
does not significantly impact the performance of the
state-of-the-art VT detector Mohammad-Taheri et al.
(2016), regardless of the intensity level, duration, or
type of noise.
4.3 Threats to Validity
Though we used carefully annotated datasets, some
noise may still be present, and the automated noise
generation may not capture all real-world variations
To enhance reliability, experiments were repeated
Assessing Signal Noise Effects on Machine Learning Models for ECG-Based Cardiac Diagnosis
463

Table 2: Ventricular Tachycardia detection performance across varying noise intensities, durations, and types.
Duration = 25%
Baseline Wander Muscle Artifact Electrode Motion
Intensity Specificity Precision Sensitivity Accuracy F1 Specificity Precision Sensitivity Accuracy F1 Specificity Precision Sensitivity Accuracy F1
-12dB 0.86 0.86 0.95 0.90 0.90 0.86 0.86 0.95 0.90 0.90 0.86 0.86 0.95 0.90 0.90
-6dB 0.86 0.86 0.95 0.90 0.90 0.86 0.86 0.95 0.90 0.90 0.86 0.86 0.95 0.90 0.90
-3dB 0.86 0.86 0.95 0.90 0.90 0.86 0.86 0.95 0.90 0.90 0.86 0.86 0.95 0.90 0.90
0dB 0.86 0.86 0.95 0.90 0.90 0.86 0.86 0.95 0.90 0.90 0.86 0.86 0.95 0.90 0.90
3dB 0.86 0.86 0.95 0.90 0.90 0.86 0.86 0.95 0.90 0.90 0.86 0.86 0.95 0.90 0.90
6dB 0.86 0.86 0.95 0.90 0.90 0.86 0.86 0.95 0.90 0.90 0.86 0.86 0.95 0.90 0.90
12dB 0.86 0.86 0.95 0.90 0.90 0.86 0.86 0.95 0.90 0.90 0.86 0.86 0.95 0.90 0.90
Duration = 50%
Baseline Wander Muscle Artifact Electrode Motion
Intensity Specificity Precision Sensitivity Accuracy F1 Specificity Precision Sensitivity Accuracy F1 Specificity Precision Sensitivity Accuracy F1
-12dB 0.84 0.84 0.95 0.89 0.89 0.85 0.85 0.95 0.90 0.90 0.84 0.85 0.95 0.89 0.89
-6dB 0.85 0.85 0.95 0.90 0.90 0.86 0.86 0.95 0.90 0.90 0.85 0.85 0.95 0.90 0.90
-3dB 0.86 0.86 0.95 0.90 0.90 0.85 0.85 0.95 0.90 0.90 0.86 0.86 0.95 0.90 0.90
0dB 0.86 0.86 0.95 0.90 0.90 0.85 0.85 0.95 0.90 0.90 0.86 0.86 0.95 0.90 0.90
3dB
0.86 0.86 0.95 0.90 0.90 0.86 0.86 0.95 0.90 0.90 0.86 0.86 0.95 0.90 0.90
6dB 0.86 0.86 0.95 0.90 0.90 0.86 0.86 0.95 0.90 0.90 0.86 0.86 0.95 0.90 0.90
12dB 0.86 0.86 0.95 0.90 0.90 0.86 0.86 0.95 0.90 0.90 0.86 0.86 0.95 0.90 0.90
Duration = 75%
Baseline Wander Muscle Artifact Electrode Motion
Intensity Specificity Precision Sensitivity Accuracy F1 Specificity Precision Sensitivity Accuracy F1 Specificity Precision Sensitivity Accuracy F1
-12dB 0.84 0.85 0.95 0.90 0.90 0.83 0.84 0.95 0.89 0.89 0.82 0.83 0.95 0.89 0.89
-6dB 0.83 0.83 0.95 0.89 0.89 0.83 0.84 0.95 0.89 0.89 0.85 0.85 0.96 0.90 0.90
-3dB 0.84 0.84 0.95 0.89 0.89 0.85 0.85 0.95 0.90 0.90 0.84 0.84 0.95 0.89 0.89
0dB 0.85 0.85 0.95 0.90 0.90 0.85 0.85 0.95 0.90 0.90 0.86 0.86 0.95 0.90 0.90
3dB 0.85 0.85 0.95 0.90 0.90 0.85 0.85 0.95 0.90 0.90 0.85 0.85 0.95 0.90 0.90
6dB 0.85 0.85 0.95 0.90 0.90 0.85 0.85 0.95 0.90 0.90 0.86 0.86 0.95 0.90 0.90
12dB 0.85 0.85 0.95 0.90 0.90 0.86 0.86 0.95 0.90 0.90 0.86 0.86 0.95 0.90 0.90
multiple times, and average results were reported.
Moreover, the study’s results are constrained by the
specific AF and VT detection algorithms used, which
may not generalize to other algorithms or populations.
5 CONCLUSION AND FUTURE
WORK
This study focused on the impact of common noise
types encountered in signals acquired through IoMT
devices—namely, baseline wander (BW), muscle ar-
tifact (MA), and electrode motion (EM)—on the de-
tection of two critical conditions: Atrial Fibrillation
(AF) and Ventricular Tachycardia (VT). Our find-
ings demonstrate that VT detection remained robust
across different noise conditions. In contrast, AF
detection was more vulnerable, with precision and
sensitivity significantly impacted by baseline wander
(BW), muscle artifact (MA), and electrode motion
(EM) noise. Practitioners should therefore be cau-
tious when deploying AF detection systems in envi-
ronments prone to noise, especially EM noise. Future
work should focus on developing more noise-resistant
AF detection algorithms and expanding research to
encompass a wider range of noise types and patient
populations to ensure generalizability and accuracy in
real-world settings.
ACKNOWLEDGMENTS
This study was conducted within the project funded
by Next Generation EU – “Age-It - Ageing Well in an
Ageing Society” project (PE0000015), National Re-
covery and Resilience Plan (NRRP) - PE8 - Mission
4, C2, Intervention 1.3. The views and opinions ex-
pressed are only those of the authors and do not nec-
essarily reflect those of the European Union or the Eu-
ropean Commission. Neither the European Union nor
the European Commission can be held responsible for
them. The authors would like to thank Aldo Palombo
for the support in the initial phase of this work.
REFERENCES
Amann, A., Tratnig, R., and Unterkofler, K. (2005). Re-
liability of old and new ventricular fibrillation detec-
tion algorithms for automated external defibrillators.
Biomedical engineering online, 4:1–15.
Aparna, P., Mirajkar, P., and Prabhu, R. (2017). Detec-
tion and classification of ventricular tachycardia using
svm. In International Journal of Innovative Research
in Electrical, Electronics, Instrumentation and Con-
trol Engineering, National Conference on Advances
in Electrical Engineering, volume 5, pages 116–120.
Aparna, P. and Sharma, K. M. (2020). Detection of a fib
and its classification using svm. In 2020 2nd Interna-
tional Conference on Innovative Mechanisms for In-
dustry Applications (ICIMIA), pages 116–120.
Balestrieri, E., Boldi, F., Colavita, A. R., De Vito, L.,
Laudato, G., Oliveto, R., Picariello, F., Rivaldi, S.,
Scalabrino, S., Torchitti, P., et al. (2019). The architec-
ture of an innovative smart t-shirt based on the internet
of medical things paradigm. pages 1–6.
Burke, J., Haigney, M. C., Borne, R., and Krantz, M. J.
(2020). Smartwatch detection of ventricular tachy-
cardia: Case series. HeartRhythm Case Reports,
6(10):800–804.
Chong, J. W., Cho, C. H., Tabei, F., Le-Anh, D., Esa, N.,
Mcmanus, D. D., and Chon, K. H. (2018). Motion and
noise artifact-resilient atrial fibrillation detection us-
HEALTHINF 2025 - 18th International Conference on Health Informatics
464

ing a smartphone. IEEE Journal on Emerging and Se-
lected Topics in Circuits and Systems, 8(2):230–239.
Christiansen, E. H., Frost, L., MØlgaar, H., Nielsen, T. T.,
and Pedersen, A. K. (1996). Noise in the signal-
averaged electrocardiogram and accuracy for identi-
fication of patients with sustained monomorphic ven-
tricular tachycardia after myocardial infarction. Euro-
pean Heart Journal, 17(6):911–916.
Colloca, R., Johnson, A. E., Mainardi, L., and Clifford,
G. D. (2013). A support vector machine approach for
reliable detection of atrial fibrillation events. In Com-
puting in Cardiology 2013, pages 1047–1050. IEEE.
Guandalini, G. S., Liang, J. J., and Marchlinski, F. E.
(2019). Ventricular tachycardia ablation. JACC: Clin-
ical Electrophysiology, 5(12):1363–1383.
Hamil, H., Zidelmal, Z., Azzaz, M. S., Sakhi, S., Kaibou,
R., Djilali, S., and Ould Abdeslam, D. (2022). De-
sign of a secured telehealth system based on multiple
biosignals diagnosis and classification for iot applica-
tion. Expert Systems, 39(4):e12765.
Kaplan Berkaya, S., Uysal, A. K., Sora Gunal, E., Ergin, S.,
Gunal, S., and Gulmezoglu, M. B. (2018). A survey
on ecg analysis. Biomedical Signal Processing and
Control, 43:216–235.
Kher, R. (2019). Signal processing techniques for removing
noise from ecg signals. Journal of Biomedical Engi-
neering and Research.
Laudato, G., Boldi, F., Colavita, A. R., Rosa, G., Scal-
abrino, S., Lazich, A., and Oliveto, R. (2021a). Com-
bining rhythmic and morphological ecg features for
automatic detection of atrial fibrillation: local and
global prediction models. In Biomedical Engineering
Systems and Technologies: 13th International Joint
Conference, BIOSTEC 2020, Valletta, Malta, Febru-
ary 24–26, 2020, Revised Selected Papers 13, pages
425–441. Springer.
Laudato, G., Scalabrino, S., Colavita, A. R., Chiac-
chiari, Q., D’Orazio, R., Donadelli, R., De Vito,
L., Picariello, F., Tudosa, I., Malatesta, R., et al.
(2021b). Atticus: Ambient-intelligent tele-monitoring
and telemetry for incepting and catering over hu-
man sustainability. Frontiers in Human Dynamics,
3:614309.
Mandala, S. and Di, T. C. (2017). Ecg parameters for ma-
lignant ventricular arrhythmias: a comprehensive re-
view. Journal of medical and biological engineering,
37(4):441–453.
Migdady, I., Russman, A., and Buletko, A. B. (2021). Atrial
fibrillation and ischemic stroke: a clinical review. In
Seminars in Neurology, volume 41, pages 348–364.
Thieme Medical Publishers, Inc.
Mohammad-Taheri, S., Shirazi, M.-A. M., and Rafiezade,
A. (2016). Slope analysis based methods for detection
of ventricular fibrillation and ventricular tachycardia.
In 2016 24th Iranian Conference on Electrical Engi-
neering (ICEE), pages 1100–1103. IEEE.
Mohd Apandi, Z. F., Ikeura, R., Hayakawa, S., and Tsut-
sumi, S. (2020). An analysis of the effects of noisy
electrocardiogram signal on heartbeat detection per-
formance. Bioengineering, 7(2):53.
Mohebbi, M. and Ghassemian, H. (2008). Detection of
atrial fibrillation episodes using svm. In 2008 30th
annual international conference of the IEEE engineer-
ing in medicine and biology society, pages 177–180.
IEEE.
Murat, F., Sadak, F., Yildirim, O., Talo, M., Murat, E., Kara-
batak, M., Demir, Y., Tan, R.-S., and Acharya, U. R.
(2021). Review of deep learning-based atrial fibrilla-
tion detection studies. International Journal of Envi-
ronmental Research and Public Health, 18(21).
Oster, J. and Clifford, G. D. (2015). Impact of the presence
of noise on rr interval-based atrial fibrillation detec-
tion. Journal of Electrocardiology, 48(6):947–951.
Pritchett, E. L. (1992). Management of atrial fibrillation.
New England Journal of Medicine, 326(19):1264–
1271.
Rajeshwari, M. and Kavitha, K. (2021). A review of
feature extraction from ecg signals and classifica-
tion/detection for ventricular arrhythmias. Rec. Ad-
van. Comp. Sci. Commun, 14(1):192–200.
Ramakrishnan, S., Akshaya, V., Kishor, S., and Thyagara-
jan, T. (2017). Real time implementation of arrhyth-
mia classification algorithm using statistical methods.
In 2017 Trends in Industrial Measurement and Au-
tomation (TIMA), pages 1–4.
Ramkumar, S., Nerlekar, N., D’Souza, D., Pol, D. J.,
Kalman, J. M., and Marwick, T. H. (2018). Atrial
fibrillation detection using single lead portable elec-
trocardiographic monitoring: a systematic review and
meta-analysis. BMJ open, 8(9):e024178.
Sadr, N., Jayawardhana, M., Pham, T. T., Tang, R., Balaei,
A. T., and de Chazal, P. (2018). A low-complexity
algorithm for detection of atrial fibrillation using an
ecg. Physiological measurement, 39(6):064003.
Sepulveda-Suescun, J., Murillo-Escobar, J., Urda-Benitez,
R., Orrego-Metaute, D., and Orozco-Duque, A.
(2017). Atrial fibrillation detection through heart
rate variability using a machine learning approach
and poincare plot features. In VII Latin American
Congress on Biomedical Engineering CLAIB 2016,
Bucaramanga, Santander, Colombia, October 26th-
28th, 2016, pages 565–568. Springer.
Strik, M., Sacristan, B., Bordachar, P., Duchateau, J.,
Eschalier, R., Mondoly, P., Laborderie, J., Gassa,
N., Zemzemi, N., Laborde, M., Garrido, J., Ma-
tencio Perabla, C., Jimenez-Perez, G., Camara, O.,
Ha
¨
ıssaguerre, M., Dubois, R., and Ploux, S. (2023).
Artificial intelligence for detection of ventricular over-
sensing: Machine learning approaches for noise de-
tection within nonsustained ventricular tachycardia
episodes remotely transmitted by pacemakers and im-
plantable cardioverter-defibrillators. Heart Rhythm,
20(10):1378–1384. Focus Issue: Sudden Death.
Wellens, H. J. (2001). Ventricular tachycardia: diagnosis
of broad qrs complex tachycardia. Heart, 86(5):579–
585.
Xiong, Z., Stiles, M. K., and Zhao, J. (2017). Robust ecg
signal classification for detection of atrial fibrillation
using a novel neural network. In 2017 Computing in
Cardiology (CinC), pages 1–4. IEEE.
Assessing Signal Noise Effects on Machine Learning Models for ECG-Based Cardiac Diagnosis
465

Yuan, C., Yan, Y., Zhou, L., Bai, J., and Wang, L. (2016).
Automated atrial fibrillation detection based on deep
learning network. In 2016 IEEE International Con-
ference on Information and Automation (ICIA), pages
1159–1164. IEEE.
Zhou, X., Ding, H., Wu, W., and Zhang, Y. (2015). A
real-time atrial fibrillation detection algorithm based
on the instantaneous state of heart rate. PloS one,
10(9):e0136544.
HEALTHINF 2025 - 18th International Conference on Health Informatics
466
