
MILI: Biophotonics Technology for In-Situ, Fast, Accurate and
Cost-Effective Milk Analysis
Panayiota Demosthenous
1 a
, Maria Aspri
2 b
, Maria Moyseos
1 c
and Marios Sergides
1 d
1
Cy.R.I.C. Cyprus Research and Innovation Center Ltd, 28th October Avenue, 2414 Nicosia, Cyprus
2
Dept. of Agricultural Sciences, Biotechnology and Food Science, Cyprus University of Technology, 3036 Limassol, Cyprus
Keywords:
Fluorometry, Biophotonics, Biosensors, Optical Analysis, Automated System, Food Safety, Milk Analysis,
Embedded Electronics.
Abstract:
Contaminated milk poses serious health risks to consumers, highlighting the need for efficient detection meth-
ods. Currently, the dairy industry relies on precise but time-consuming laboratory methods that require special-
ized personnel. The work presented here aims to address this by developing a fast, cost-effective and reliable
system for detecting common contaminants in milk at the farm level. The MILI device is based on state-of-the-
art biophotonics, combining customised biosensors, optical analysis, electronics, and software modules. The
detection method relies on the use of fluorometry, where the signal originating from labelled antibodies bound
to specific analytes (antibiotics and toxins) is measured. Two different chromophore molecules suspended in
buffer and milk solutions were used to test the detection capabilities of the device with excitation/emission
wavelengths at 562 nm/584 nm and 650 nm/665 nm, respectively. We describe the different modules of the
device and present a detailed experimental work performed to validate the device operation and extract perfor-
mance parameters such as the limit of detection in terms of chromophore concentration, accuracy, sensitivity,
and specificity. The obtained results demonstrate reliable detection of low chromophore concentrations (<100
pM), with repeatability and robustness confirmed under different conditions, making the MILI system an ideal
candidate for rapid, cost-effective contamination detection device.
1 INTRODUCTION
The World Health Organization (WHO) has recog-
nized food contamination as a global challenge in
several reports (World Health Organization, 2015;
Fukuda, 2015). Nearly 1 in 10 people worldwide be-
come ill by consuming contaminated food, leading to
420,000 deaths annually (World Health Organization,
2022). For this reason, and as a legal and quality re-
quirement for the dairy industry, controls must be per-
formed in various stages of the value chain and in all
batches of the final product. While pasteurization, a
crucial step in milk processing, significantly reduces
the risk of food-borne illnesses by eliminating most
harmful pathogens, it does not address certain con-
taminants, such as chemical residues like Aflatoxin-
M1 or residues from veterinary treatments, includ-
a
https://orcid.org/0000-0001-5088-9029
b
https://orcid.org/0000-0001-5876-3922
c
https://orcid.org/0009-0005-3003-6519
d
https://orcid.org/0000-0002-4344-4416
ing antibiotics (e.g., penicillin, enrofloxacin, sulfa-
doxine, streptomycin, trimethoprim, marbofloxacin).
The presence of such substances in raw milk is reg-
ulated in most countries and even minute quantities
will demand the discard of the milk (Olatoye et al.,
2016), due to the severity of the impact on human
health.
The diary industry uses laboratory methods such
as chromatography, immunoassays, and mass spec-
troscopy for the detection of Aflatoxin-M1 and an-
tibiotics residues in milk (Gaudin, 2017; Vercelli
et al., 2023; Getahun et al., 2023; Matabaro et al.,
2017). Despite their precise and quantitative analysis
of samples, these methods are time-consuming (up to
3 hours or even longer if outsourced), expensive and
require specialised staff. Furthermore, they are usu-
ally performed after milk is loaded onto transport ve-
hicles to dairy factories. Therefore, if a small portion
of the loaded milk is contaminated, the contamina-
tion will spread to the whole load leading to wasted
supply. Consequently, the financial losses to both
the farmers (penalties based on regulation for deliver-
64
Demosthenous, P., Aspri, M., Moyseos, M. and Sergides, M.
MILI: Biophotonics Technology for In-Situ, Fast, Accurate and Cost-Effective Milk Analysis.
DOI: 10.5220/0013130100003902
In Proceedings of the 13th International Conference on Photonics, Optics and Laser Technology (PHOTOPTICS 2025), pages 64-73
ISBN: 978-989-758-736-8; ISSN: 2184-4364
Copyright © 2025 by Paper published under CC license (CC BY-NC-ND 4.0)
ing contaminated milk) and the receiving dairy facto-
ries (reduced milk quantities therefore production im-
pacts) are vast. Rapid screening methods, such as lat-
eral flow strips, can detect analytes within 10-40 min-
utes, but often generate a high rate of false positives
and lack specificity for different types of antibiotics
and in cases of positive results, a laboratory test con-
firmation is nevertheless needed, imposing additional
costs and delays. These factors increase the need for
the development of portable, highly integrated, and
cost-effective devices in the field of food quality con-
trol. State-of-the-art concepts such as electrochemi-
cal (Singh et al., 2023; Reinholds et al., 2015), opti-
cal (Gast
´
elum-Barrios et al., 2020; Yeh et al., 2017;
Surkova et al., 2023; Souroullas et al., 2024), lab-on-
a-chip (Buzzin et al., 2022; Manolis et al., 2024) tech-
niques are being employed to achieve this.
In this work, we present a device aiming to solve
these issues, through designing and developing a
novel method to simultaneously detect in less than 10
minutes, a selected panel of common milk contam-
inants for analysis at the farm (before loading con-
taminated milk for transportation) and at the receiv-
ing dairy industry level. The MILI device is based on
optical biosensors offering the analytical performance
of laboratory-based methods, at a cost comparable to
that of quick screening tests. The system is based on a
sensitive mini-fluorometer setup that monitors the sig-
nal from fluorescence emitting biosensors that specif-
ically bind on the selected analyte. The conceptual
biosensor (not presented here) consists of derivatiza-
tion and functionalization of a surface with antibod-
ies specific to the selected contaminants. The recom-
binant or the natural antigen is labelled with a fluo-
rophore and it is then mixed with the milk sample.
The resulting solution is then added to the functional-
ized surface and the competition between labelled and
unlabelled analytes inside the sample is evaluated by
the emitted fluorescence intensity i.e. decrease with
higher concentrations of the analyte in the sample
(Pennacchio et al., 2016). Here, the capability of the
device to detect contaminant concentrations dictated
by EU regulations translated to merely dye-molecules
or labelled antigens is demonstrated.
2 SYSTEM IMPLEMENTATION
This section describes: a) the system general archi-
tecture, b) the optical configuration, c) the overall in-
tegrated system, and d) the mobile application as the
graphical user interface.
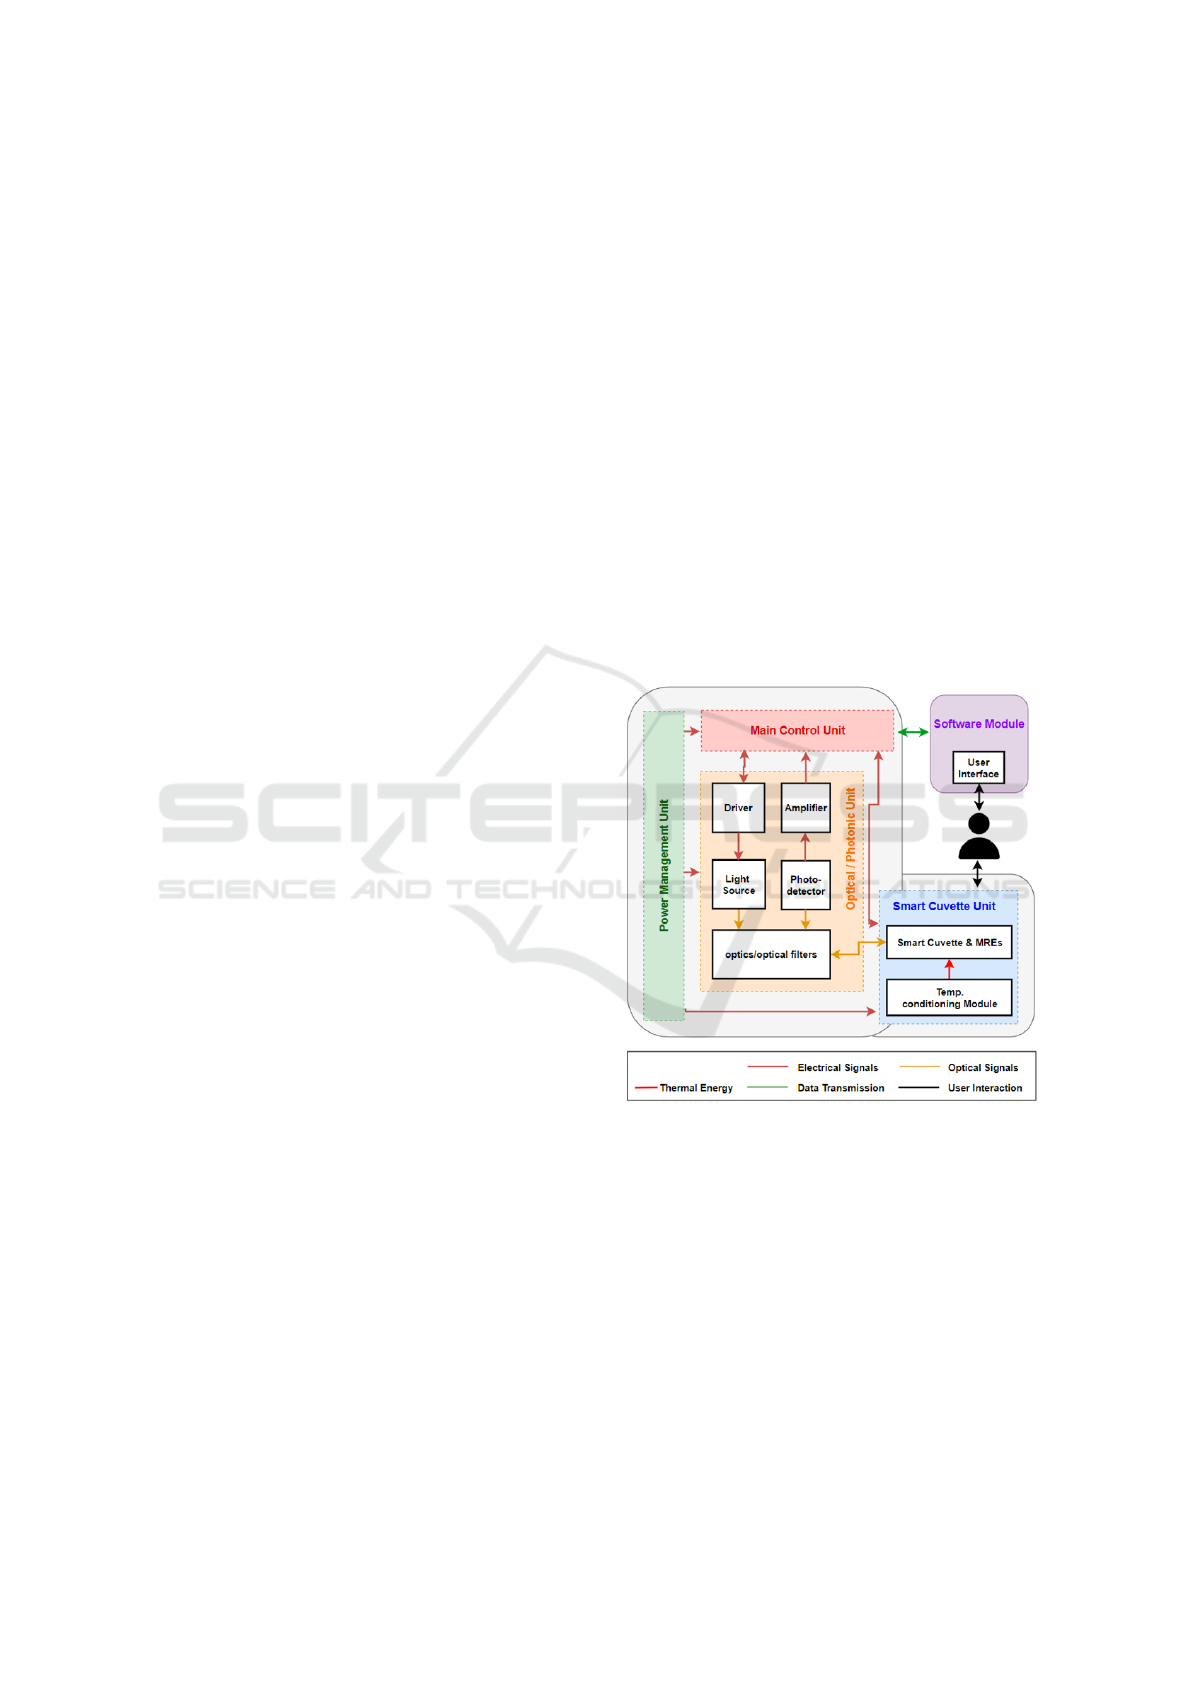
2.1 System Architecture
The general architecture of the MILI system presents
the different units/modules of the system (Figure 1),
as well as the user interaction that involves the man-
ual import of the milk sample, and the control of the
device and results visualisation via a mobile app. Fo-
cus is noted on the ‘Optical/Photonic Unit’ that con-
sists of the excitation light source, the photodetector
and the optical components, but also on the ‘Smart
Cuvette Unit’ that consists of a functionalised cu-
vette, and temperature conditioning module to keep
the sample at a stable temperature during measure-
ments. Moreover, the main control unit is responsible
for all system operations such as, controlling the exci-
tation light source, acquiring the data from the detec-
tor, performing basic calculations and transmitting the
analysis result to the mobile app. Finally, the power
management module is responsible to provide the re-
quired power supply to all different parts of the sys-
tem.
Figure 1: MILI System general architecture.
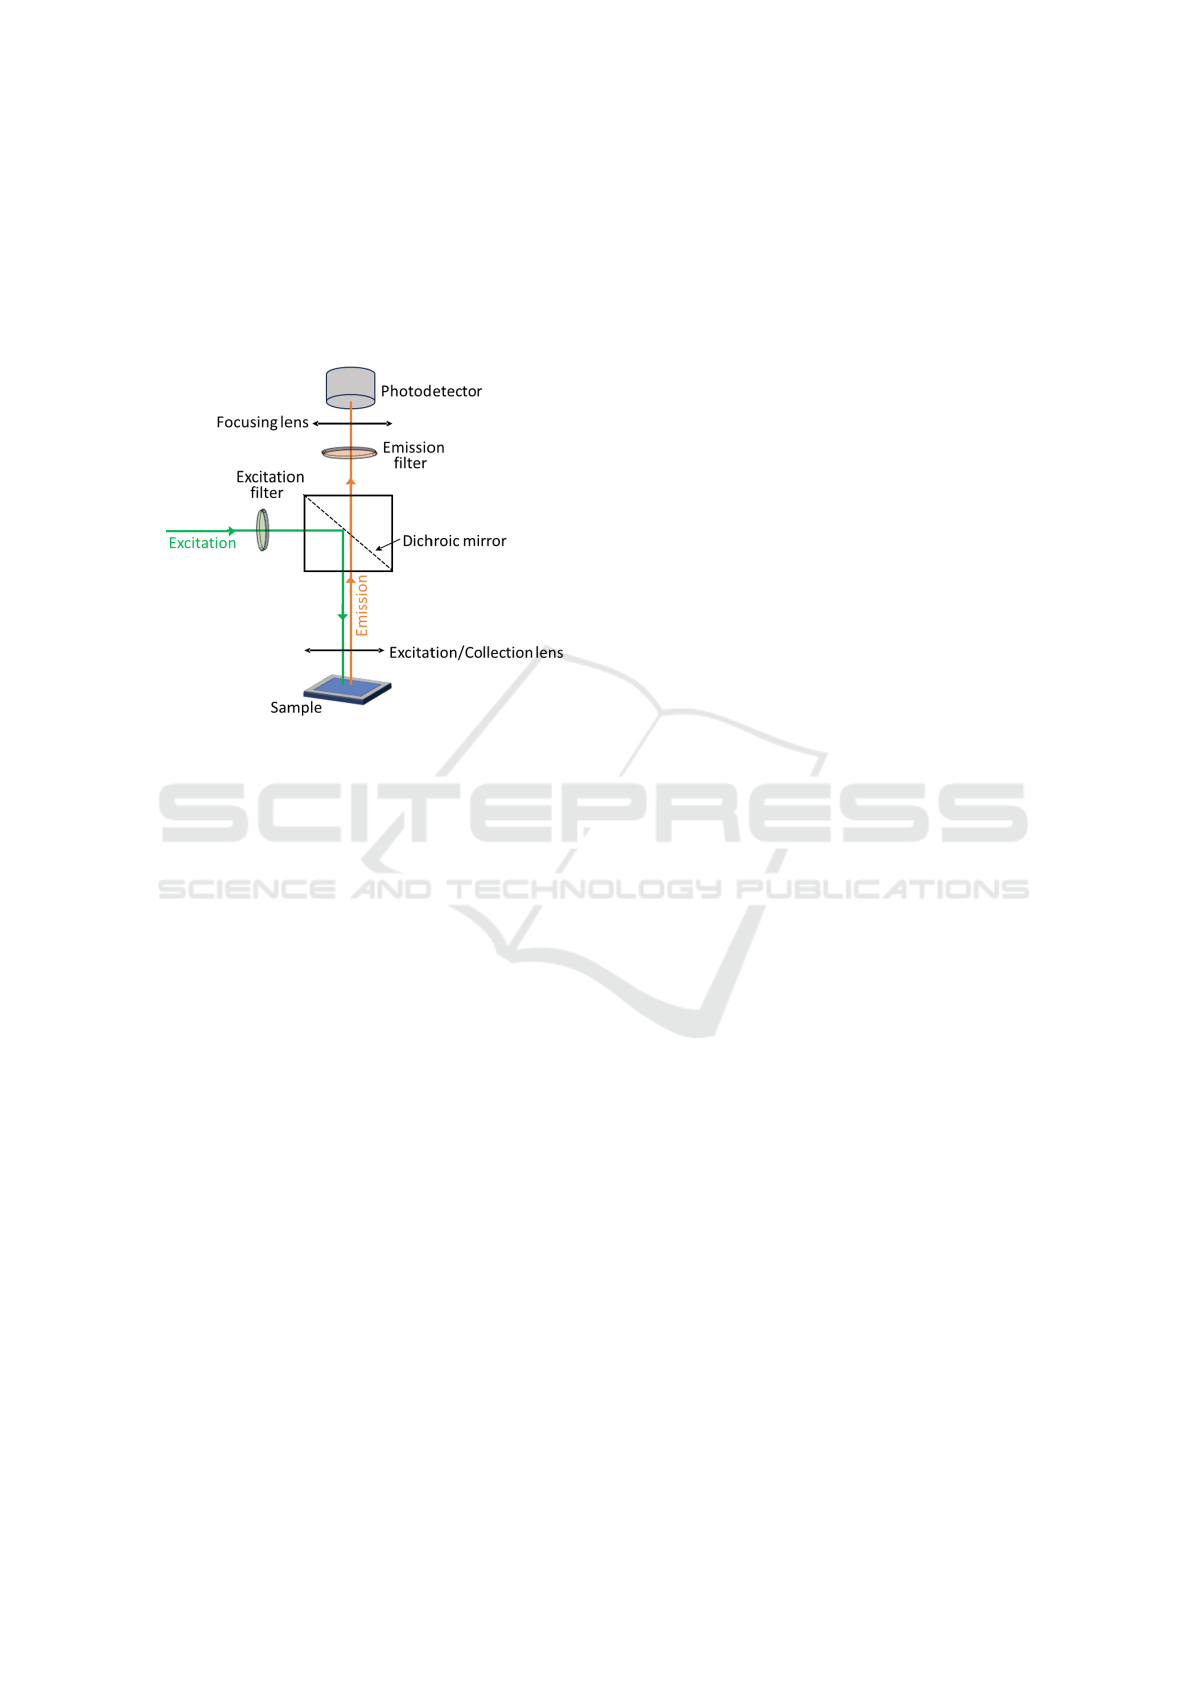
2.2 Optical Module
The optical configuration is based on a simple fluo-
rometer configuration (Figure 2) where light emitted
by the photo-excited sample can be measured. The
optical components were chosen as to excite and de-
tect fluorescence from specific dye molecules that are
widely used to label antibodies specific to the ana-
lytes of interest. The MILI mini-fluorometer appara-
tus has been developed and evaluated in two different
configurations which can be either used with the red
CF®568 or the cyanine-based far-red CF®647 fluo-
MILI: Biophotonics Technology for In-Situ, Fast, Accurate and Cost-Effective Milk Analysis
65
rescent dyes. This was done to account from possible
effects of the sample matrix when excited at differ-
ent wavelengths i.e., emission from the sample itself
which can shield the fluorophore signal. With this in
mind, the system was designed to allow for a straight-
forward and easy switch between different configura-
tions.
Figure 2: Fluorometer configuration. A light source excites
a fluorescent sample which in turn emits at a different wave-
length. The emitted light is then detected by a photodetec-
tor.
In order to achieve a satisfactory limit of detec-
tion (LOD) targeting 10 times less than the maximum
residue limits of EU regulations (Regulation 37/2010,
2010), relatively high excitation powers had to be
considered. This led to the use of a laser system as the
excitation source instead of a cheaper light emitting
diode (LED). Furthermore, due to the narrow band-
width and optimised beam profile laser systems usu-
ally offer, a high signal-to-noise ratio (SNR) could be
achieved which is essential for the detection of low
fluorescence signals considered in these types of ap-
plications.
The experimental work conducted to validate the
optical setup’s capabilities and determine the lowest
detectable dye concentration and thus the estimate
the device’s LOD included dye molecules suspended
in Phosphate buffered saline (PBS) buffer to produce
concentrations ranging from 10 µM down to 0.1 pM.
In all work presented in this paper, the samples were
hosted in black-walled 96-well microplates suitable
for fluorescence-based assays. It is noted that fluo-
rescence emitted from samples of higher concentra-
tions and down to 10 nM was easily observed and dif-
ferentiated from background signal. For this reason,
and for the fact that concentrations higher than 10 nM
are irrelevant to the application in hand (outside of
the range set by EU regulations) results are presented
only for lower concentrations.
2.2.1 Red Fluorescent Dye
The first configuration involved the case where the an-
tibodies were to be labelled by a red fluorescent dye.
The selected dye in this case was CF®568 with ab-
sorption and emission maxima at 562 nm and 584
nm, respectively. It is noted that this labelling reagent
can be directly replaced by any of the following com-
mercially available fluorophores: Alexa Fluor®568,
ATTO 565, Rhodamine Red. Nevertheless, in this
case the secondary excitation peak of CF®568 at 532
nm was chosen since monochromatic sources at this
wavelength are more common and relatively cheaper.
Thus, a diode pumped solid state (DPSS) laser source
at 532 nm and maximum power of 40 mW was used
as the excitation source also eliminating the need for
a bandpass excitation filter due to its narrow linewidth
±1 nm.
The light from the excitation source is incident
on a single-edge dichroic mirror which reflects wave-
lengths below 550 nm. The reflected beam is then
guided through an achromatic triplet lens system
which focuses the beam on the sample area and also
used to collect and colimate the emitted light from
the sample. The emitted light then travels through
the dichroic mirror and passes through an additional
single-band emission filter centred at 580 nm thus
further filtering wavelengths outside the chromophore
emission range. Finally, the light is focused on to the
PMT detector by an additional lens.
In this case the laser diode was modulated at 1 kHz
allowing for a better visualisation of the difference be-
tween signal and background. The data collected dur-
ing experiments showed that the LOD achievable by
the device can be as low as 0.1 pM. Figure 3 shows
the obtained fluorescence signal for the range of dye
concentrations studied along with the modulation ap-
plied to the excitation source.
The obtained results highlight the capability of
the MILI device to detect low concentrations of dye
molecules (underestimate the LOD to 1 pM ∼ 0.0007
ppb for CF567 dye) which fall below the limits set
by EU regulations regarding antibiotics and toxins. It
can be safely assumed that this detection limit can be
applied to the suggested biosensing assay where op-
timally one dye molecule binds to a single antigen.
The effects of the milk matrix in real samples will be
discussed later.
PHOTOPTICS 2025 - 13th International Conference on Photonics, Optics and Laser Technology
66

Figure 3: Modulation and normalised emission signal as
recorded for CF568 diluted in PBS buffer solution for con-
centration range 0.1 – 1000 pM.
2.2.2 Cyanine-Based Far-Red Fluorescent Dye
The second configuration of the optical module
considers the case of cyanine-based far-red chro-
mophores also widely used in biosensing assays.
Namely, results presented here were obtained by us-
ing the CF®647 with absorption and emission max-
ima at 650 nm and 665 nm, respectively. Similarly
to the previous case, these dye molecules can be di-
rectly replaced by a set of other commercially avail-
able fluorophores such as Cy®5, Alexa Fluor®647,
DyLight®649. The laser source used in this configu-
ration has a nominal wavelength at 640 nm and max-
imum power of 35 mW.
The optics configuration is slightly modified from
the previous dye case. The single-edge dichroic mir-
ror now reflects wavelengths below 645 nm and an
additional single-band bandpass optical filter centred
at 642 nm is placed after the laser source to further
reduce unwanted background light. The triplet lens
system used for focusing the excitation beam and col-
lecting the emitted fluorescence remains unchanged.
The single-band emission filter is also switched to one
that is centred at 670 nm.
The experiments with different dye concentration
samples were repeated for this configuration. Figure
4 shows the signal recorded during these measure-
ments. In this case the excitation source was not mod-
ulated but instead the concentration axis was plotted
in logarithmic scale for a clearer representation. The
plotted values are the result of the averaging of mul-
tiple measurements. It is obvious that fluorescence
emission from the 0.01 pM sample can be differen-
tiated from the background signal coming from the
empty well or the PBS buffer sample. It should be
noted that 2500 mV is the maximum signal the spe-
cific PMT can output, with values higher than this
saturating the detector. For this reason, a combina-
tion of neutral density (ND) filters must be used in
cases of higher concentrations to avoid PMT satura-
tion even though this is not needed for this application
purposes.
Figure 4: Fluorescence signal for different CF647 dye con-
centrations (0.01 – 1000 pM) as recorded by the MILI de-
vice. “Empty” denotes background signal from an empty
well and “buffer” signal from merely PBS solution. The y-
axis is in logarithmic scale.
2.3 System Integration
The device components are shown in Figure 5, con-
sisting of the following main electronics parts: a)
main control unit (MCU) with Bluetooth 5.0 connec-
tivity, b) temperature controller with Peltier heat ele-
ment and PT1000 temperature sensor for condition-
ing the sample’s temperature around 30 °C, c) de-
vice powering via four Li-Ion rechargeable batteries
to extent the device operating hours (approximately 8
hours of continuous operation), d) a power bank mod-
ule for charging the Li-Ion batteries via 5V USB, e)
a DC/DC voltage converter (from 5V to ±5V) for op-
erating the PMT detector, and e) a DC/DC voltage
converter (from 5V to 12V) for operating the laser.
Upon validating the optical configuration, the sys-
tem was integrated to combine all modules (elec-
tronic, network, etc) and placed in an enclosure. The
integrated MILI prototype device encapsulated in the
custom 3D-printed black PLA material is presented
in Figure 6, demonstrating a portable device for milk
analysis capable of detection of contaminants in raw
milk samples. It uses a single vial, detached from a
black walled 96-well strip, as the sample-cuvette for
performing analysis on 200 µl of buffer-diluted raw
milk samples. It has dimensions of 183 mm x 56 mm
MILI: Biophotonics Technology for In-Situ, Fast, Accurate and Cost-Effective Milk Analysis
67
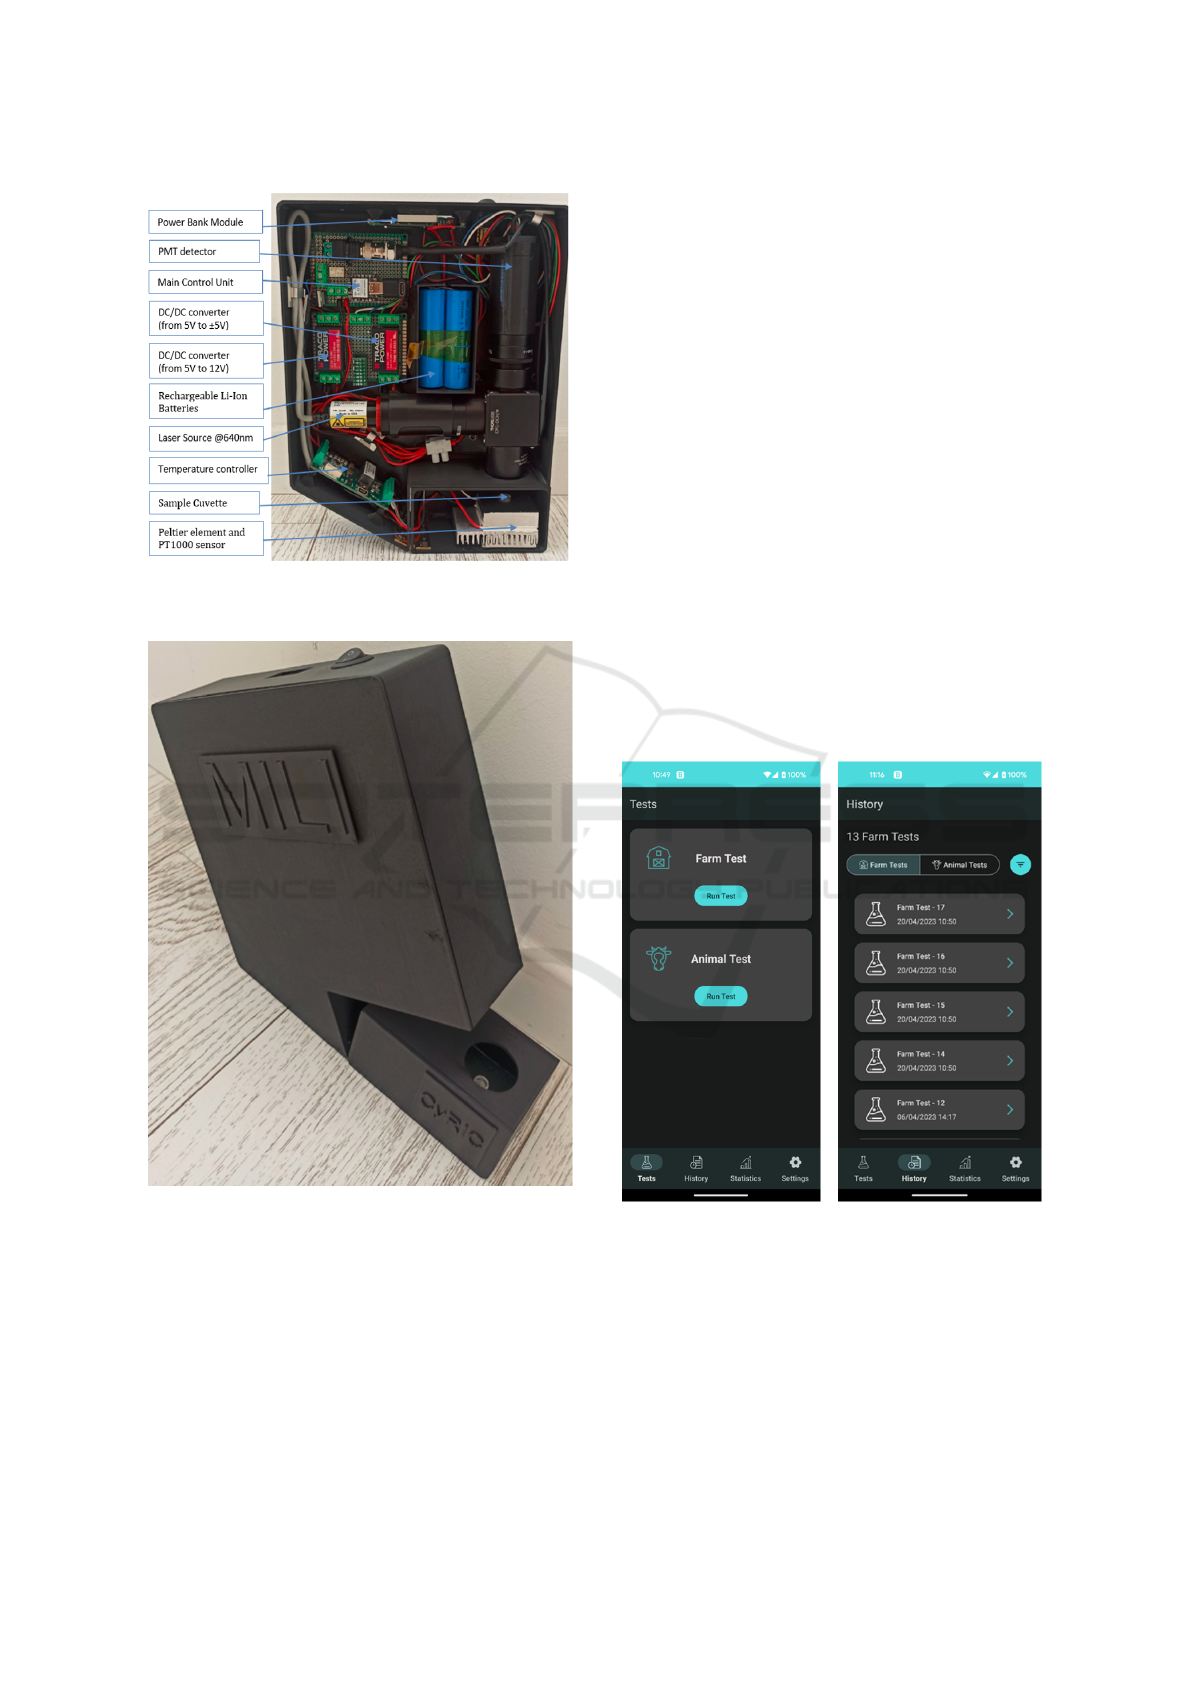
Figure 5: The integrated MILI prototype device in a custom
3D-printed housing.
Figure 6: The MILI prototype device as a portable device
for milk analysis.
x 230 mm and weights 1.3 kg.
2.4 Mobile Application: Graphical User
Interface
A mobile application was developed for the control
and visualisation of the analysis procedure (Figure 7).
The application can automatically search and connect
to a preconfigured (known MAC address) BLE de-
vice. Furthermore, the MCU is configured with a
control-firmware to execute sequentially the follow-
ing procedures for every analysis run: a) the MCU-
Bluetooth (BLE) is advertising until a connection is
established with the mobile application, b) the MCU
waits for a BLE request via the ‘Run Test’ button
on the mobile app graphical user interface (GUI), c)
upon analysis request, a counter runs for a minute
to allow the sample to reach a constant temperature
at 30 °C, d) 10000 measurements are acquired from
the PMT at a sampling rate of 1 Hz prior to switch-
ing on the laser; the average of these measurements
represents the background or noise value, e) the laser
switches ON and the system waits for 3 seconds to
stabilize, f) 10000 measurements are acquired from
the PMT at a sampling rate 1 Hz; the average of these
measurements represents the milk-analysis signal, g)
the MCU sends the result of the analysis in the form
of ’positive’ or ’negative’ to the mobile app via the
BLE connection and then the device is ready for the
next analysis, where procedures c-g will be executed
again.
Figure 7: MILI mobile application used as the graphical
user interface for control and visualisation of an analysis.
For the proper operation of the device, the user
needs to follow the step-by-step instructions: a) Run
the ‘MILI app’ and switch ON the MILI device. The
device should be connected immediately with the mo-
bile app and the green LED on the device left side
will stop flashing periodically and will remain on; this
confirms that the connectivity has been established
PHOTOPTICS 2025 - 13th International Conference on Photonics, Optics and Laser Technology
68
successfully, b) proceed to loading the sample-cuvette
and press the ‘Run Test’ button on the application
GUI, c) wait for approximately 2 minutes and press
the ‘View Results’ button when it appears to view
the results, d) access the menu on the bottom of the
screen to check the historical and statistical results of
the analysis (Figure 7).
3 PRELIMINARY TESTING
The MILI prototype has been tested for its functional-
ity and general behaviour in different conditions such
as: a) use of different types of sample-cuvettes: clear
and black. Black cuvettes are more suitable for fluo-
rescence measurements, while clear cuvettes are eas-
ily accessible, b) use with different types of milk sam-
ples: raw sheep, goat, cow as well as commercially
available cow milk (milk fat content is considered as
a variable parameter in the different milk types, which
in some cases affects the results), c) use of different
dilution of milk in PBS buffer i.e. 1% and 10% (this
was based on previous experiments showing that 1%
milk-buffer exhibits lower absorption of the excitation
wavelength, while 10% aims at reduced dilution of
the milk, resulting to higher analyte concentration in
the sample), d) use of different fluorescent molecules
i.e. CF647 molecules for calibration and characterisa-
tion purposes, and labelled penicillin-G (PenG) with
CF647 simulating the analysis assay. The following
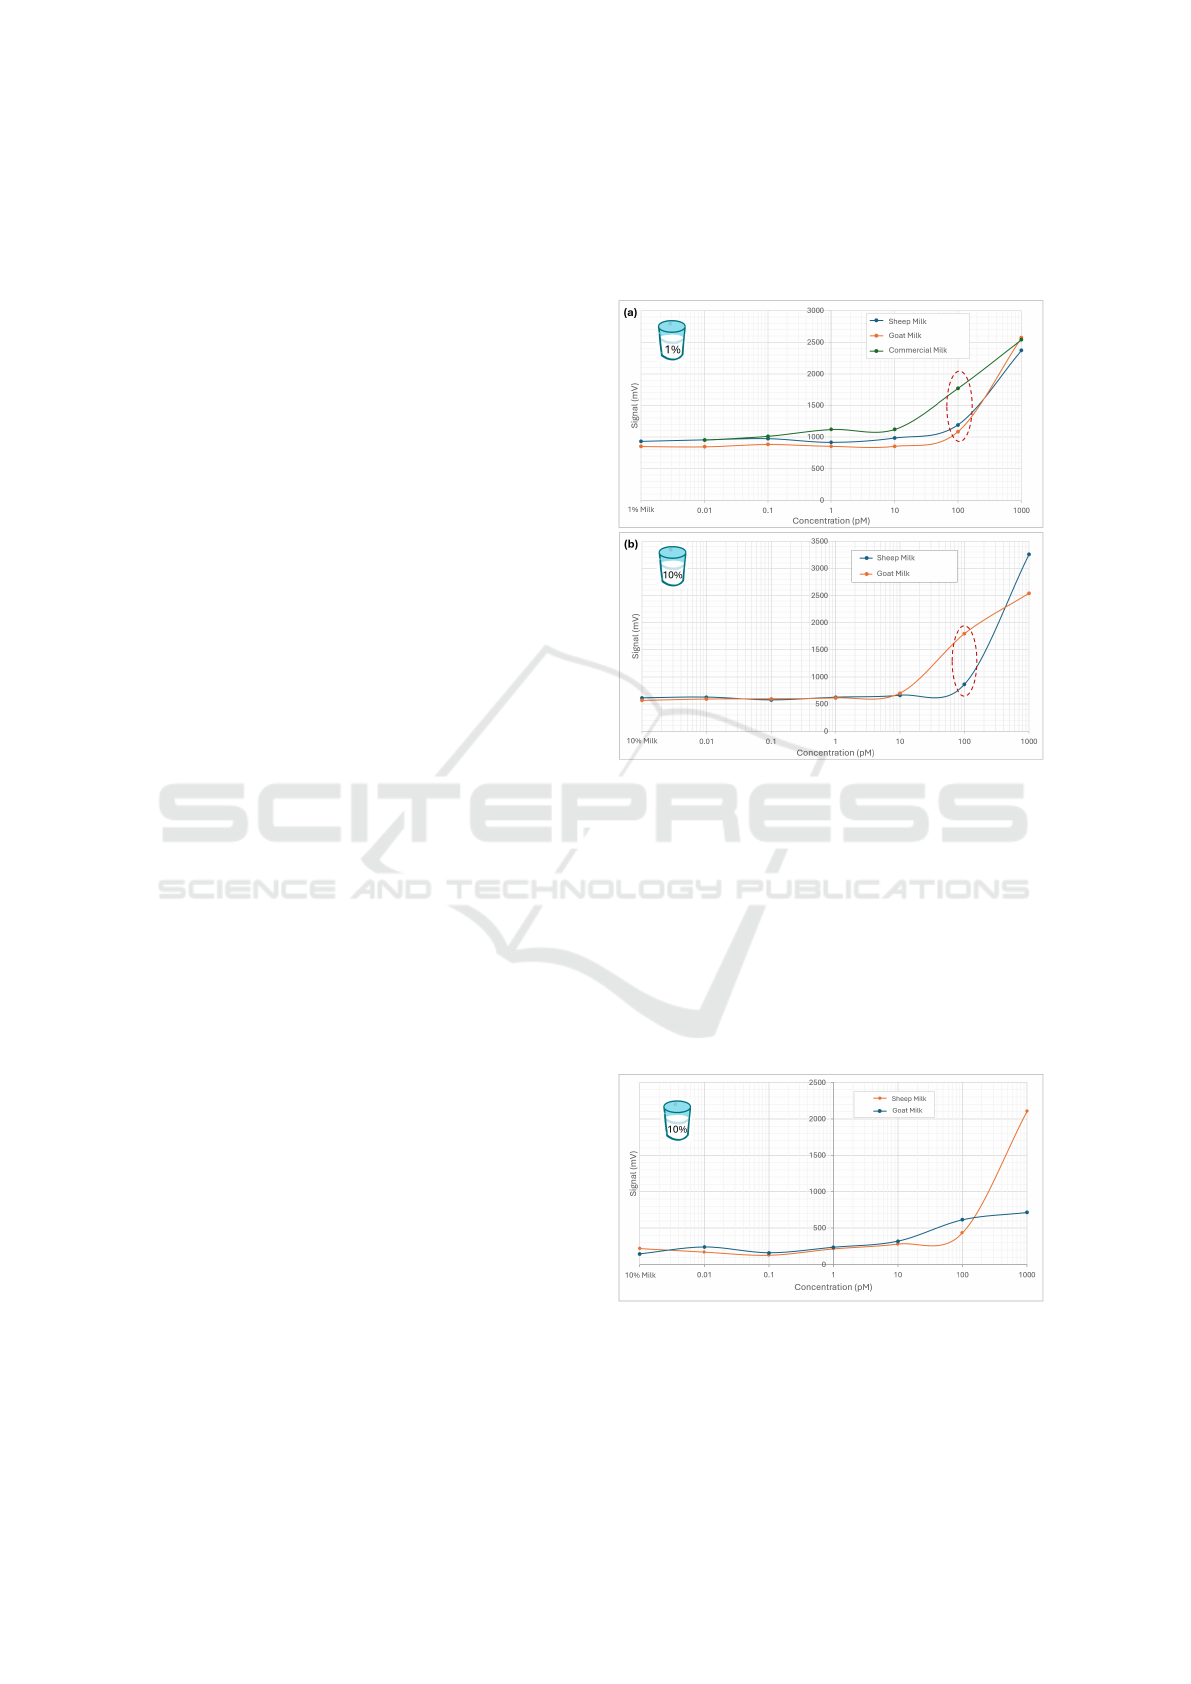
experiments employ clear cuvettes with 1% and 10%
milk-buffer samples, and three different milk types:
goat, sheep, and commercially available milk, spiked
with different CF647 dye concentrations. The re-
sults show higher background signal in the case of
1% milk-buffer (∼1000 mV) (Figure 8a) compared to
10% (∼600 mV) (Figure 8b). This is most likely due
to increased reflection of the excitation light from the
clear-cuvette walls, combined with the lower absorp-
tion from the milk matrix, resulting to a higher de-
tectable background signal. The minimum detectable
concentration is 100 pM especially in the case of 10%
milk-buffer, where the background signal is lower.
The worsening of the detectable limit compared to the
results obtained prior integration is due to a combina-
tion of the effects originating from the milk matrix
and use of compact electronics used to drive the inte-
grated system in contrast with the transparent buffer
solution and the more expensive laboratory equip-
ment used during the evaluation experiments. More-
over, sheep milk has a higher fat content than goat
milk which causes a lower fluorescence signal for the
100 pM dye-concentration, since fat further absorbs
the excitation light, which in turn reduces photolumi-
nescence. Analogous behaviour is presented in the
case of the commercial milk (Figure 8a), which con-
tains less fat than both raw sheep and goat milk, there-
fore higher fluorescence signal is induced.
Figure 8: Tests with clear cuvettes and milk samples with
(a) 1% and (b) 10% milk:buffer spiked with different CF
647 dye concentrations.
Based on the above results, 10% milk-to-buffer
ratio was used for the following experiments, where
black cuvettes were tested. As expected, black cu-
vettes showed lower background signal, which in turn
made the 10 pM dye concentration observable. On
the other hand, 1 pM dye concentration can be barely
considered detectable, since the voltage difference
from the background signal almost falls within the
signal noise level (∼30mV).
Figure 9: Tests with black cuvettes and 10% milk-buffer
solutions at different dyes concentrations.
The next experiments used raw cow milk. Simi-
larly, 10% milk-buffer samples have been tested (Fig-
ure 10a), while this time labelled PenG (PenG647)
MILI: Biophotonics Technology for In-Situ, Fast, Accurate and Cost-Effective Milk Analysis
69
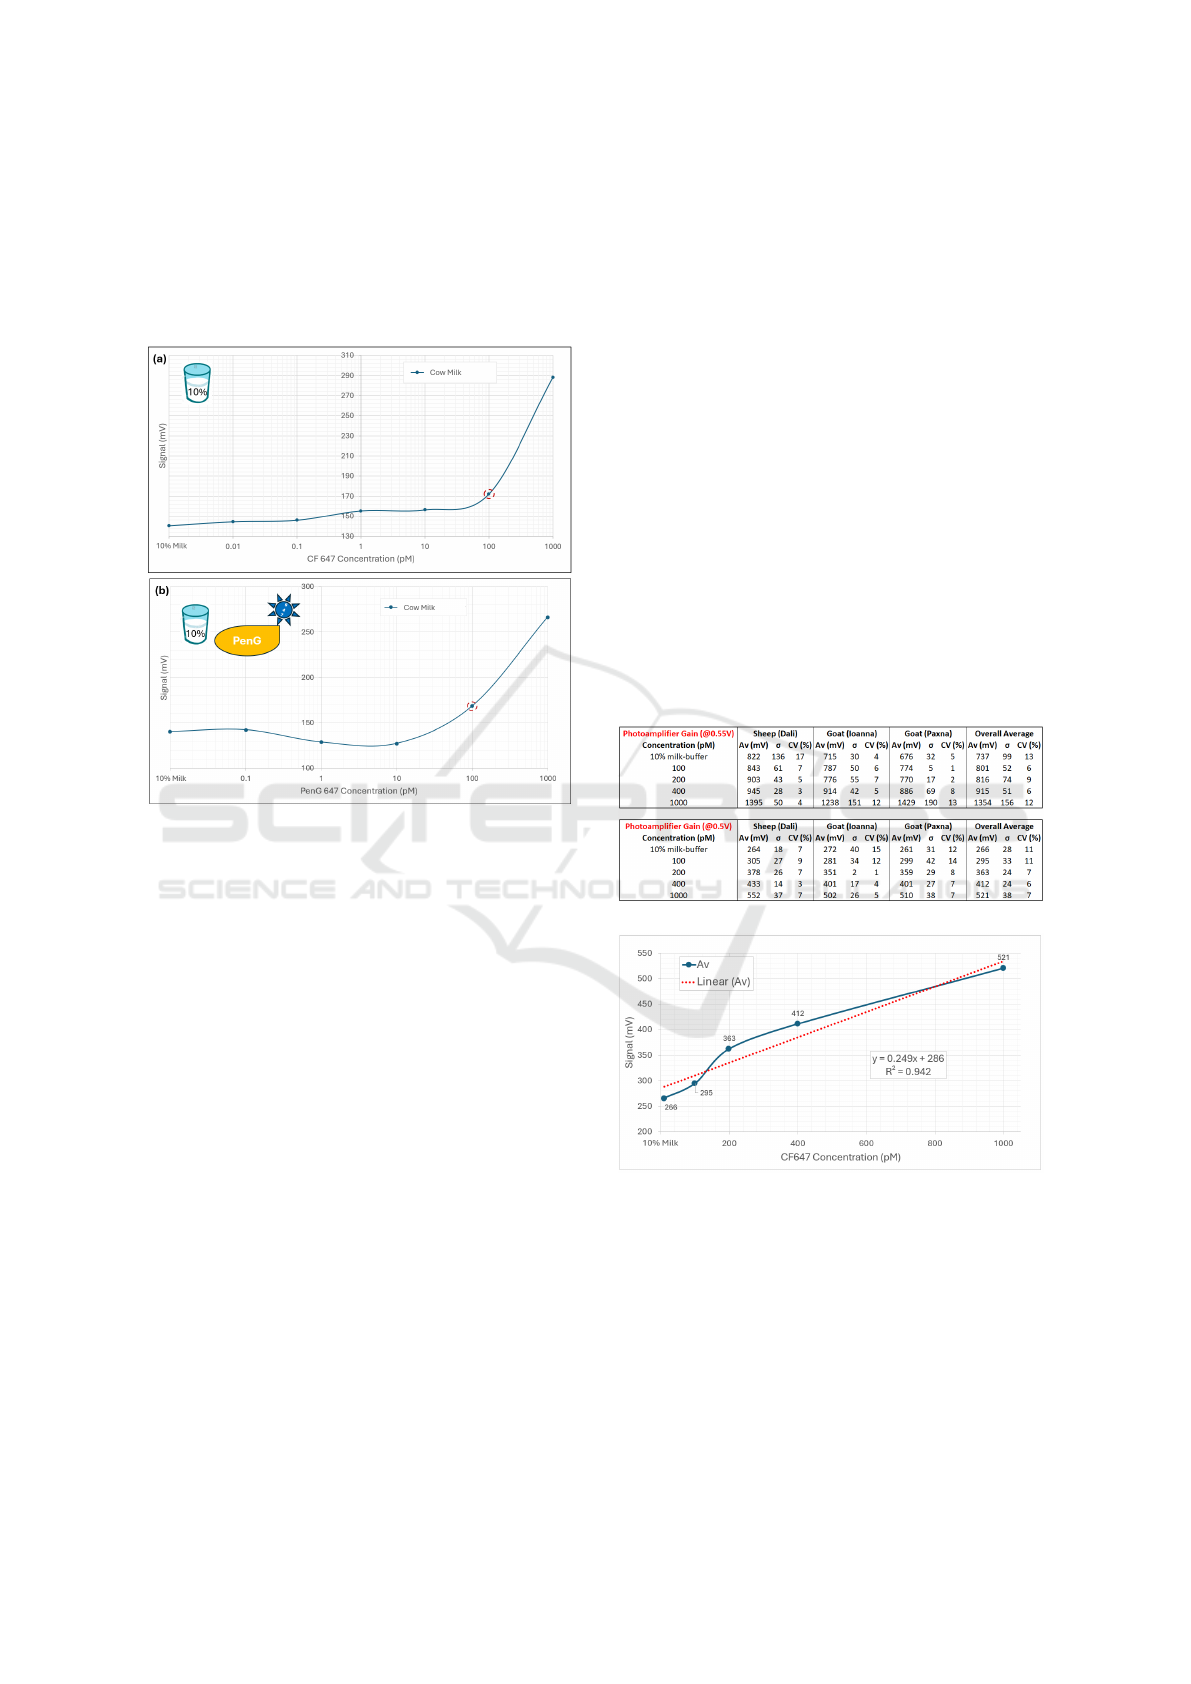
was also used to spike the samples (Figure 10b). This
was done to better simulate the real analysis assay
where the analyte is PenG. Similar results with the
other types of milk were obtained even with PenG647,
with the 100 pM concentration being distinguishable
from background in all cases.
Figure 10: Tests with black cuvettes and raw cow milk with
a) 10% milk-buffer at different CF647 concentrations, and
b) spiked with PenG labelled with CF647.
4 PERFORMANCE EVALUATION
For the next step of the validation process, more ex-
periments defining the performance aspects of the
prototype such as, the repeatability, reproducibility,
accuracy, sensitivity, and specificity were conducted.
Moreover, during these experiments the device was
tested under different amplification settings on the
photodetector, in order to change the dynamic range
during measurements to the range of the interest, and
thus detect dye concentrations up to 1000 pM.
For validating the repeatability and reproducibil-
ity, and hence the precision of measurement, tests
were repeated multiple times on spiked milk samples
(100, 200, 400, 1000 pM dye concentrations) col-
lected from different batches and farms. It is noted
that for each measurement performed the sample was
removed from the device and placed again to check
how user manual sample positioning affects the re-
sults. Furthermore, two different amplification set-
tings on the photodetector were tested: 0.5V and
0.55V as the control voltage for the dedicated gains.
The results of these measurements are concluded
in Table 1, that includes the calculated average value,
Av, standard deviation,σ, and coefficient of variation,
CV for three different batches of milk at different
dye-CF647 concentrations, as well as the overall av-
erage including all three types of milk. A relatively
low ‘Coefficient of Variation’ has been acquired for
all measurements, being below 20% which in general
is considered as a ‘Very good’ and acceptable value.
Furthermore, 2-3 times lower σ was observed (Ta-
ble 1) when the photo-amplification was set at 0.5V
opposed to the results with the higher amplification
at 0.55V, which it was expected due to the increase
of the photodetector noise with the increase of its
amplification. Moreover, both amplification settings
showed good linear behaviour (Figure 11), with R
2
values to be higher than 0.9 which shows strong rela-
tion to a linear expression.
Table 1: Tests results for validating the repeatability and
the reproducibility of the measurement. The names in the
parenthesis next to the animal type is the location of the
farm the milk was collected from.
Figure 11: 10% raw cow milk-buffer spiked with CF647
at different concentrations, using detector amplification at
0.5V control voltage. Cuvette was repositioned before each
measurement. The dashed line represents the linear fitting.
Subsequently, similar experiments with fresh-
prepared samples were conducted, using photo-
amplification at 0.5V control voltage. Again, each
measurement was repeated several times for each con-
centration, but this time the sample was placed in
the holder and the following measurements were ex-
ecuted one after the other without repositioning the
PHOTOPTICS 2025 - 13th International Conference on Photonics, Optics and Laser Technology
70
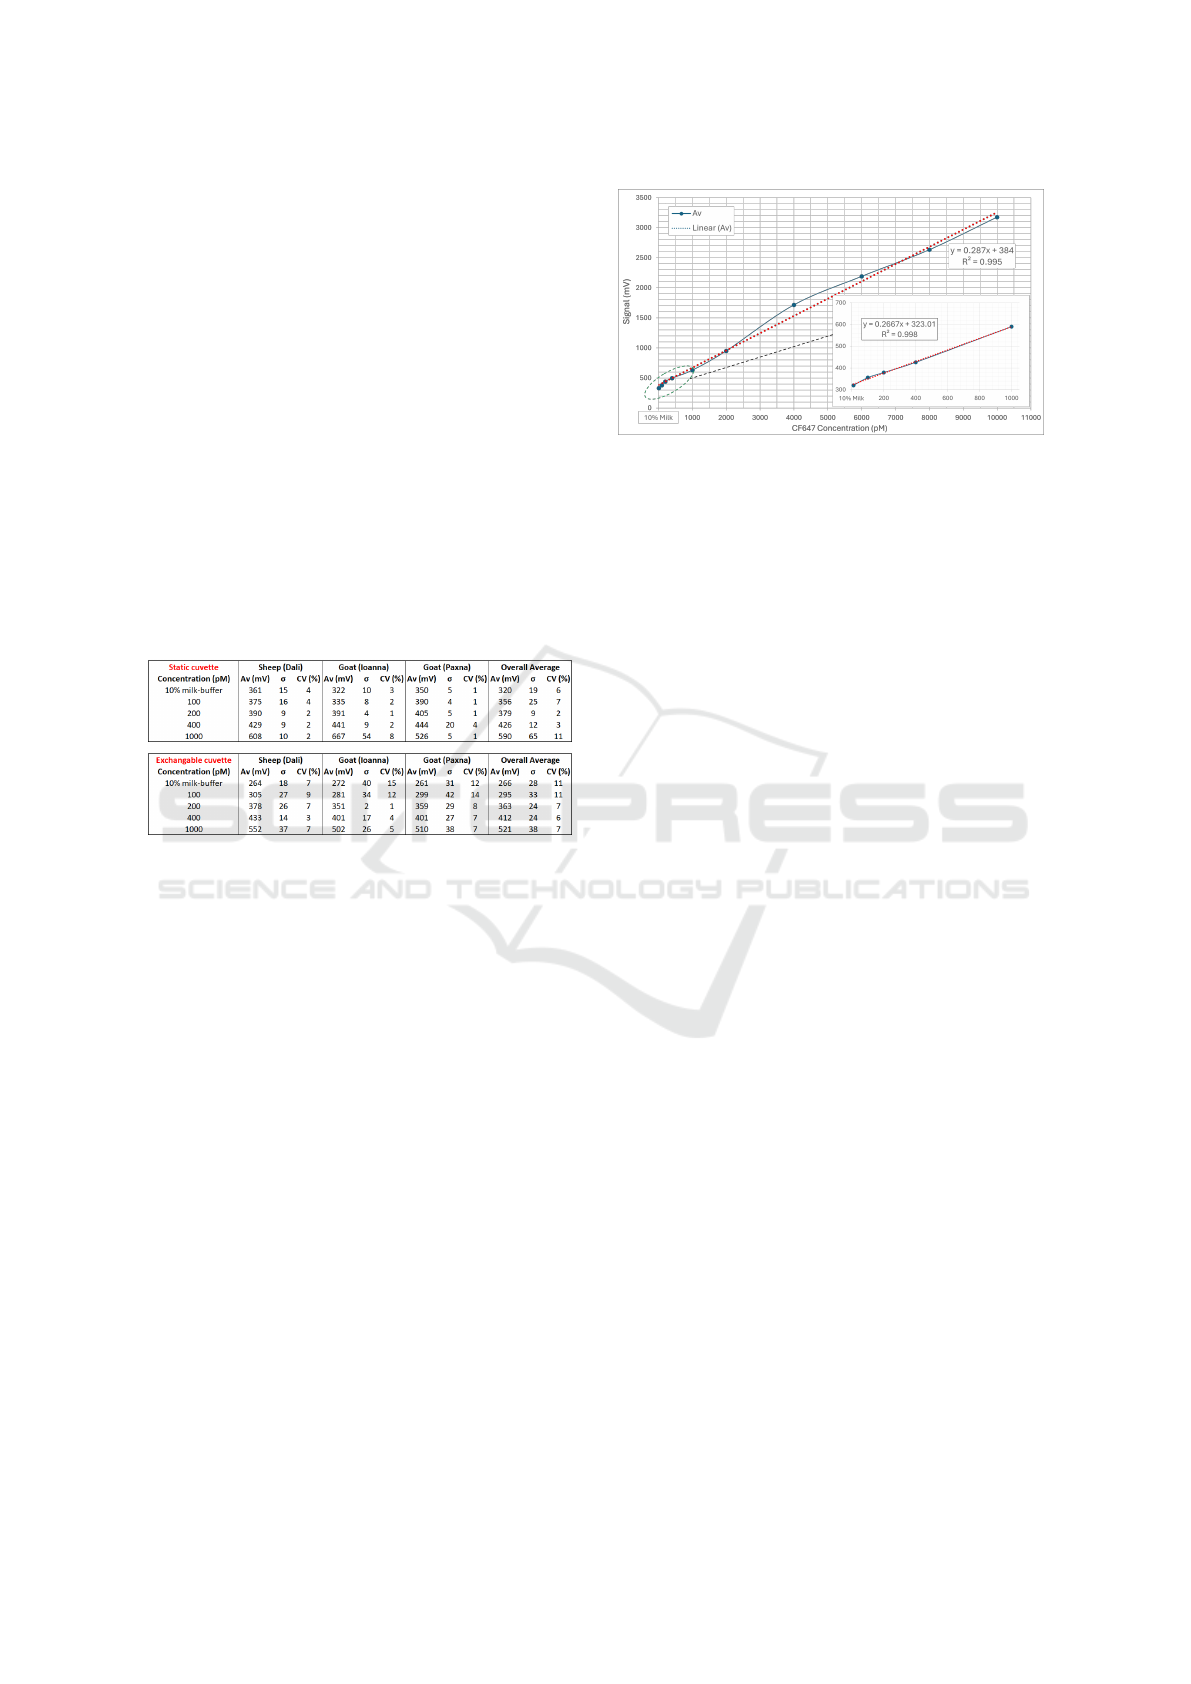
sample. This way, the experiment generated results
on the reproducibility but also on the robustness of
the measurement, correlated to the sample positioning
executed by the user. Table 2 includes the previous
(exchanging the cuvette) and the current (static cu-
vette) results for comparison. A general observation
is that the standard deviation, σ, and consequently
CV are only slightly lower in the case where the cu-
vette was static. Therefore, it can be considered that
these results verify high measurement reproducibility
and robustness related to sample positioning. In other
words, the mechanical interface between the sample-
holder and the optical apparatus, ensures reproducible
results when it comes to the sample positioning prac-
tice applied by the user. Furthermore, the highly re-
peatable results (low σ and CV <10%) in the case of
the static-cuvette, show high measurement stability.
Table 2: Tests results for validating the reproducibility and
robustness of the sample-positioning.
Similarly, linear fitting was applied to the results
as shown in Figure 12 , to verify consistency with the
previous results obtaining a higher R
2
value equal to
0.998. Moreover, the flexibility of using the dynamic
range for measuring higher concentration allowed for
a quick test up to 10000 pM (10 nM), in order to
check linearity at higher dye concentrations. The re-
sults are shown in Figure 12, where again the data are
described by a linear relation with an R
2
value close
to unity.
Finally, the device performance in terms of ac-
curacy, sensitivity and specificity was defined. Data
from 120 tests (24 samples for each concentration –
0 pM, 100 pM, 200 pM, 400 pM, 1000 pM) in to-
tal were used to define true positives, TP, false nega-
tives, FN, true negatives, TN, and false positives, FP.
The same data was also used to calculate the above
performance indicators based on the defined LOD (or
cut-off value). Emphasis should be given in the def-
inition of the LOD, considering that raw milk sam-
ples undergone 10% dilution, resulting to an analyte
concentration of 10-times lower than in the initial raw
sample. This means that the 100 pM, 200 pM and 400
pM referred LODs, correspond to 1 nM (∼1 ppb), 2
nM(∼2 ppb) and 4 nM(∼4 ppb) concentrations in raw
Figure 12: 10% raw cow milk-buffer spiked with CF647
at different concentrations. Cuvette position remained un-
changed throughout data set. Inset: zoom in for dye con-
centrations below 1 nM. The red dashed line represents the
linear fitting.
milk respectively. Satisfactory performance results
(>80%) are presented in Table 3 for three different
defined LODs. All three LODs present very good de-
tection accuracy higher than 85%, while in each case
sensitivity (related to FN) competes specificity (re-
lated to FP) and vice versa. Specifically, when requir-
ing high sensitivity thus sacrificing specificity, LOD
at 100 pM is preferable, while when requiring the op-
posite, LOD at 400 pM seems ideal with 100% speci-
ficity. In the case where a compromise is required,
then an LOD at 200 pM gives sufficient performance
values, between 83-90%. It is noted that the LOD
values obtained by these validation experiments are
comparable to other current works in the area of milk
contaminant detection (Matabaro et al., 2017; Jalili
et al., 2020).
Finally, in order to identify the integrity of the se-
lected dye molecules for labelling the antibodies over
time, a series of experiments was conducted to mea-
sure the emitted PL signal after storage. This work
was performed as part of the optical configuration de-
velopment to get an indication on the repeatability of
the device in measuring identical samples at differ-
ent points of time. Furthermore, the data collected
here serve as a suggestion for the expiry period of the
biosensors in terms of a consumable product in case
of market exploitation. The degradation experiments
consisted of different dye concentration samples pre-
pared and assessed in different time intervals within a
month to validate their integrity over time. The sam-
ples were prepared and stored at T = 5 °C until the
following measurement. Initially the measurements
were performed after a few days apart and then per-
formed weekly (Figure 13). Furthermore, new sam-
ples were prepared after 15 and 20 days from the
initial preparation and the emitted signal was com-
pared between old and new samples (not shown here).
These experiments revealed a satisfactory consistency
MILI: Biophotonics Technology for In-Situ, Fast, Accurate and Cost-Effective Milk Analysis
71
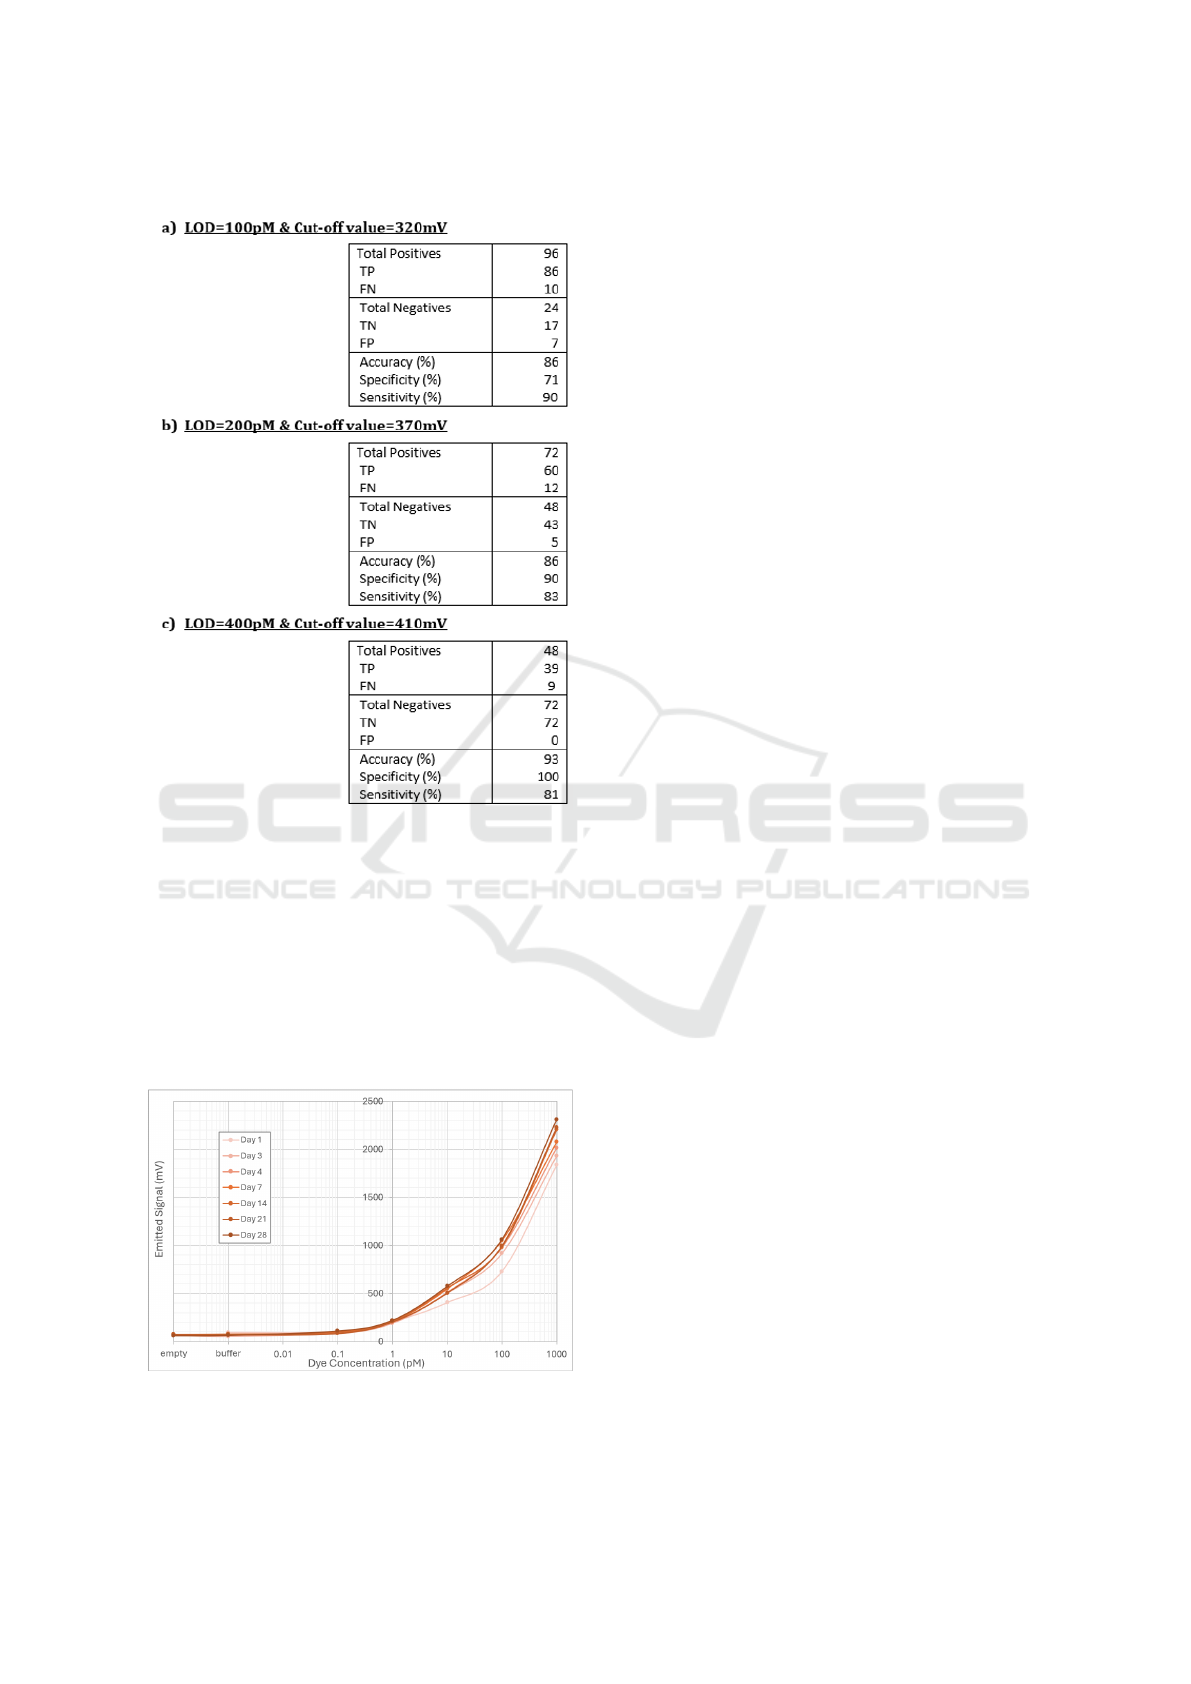
Table 3: Performance indicators based on defined LOD.
of fluorescence signal collected from the samples at
different times. The small increase in signal that was
observed between measurements comes from the fact
that the buffer solution precipitated on the parafilm
used to seal the samples during storage, thus slightly
increasing the overall dye concentration. These re-
sults lead to the conclusions that (a) the device is ca-
pable of repeated measurements with high accuracy
and (b) the choice of the labelling reagents is suitable
for at least up to a month before mixing with real ma-
trix samples.
Figure 13: Degradation experiments for different concen-
trations of CF567 at different time intervals.
5 CONCLUSIONS
In conclusion, the MILI device different modules
have been described in detail and validation experi-
ments and their outcomes have been discussed. The
optical module performed in a satisfactory fashion
providing evidence for detection capabilities which
allow for the recognition of contaminants (when
bound to labelled antibodies) in concentrations that
fall within the limits imposed by EU regulations. Fur-
thermore, based on a comprehensive preliminary test-
ing and performance evaluation of the MILI proto-
type, the results demonstrate that the device can re-
liably detect low concentrations of chromophores in
various milk samples, with repeatability and robust-
ness confirmed under different conditions. Overall,
the device showed promising accuracy, and a LOD
within the regulatory requirements for Penicillin-G
detection in milk. These findings confirm that the
MILI prototype is a potential tool for effective milk
safety monitoring, meeting the targeted detection lim-
its while maintaining high measurement consistency.
The proposed technology aims to achieve a quality
level of analysis equivalent to that provided by labora-
tories, without the need for trained personnel, provid-
ing results within 10 minutes and with costs that are
significantly lower than those of the current market-
available solutions. Overall, the MILI system seeks
to reduce costs and improve contamination detection,
offering a practical solution for early intervention and
minimizing health risks and financial losses in the
dairy supply chain.
ACKNOWLEDGEMENTS
The work was supported by the Cyprus
Research and Innovation Foundation grant
EXCELLENCE/0421/0188 which is co-financed
by the European Regional Development Fund
and the Republic of Cyprus and by the European
Union’s Horizon 2020 research and innovation
programme ”Code:Refarm” under grant agreement
No 101000216.
REFERENCES
Buzzin, A., Asquini, R., Caputo, D., and de Cesare, G.
(2022). Evanescent waveguide lab-on-chip for opti-
cal biosensing in food quality control. Photon. Res.,
10(6):1453–1461.
Fukuda, K. (2015). Food safety in a globalized world. Bull
World Health Organ, 93(4):212.
PHOTOPTICS 2025 - 13th International Conference on Photonics, Optics and Laser Technology
72

Gast
´
elum-Barrios, A., Soto-Zaraz
´
ua, G. M., Escamilla-
Garc
´
ıa, A., Toledano-Ayala, M., Mac
´
ıas-Bobadilla,
G., and Jauregui-Vazquez, D. (2020). Optical methods
based on ultraviolet, visible, and near-infrared spectra
to estimate fat and protein in raw milk: A review. Sen-
sors, 20(12).
Gaudin, V. (2017). Advances in biosensor development for
the screening of antibiotic residues in food products of
animal origin – a comprehensive review. Biosensors
and Bioelectronics, 90:363–377.
Getahun, M., Abebe, R. B., Sendekie, A. K., Woldeyoha-
nis, A. E., and Kasahun, A. E. (2023). Evaluation of
antibiotics residues in milk and meat using different
analytical methods. International Journal of Analyti-
cal Chemistry, 2023(1):4380261.
Jalili, R., Khataee, A., Rashidi, M.-R., and Razmjou, A.
(2020). Detection of penicillin g residues in milk
based on dual-emission carbon dots and molecularly
imprinted polymers. Food Chemistry, 314:126172.
Manolis, A., Eleftheriou, C., Elrabiaey, M. A., Tsekenis,
G., D’Auria, S., Varriale, A., Capo, A., Staiano, M.,
Chmielak, B., Schall-Giesecke, A. L., Suckow, S., and
Tsiokos, D. (2024). Ultra-fast detection of pathogens
and protein biomarkers using a low-cost silicon plas-
monic biosensing platform. Sensors and Actuators
Reports, 8:100221.
Matabaro, E., Ishimwe, N., Uwimbabazi, E., and Lee,
B. H. (2017). Current immunoassay methods for the
rapid detection of aflatoxin in milk and dairy prod-
ucts. Comprehensive Reviews in Food Science and
Food Safety, 16(5):808–820.
Olatoye, I. O., Daniel, O. F., and Ishola, S. A. (2016).
Screening of antibiotics and chemical analysis of
penicillin residue in fresh milk and traditional dairy
products in Oyo state, Nigeria. Vet World, 9(9):948–
954.
Pennacchio, A., Varriale, A., Scala, A., Marzullo, V. M.,
Staiano, M., and D’Auria, S. (2016). A novel fluo-
rescence polarization assay for determination of peni-
cillin g in milk. Food Chemistry, 190:381–385.
Regulation 37/2010 (2010). Commission Regulation (EU)
No 37/2010 of 22 December 2009 on pharmaco-
logically active substances and their classification
regarding maximum residue limits in foodstuffs of
animal origin.
https://eur-lex.europa.eu/legal-content/EN/TXT/
?uri=celex%3A32010R0037.
Reinholds, I., Bartkevics, V., Silvis, I. C., van Ruth, S. M.,
and Esslinger, S. (2015). Analytical techniques com-
bined with chemometrics for authentication and de-
termination of contaminants in condiments: A review.
Journal of Food Composition and Analysis, 44:56–72.
Singh, B., Bhat, A., Dutta, L., Pati, K. R., Korpan, Y., and
Dahiya, I. (2023). Electrochemical biosensors for the
detection of antibiotics in milk: Recent trends and fu-
ture perspectives. Biosensors, 13(9).
Souroullas, K., Manoli, A., Itskos, G., Apostolou, T., and
Papademas, P. (2024). Fluorescence of intrinsic milk
chromophores as a novel verification method of uv-c
treatment of milk. Foods, 13(18).
Surkova, A., Bogomolov, A., Paderina, A., Khistiaeva, V.,
Boichenko, E., Grachova, E., and Kirsanov, D. (2023).
Milk analysis using a new optical multisensor system
based on lanthanide(iii) complexes. Engineering Pro-
ceedings, 48(1).
Vercelli, C., Amadori, M., Gambino, G., and Re, G. (2023).
A review on the most frequently used methods to de-
tect antibiotic residues in bovine raw milk. Interna-
tional Dairy Journal, 144:105695.
World Health Organization (2015). WHO estimates of
the global burden of foodborne diseases: food-
borne diseases burden epidemiology reference group
2007–2015.
World Health Organization (2022). Food safety.
https://www.who.int/news-room/fact-sheets/detail/
food-safety.
Yeh, P., Yeh, N., Lee, C.-H., and Ding, T.-J. (2017). Appli-
cations of leds in optical sensors and chemical sens-
ing device for detection of biochemicals, heavy met-
als, and environmental nutrients. Renewable and Sus-
tainable Energy Reviews, 75:461–468.
MILI: Biophotonics Technology for In-Situ, Fast, Accurate and Cost-Effective Milk Analysis
73
