
Polygonizing Roof Segments from High-Resolution Aerial Images Using
Yolov8-Based Edge Detection
Qipeng Mei
1 a
, Dimitri Bulatov
2 b
and Dorota Iwaszczuk
1 c
1
Remote Sensing and Image Analysis, Department of Civil and Environmental Engineering Sciences,
Technical University of Darmstadt, Franziska-Braun-Str. 7, 64287 Darmstadt, Germany
2
Fraunhofer IOSB Ettlingen, Gutleuthausstrasse 1, 76275 Ettlingen, Germany
Keywords:
Vectorization, Face, Extraction, Urban, Building, Object, Detection, Structure.
Abstract:
This study presents a novel approach for roof detail extraction and vectorization using remote sensing images.
Unlike previous geometric-primitive-based methods that rely on the detection of corners, our method focuses
on edge detection as the primary mechanism for roof reconstruction, while utilizing geometric relationships to
define corners and faces. We adapt the YOLOv8 OBB model, originally designed for rotated object detection,
to extract roof edges effectively. Our method demonstrates robustness against noise and occlusion, leading
to precise vectorized representations of building roofs. Experiments conducted on the SGA and Melville
datasets highlight the method’s effectiveness. At the raster level, our model outperforms the state-of-the-
art foundation segmentation model (SAM), achieving a mIoU between 0.85 and 1 for most samples and an
ovIoU close to 0.97. At the vector level, evaluation using the Hausdorff distance, PolyS metric, and our
raster-vector-metric demonstrates significant improvements after polygonization, with a close approximation
to the reference data. The method successfully handles diverse roof structures and refines edge gaps, even on
complex roof structures of new, excluded from training datasets. Our findings underscore the potential of this
approach to address challenges in automatic roof structure vectorization, supporting various applications such
as urban terrain reconstruction.
1 MOTIVATION
From traditional Chinese pavilions to Mexican pyra-
mids and from skylines of US-megapoli to the resi-
dential areas of Australian urbanities, building roofs
are fascinating products of human creativity. Hu-
mans are motivated to be creative because a roof is
the culmination of what some people call “home”
and what for other people is the workplace and gives
them self-realization, or it belongs to a public place,
which must be presentable while looking at it from
afar. By contemplating a building roof, we can eas-
ily discern its constituting elements, detect important
corners and edges defining its structure, and infer the
relations between these components. This ability to
perceive structures from images is the fundamental
aspect of human vision. However, retrieving very
complex topological structures still presents a signif-
icant challenge (Lin et al., 2024) for computer vision
algorithms. This challenge negatively affects the abil-
ity to create automatically digital representations of
a
https://orcid.org/0009-0006-0506-4478
b
https://orcid.org/0000-0002-0560-2591
c
https://orcid.org/0000-0002-5969-8533
large building databases from aerial images, posing
an obstacle to those numerous applications requiring
detailed knowledge of building roof geometry. The
applications may require 3D information and the re-
quired output, consistently, would be the 3D geom-
etry of roofs. Examples are environmental science,
planning mobile communication networks, real es-
tate marketing, and virtual tourism, but also quick re-
sponse applications (Bulatov et al., 2014). Alterna-
tively, there could be purely 2D applications, which
only require images: Roof panels for solar modules
(House et al., 2018), damage grading after some nat-
ural disasters (Lucks et al., 2019), and, to a certain
degree, urban planning.
These applications are particularly interesting for
us because aerial images in high resolution are easily
available nowadays whereas manual digitalization of
building roof segments is costly. We therefore noticed
a huge progress in this field made by scholars in the
very few recent years. In what follows, a thorough
literature research is carried out to identify the most
promising tools but also certain shortcomings of re-
lated work that allowed us to propose a simple but ef-
ficient method to process buildings with complex roof
graphs.
Mei, Q., Bulatov, D. and Iwaszczuk, D.
Polygonizing Roof Segments from High-Resolution Aerial Images Using Yolov8-Based Edge Detection.
DOI: 10.5220/0013130400003912
Paper published under CC license (CC BY-NC-ND 4.0)
In Proceedings of the 20th International Joint Conference on Computer Vision, Imaging and Computer Graphics Theory and Applications (VISIGRAPP 2025) - Volume 3: VISAPP, pages
39-49
ISBN: 978-989-758-728-3; ISSN: 2184-4321
Proceedings Copyright © 2025 by SCITEPRESS – Science and Technology Publications, Lda.
39

1.1 Related Work
A concept of combining color region attributes and
grouping them to retrieve building roof details from
images has been performed by Henricsson (1998)
mode than a quarter-century ago. However, irrele-
vant objects or disturbances, solar panels, chimneys,
and shadows, with spectral characteristics other than
the main roof negatively affect the computation of
the region attributes. At least until nowadays, when
the advanced foundational models, like SAM (Kir-
illov et al., 2023) appeared, this was the reason why
the brilliant Henricsson’s research of that time has not
prevailed. Instead, in the absence of 3D data, schol-
ars mostly concentrated on building outlining, a task
successfully performed using conventional (Zhang,
1999; Turker and Koc-San, 2015) and deep-learning
based approaches (Wei et al., 2019; Zorzi et al., 2022).
Unlike the vector representation of building outlines,
which primarily deals with external contours, roof
vectorization requires consideration of more complex
topological structures, presenting a significant chal-
lenge. To address this issue, the prevailing approach
in current research moved, as already said, from
color-based approaches towards retrieving geomet-
ric primitives and reconstructing the roof through
their topological relationships. Traditional geomet-
ric primitive detection methods, such as Harris cor-
ner detection (Harris et al., 1988) and Canny edge de-
tection (Canny, 1986), are simple and robust, but the
complexity of surface scenes and the impact of noise
can result in the detection of geometric primitives as-
sociated with non-roof features as well as the omis-
sion or misidentification of roof-related primitives.
To grasp structures beyond local image gradi-
ent information, the researchers have turned to deep
learning approaches. Probably, Nauata and Furukawa
(2020) were the first who used Convolutional Neu-
ral Networks (CNNs) to detect geometric primitives
in aerial images. By combining these detections with
integer programming, they inferred the relationships
between the primitives and thus were able to assem-
ble them into a cohesive planar graph. In a similar
vein, Zhang et al. (2020) employed the Convolutional
Message Passing Network (Conv-MPN) architecture
to reconstruct roof structures. Basically, there are two
networks, one for junction detection and one for es-
tablishing adjacency relationships. The method of
Hensel et al. (2021) relies on the PPGNet Deep Neu-
ral network (Zhang et al., 2019), which is end-to-end
trainable, and comprises modules for junction detec-
tion, line segment assignment, and adjacency matrix
inference. The authors assess the weight for different
losses and evaluate their results edge-wise. After the
so-called DSM refinement step, supposed to detect,
essentially, buildings and suppress vegetation, Wang
et al. (2021) uses a similar style transfer technique to
detect rasterized roof corners and edges. These primi-
tives are further refined, slightly regularized, and em-
ployed to detect roof faces using a graph search al-
gorithm. For each building, an undirected graph is
built from the obtained edges. A graph cycle, which
is a roof polygon or a union of such, can be detected
using a depth-first search. After all the cycles have
been detected, large cycles that cover small cycles
are removed to avoid face overlapping. This may
work well for simple buildings, however, a choice of a
minimum cycle basis is an exponential problem, and
there is a need do combine geometrical and graph-
theoretical considerations to solve this problem for
complex buildings in an efficient way.
Another remote-sensing-inspired algorithm de-
scribed in Alidoost et al. (2020) presupposes the ap-
plication of a Y-shaped CNN from a single aerial im-
age. The two outputs, which give the network its
name, are style-transferred DSMs on the one hand,
and the union of eave, ridge, and hip lines, on the
other hand. Individual roof areas are retrieved using a
post-processing step. This method is a further devel-
opment of the knowledge-based workflow (Alidoost
et al., 2019). Moreover, Partovi et al. (2019) proposed
a comprehensive workflow consisting of building de-
tection, decomposing of the roof into rectangles in
2D, ML-based assignment of every rectangle, as well
as reconstruction of the roof because, for every rect-
angle, the set of parameters has to be determined. All
possible models are instantiated by changing the pa-
rameters in the predefined ranges and validated by the
PolyS metric (Avbelj et al., 2014). Even though for
the assignment of roof types, the 3D information is
dispensable, which makes this work very interesting
for us, the dataset considered in this work shows typi-
cal neo-classic style buildings, extending in rectangu-
lar rows along the boulevards and designed in a uni-
form style. However, we are more interested in res-
idential buildings since they have very complex roof
models and are hardly decomposable into rectangles.
From the point of view of entire wire-frame gener-
ation, Zhao et al. (2022) enhanced the detection units’
ability to perceive line segment primitives by incor-
porating HT-IHT (Hough Transform-Iterative Hough
Transform), which enabled the extraction of line seg-
ment and intersection point proposals. Subsequently,
they used Graph Neural Networks (GNNs) to learn
the relationships between line segments and inter-
sections, thereby achieving the vectorization of roof
structures. Inspired by the approach of Huang et al.
(2018), Esmaeily and Rezaeian (2023) developed an
VISAPP 2025 - 20th International Conference on Computer Vision Theory and Applications
40

end-to-end representation for intersection points in
images. This representation not only captures the
spatial coordinates of the intersection points but also
encodes the direction of the line segments that form
these intersections. Assisted by line segment detec-
tion masks and plane masks, this approach enables
the vectorized representation of roof structures. Wire-
frame extraction methods are efficient regarding com-
putational resources, but sometimes unusual angles in
challenging building structures may affect their per-
formance negatively.
The work of Ren et al. (2021), despite mainly fo-
cusing on interactive roof annotation and roof graph
optimization, also proposed a two-step Transformer
and a GNN-based procedure. The transformer is
supposed to retrieve a roof outline while the GNN
is trained to predict the face adjacency. The ap-
proach even offers a tool to generate 3D models from
2D graphs using the so-called planarity metric, even
though, as default, all inner roof vertices must have
the same elevation. We exploit this contribution by
retrieving their first dataset to validate our methods.
Finally, there are two very new and very success-
ful methods worth mentioning. To detect geometric
primitives and their relations, Lin et al. (2024) present
a very special CNN denoted as Switch and emphasiz-
ing inter-channel rather than intra-channel (i.e. tex-
tural) patterns. The Transformer-based architecture
called Roof-Former has been proposed by Zhao et al.
(2024). It consists of three steps: Feature Pyramid
Networks providing relevant features encoding edges
and vertices, Image feature fusion with enhanced seg-
mentation refinement, in which relevant feature sets
seem to compete against each other, and Structural
Reasoning. Qualitative results look impressive in the
cases of misleadingly textured, blurred, etc. roofs.
The quantitative results are, however, given on the
heat-map-level only.
1.2 Lessons Taken and Own
Contributions
In the existing work, the first clear message is that
roof junction points are the most important geomet-
ric primitives in achieving vectorization. In other
words, the lack or error in intersection point detec-
tion can severely degrade the results of roof structure
vectorization. However, during the acquisition pro-
cess, intersection points are susceptible to occlusion
and noise, which is an objective reality that even the
most advanced detection units cannot avoid. There-
fore, our approach focuses on another important ge-
ometric primitive, namely edges. Edge detection is
more stable and plays a role in connecting various
elements in geometric structures. In our approach,
we use a rotational object detection model (YOLOv8
OBB) to infer the vector representation of edges.
The second important conclusion is that it is
still state of the art to use some conventional post-
processing because a deep learning method cannot
cover all possible roof structures and perceive all
the roof details the architects are able to fantasize.
The additional advantage of such a post-processing
step is that rich findings from 3D-based roof detail
analysis workflows, where the edges are intersection
lines of some RANSAC-retrieved planes, are avail-
able and can be adopted (Verma et al., 2006; Sohn
et al., 2012; Pohl and Bulatov, 2015; Meidow et al.,
2016; Jung et al., 2017) and many others. To the line
end-points, we apply the Density-Based Spatial Clus-
tering of Applications with Noise (DBSCAN) algo-
rithm (Sander et al., 1998) which helps to gradually
recover the intersection points and plane information,
thereby achieving the vectorization of roof structures.
Bulatov et al. (2017) utilized DBSCAN to simplify
the vector structure of the road network and to rec-
ognize junctions or dead ends. Inspired by them, in
our case, it is used to cluster the endpoints of edge
based on their spatial proximity to identify the poten-
tial junction points.
We apply our method to two challenging datasets
and present both raster- and vector-based evaluation
metrics. In particular, the PolyS metric (Avbelj et al.,
2014), widely used in remote sensing, has been ap-
plied for the first time, to our knowledge to 2D build-
ing roof polygons reconstructed using only images
and no 3D data. Summarizing,
• We applied the YOLOv8 OBB method for detec-
tion of roof edges in high-resolution nadir aerial
images;
• we developed a procedure for roof polygonization
and face retrieval that relies on topology and ge-
ometry, allowing processing complex buildings;
• we evaluated our results on two datasets, one
of which was not used for training but to track
the model’s ability to generalize. Hereby, we
used both raster- and vector-based metrics, in-
cluding the PolyS metric and our vector-raster-
quality metric.
• As a competing approach, we use (naive) SAM to
evaluate its capability to extract roof faces.
2 METHODOLOGY
YOLOv8, the latest generation of the You Only Look
Once (YOLO) model developed by Jocher et al.
Polygonizing Roof Segments from High-Resolution Aerial Images Using Yolov8-Based Edge Detection
41
(2023), extends its capabilities across a broad spec-
trum of computer vision tasks, including object de-
tection, instance segmentation, pose estimation, and
image classification. With the release of version 8.1.0
on January 10, 2024, a pivotal feature was intro-
duced: Oriented Bounding Box (OBB) models. Un-
like traditional object detection models, where bound-
ing boxes are aligned with the image axes, OBB mod-
els incorporate an additional angle parameter, allow-
ing for more precise localization of objects, particu-
larly those with irregular orientations. This advance-
ment holds significant potential for applications in re-
mote sensing, where accurately detecting elongated
objects is critical.
Given their elongated and homogeneous nature,
roof edges are ideal candidates for OBB detection.
Additionally, the vectorized output simplifies the con-
version of detected roof edges into structured vector
formats, facilitating the generation of complete vector
representations through subsequent polygonization.
Specifically, our model is built on the pre-trained
YOLOv8 OBB model provided by Ultralytics, us-
ing its default hyperparameters, with model weights
“yolov8l-obb.pt”. To adapt our training data to OBB,
we generated an approximate detected bounding box
for each edge. The trained model achieved a preci-
sion of 0.99 and recall of 0.96 in edge detection. The
mAP50 is 0.98 and mAP50-95 is 0.77.
2.1 Polygonization
2.1.1 Edge Complementation
From the YOLOv8 output, we obtain attributes about
the length and direction of edges and can infer their
endpoints coordinates. However, it is worth noting
that these edges often have gaps of varying sizes.
Therefore, we develop a polygonization procedure
based on geometric rules to complement the edges,
aiming to generate complete and closed polygons (see
Figure 1).
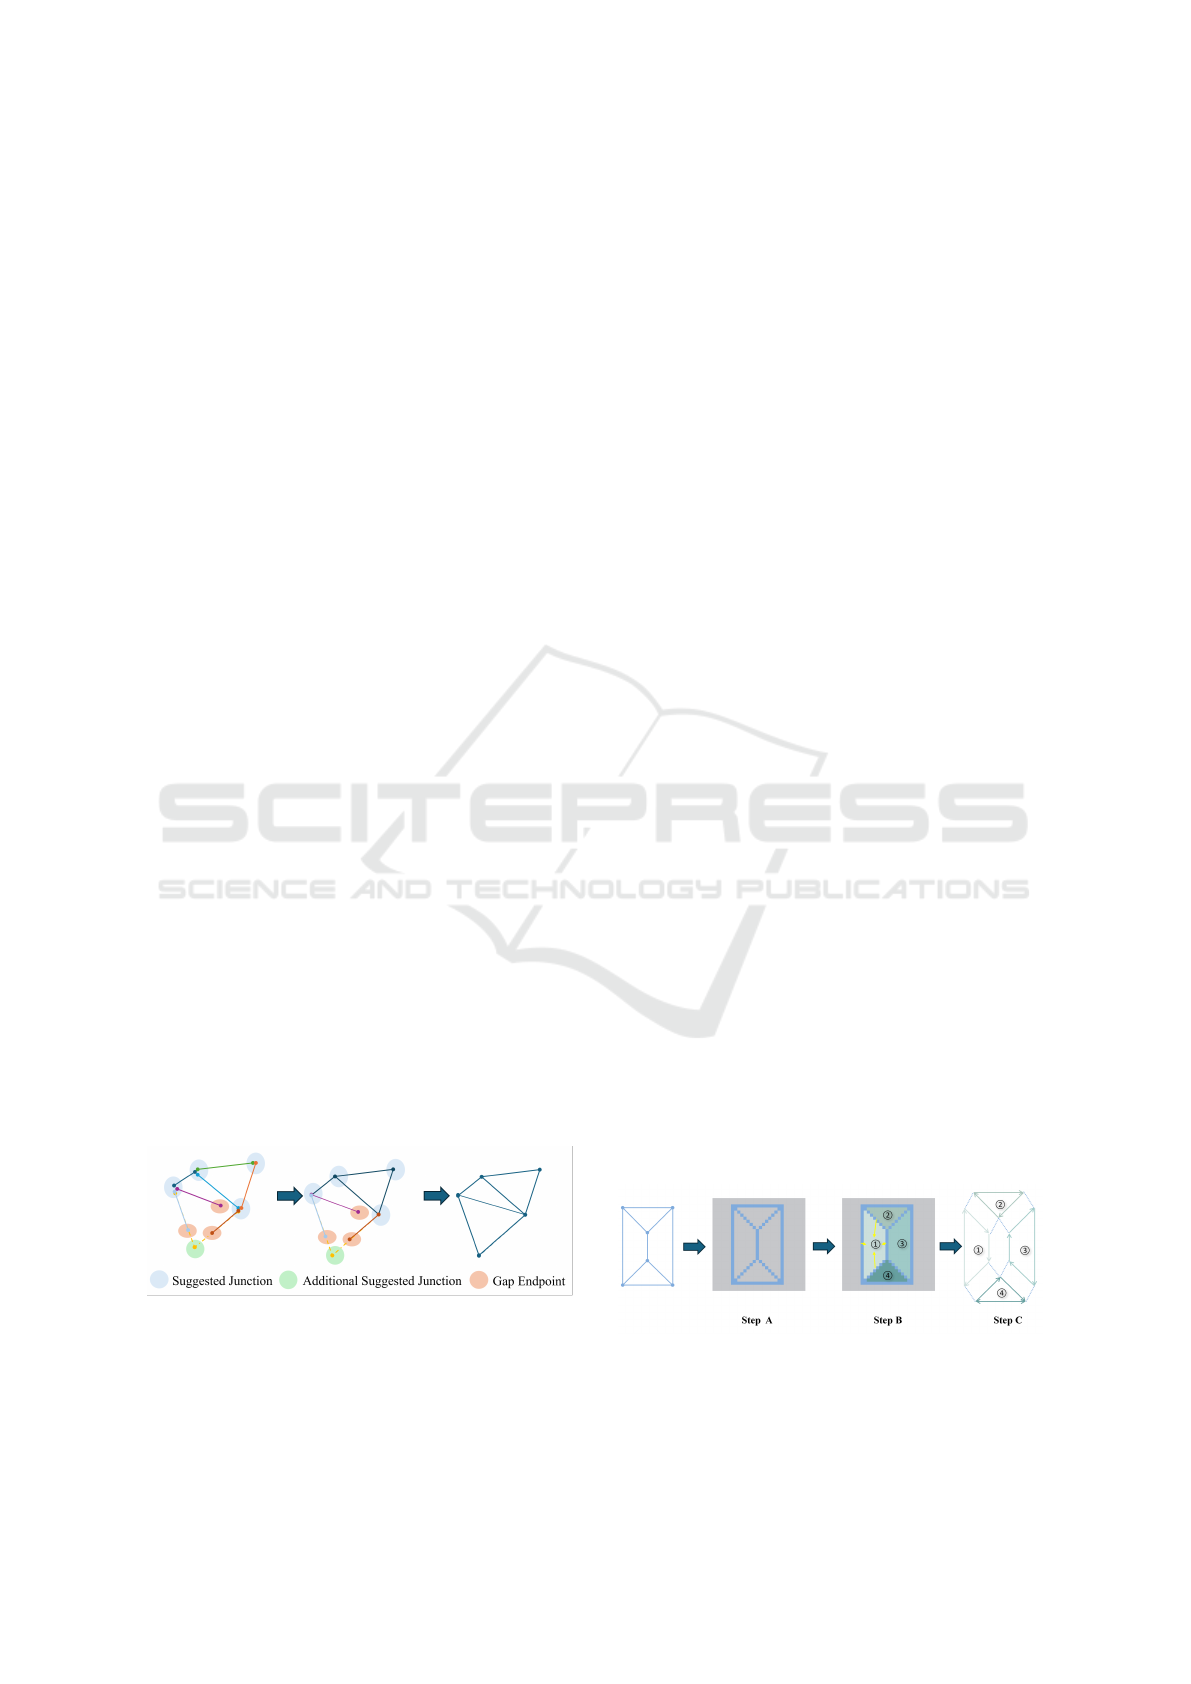
Figure 1: The process of edge complementary.
Firstly, we apply DBSCAN to the endpoints of
edge. It is a clustering algorithm for grouping densely
distributed points, which is common for downsam-
pling point clouds and suppressing noise (Sander
et al., 1998). More than a quarter-of-century old, this
method is still widely applied because of its flexibility
regarding the number of clusters, robustness against
noise, and high processing velocity. In our situa-
tion, where the number of clusters is uncertain and
the intersections are generated through mutual con-
straints between different edges, this method is par-
ticularly suitable. We differentiate between two types
of clusters: Junction clusters contain two or more
endpoints, and we consider these points to form a
junction of two or more edges. Contrarily, Gap clus-
ters contain only one endpoint, this means that the
YOLOv8 detection box cannot fully cover this edge,
hence, we need to extend it appropriately to find the
possibility of a closed polygon. Junction clusters resp.
gap clusters are supposed to represent two types of
problems while dealing with images: Noise and oc-
clusions.
For the junction cluster, we update it to be the cen-
ter of all points in the cluster and store this point as the
suggested junction. Considering that the junction may
be formed by two incompletely covered edges, we
compute the intersection of two incompletely covered
edges and store it as an additional suggested junction.
Completion of gap cluster is achieved based on all the
two types of junctions. More specially, for an end-
point x within a gap cluster, we search for the nearest
suggested junction on the line represented by the cor-
responding edge. Then this edge is modified by fusing
the endpoint x with the suggested junction.
2.1.2 Roof Face Vectorization
After refining the edges, determining which points
and line segment elements constitute each roof face
is the final step in roof vectorization. To match the
vertices with faces, we operate in the raster domain.
Specifically, we first convert the edges into raster
form, as shown in Step A of Figure 2. A standard
Bresenham algorithm , dating back to 1965, can be
applied here. It produces a binary image in which the
pixels occupied by edges are assigned the value 1 and
the unoccupied pixels are assigned the value 0.
Figure 2: The process of roof face vectorization. Step A:
rasterization of edges; Step B: Connected component form-
ing; Step C: Vertices collection.
VISAPP 2025 - 20th International Conference on Computer Vision Theory and Applications
42

Then, through connectivity checks (1-
connectivity, which considers the four-neighborhood
of a pixel), we partition the pixels in the raster
space (see Step B of Figure 2). For a building, the
partitioning result is N + 1 components, representing
the various roof faces (N) and the background (1).
Next, we label the edges from 1 to M. By col-
lecting the incident edges for each component and
knowing the incidence relations between edges and
endpoints, we can index the vertices of the face and
represent it in vector form (see Step C of Figure 2).
3 RESULTS
3.1 Datasets
We used a building-image paired dataset created by
Ren et al. (2021). The dataset, denoted here as SGA,
contains more than 3K samples of residential build-
ings from presumably different countries and the cor-
responding labels in raster and vector form. Each
sample is an aerial image patch with the ground sam-
ple distance of around 5cm containing one roof of a
single residential building and the label stores the 2D
vertex positions of the roof vertices and the vertex-
based topology of each face on the roof. We trans-
formed the label into a rotation detection box for the
edge of the roof to adapt it to our training of the
YOLOv8 OBB model. Then, the SGA dataset is di-
vided into train-, val-, and test-set in a ratio of 6:2:2.
In the testset, we experiment with polygonization and
evaluate the results.
The second data set has been recorded by the
Spookfish (now Aerometrex) corporation in a residen-
tial district Melville of Perth city, Western Australia.
The dataset has already been used in the context of
geo-typical representation of the building roofs for
heat simulation, see Ilehag et al. (2018). we repre-
sent it in the same structure of patches as in the first
dataset. The roofs exhibit very complex shapes and
are difficult to annotate, partly due to the moderate
resolution of slightly below 0.1m, that is, coarser than
the SGA dataset. This also resulted in problems dur-
ing annotation, because some roof segments are not
sufficiently distinguishable by the human eye. In or-
der to show the robustness of the proposed method,
we decided to train our model only using input of
the SGA dataset. For the Melville dataset, we merely
annotated 50 buildings to validate our model qualita-
tively.
3.2 Evaluation Strategy
3.2.1 Performance Metrics
For a single building, it is important to provide evalu-
ation on both raster and vector levels. The most com-
mon function for raster-based assessment is the aver-
age metric on intersection over union (mIoU). Firstly,
we calculate the IoU for each face of the roof. The set
of pixels belonging to the face i in the reference (R) is
represented as a
i
∈ R while that belonging to the face
j in the prediction (P) that has the largest overlap with
a
i
is b
j
∈ P. We obtain the IoU of a single face i and
mIoU of the whole building according to
IoU
i
=
a
i
∩ b
j
a
i
∪ b
j
and mIoU =
1
N
N
∑
i=1
IoU
i
, (1)
respectively, whereby N is the number of faces in a
roof. Note that this measure is not symmetric: we can
have many false roof segment hypothesis outside of P
without causing any harm to mIoU in (1). This is why
we additionally considered the overall IoU (ovIoU)
computed roof-level according to P and R, which are
the total set of pixels belonging to the roof in the ref-
erence and prediction, respectively:
ovIoU =
P ∩ R
P ∪ R
. (2)
Both measures have the advantage that the number of
segments in reference and prediction are not supposed
to coincide.
On the vector level, for every vertex x ∈ ∂P of the
prediction polygon ∂P (we omit ∂ in what follows),
one must compute the closest point y ∈ R and, in the
next step, vice versa. The corresponding distance
d
P→R
(x) = min
y
dist(x,y) (3)
must be aggregated – somehow – over all x ∈ P. The
symmetric Hausdorff distance presupposes taking the
maximum
d
H
= max
max
x∈P
d
P→R
(x),max
y∈R
d
R→P
(y)
(4)
while the PolyS metric of Avbelj et al. (2014) presup-
poses computation of the RMSE values
d
P
=
1
2
∑
x∈P
d
2
P→R
(x)
!
1
2
+
1
2
∑
y∈R
d
2
R→P
(y)
!
1
2
. (5)
Both metrics have often been applied to assess the
quality of reconstruction. Instead of averaging the
Polygonizing Roof Segments from High-Resolution Aerial Images Using Yolov8-Based Edge Detection
43
errors in d
P
, we take the maximum of both values.
Since we wish to have the value 1 to correspond to a
good reconstruction and 0 to a bad reconstruction, we
norm these metrics: q
.
= 1− d
.
/d
max
, thus making the
uniform with (1) and (2). Hereby, q stands for qual-
ity, · means either Hausdorff (H) or PolyS (P) met-
ric, and d
max
is a scaling parameter, a diagonal of the
bounding box of both polygons. Finally, the vector-
raster metric presupposes preserving vector and ma-
trix properties of reference data. It is given by
q
VM
= mIoU · q
H
(6)
and is scaled between 0 (bad on the raster or vector
level) and 1 (good on the vector and raster level), as
well.
The single error metrics are given building-wise.
Since our datasets consist of many buildings, we wish
to assess the reconstruction accuracy by the average
values of mIOU, OvIoU, q
P
, and q
VM
as well as the
median of q
H
, because Hausdorff metric already takes
gross errors and outliers into account. Additionally,
we will show the boxplots of all metrics.
3.2.2 SAM as Competing Approach
While our approach heavily relies on roof edges, we
wonder to what extent modern foundational models
are suitable to retrieve roof faces directly. To this end,
we use the prediction of the Segment Anything Model
(SAM) as the baseline of our polygonization at raster
level. SAM is a foundation model for image segmen-
tation released by Meta (Kirillov et al., 2023). It con-
sists of three main modules: 1) Image encoder: com-
posed of MAE pre-trained Vision Transformer (ViT),
which maps the image to be segmented into an im-
age feature space; 2) Prompt encoder: responsible for
mapping the input prompt to a prompt feature space;
3) Mask decoder: integrates the embedding output by
the Image encoder and Prompt encoder, then decodes
the final segmentation mask from this embedding’s
feature.
Trained on a massive dataset (SA-1B, compris-
ing 1B masks and 11M images), SAM has developed
powerful generalization capabilities, enabling trans-
fer to new image distributions and tasks through zero-
shot learning. Users can interact with SAM using
prompts (e.g., points, boxes, masks) to obtain relevant
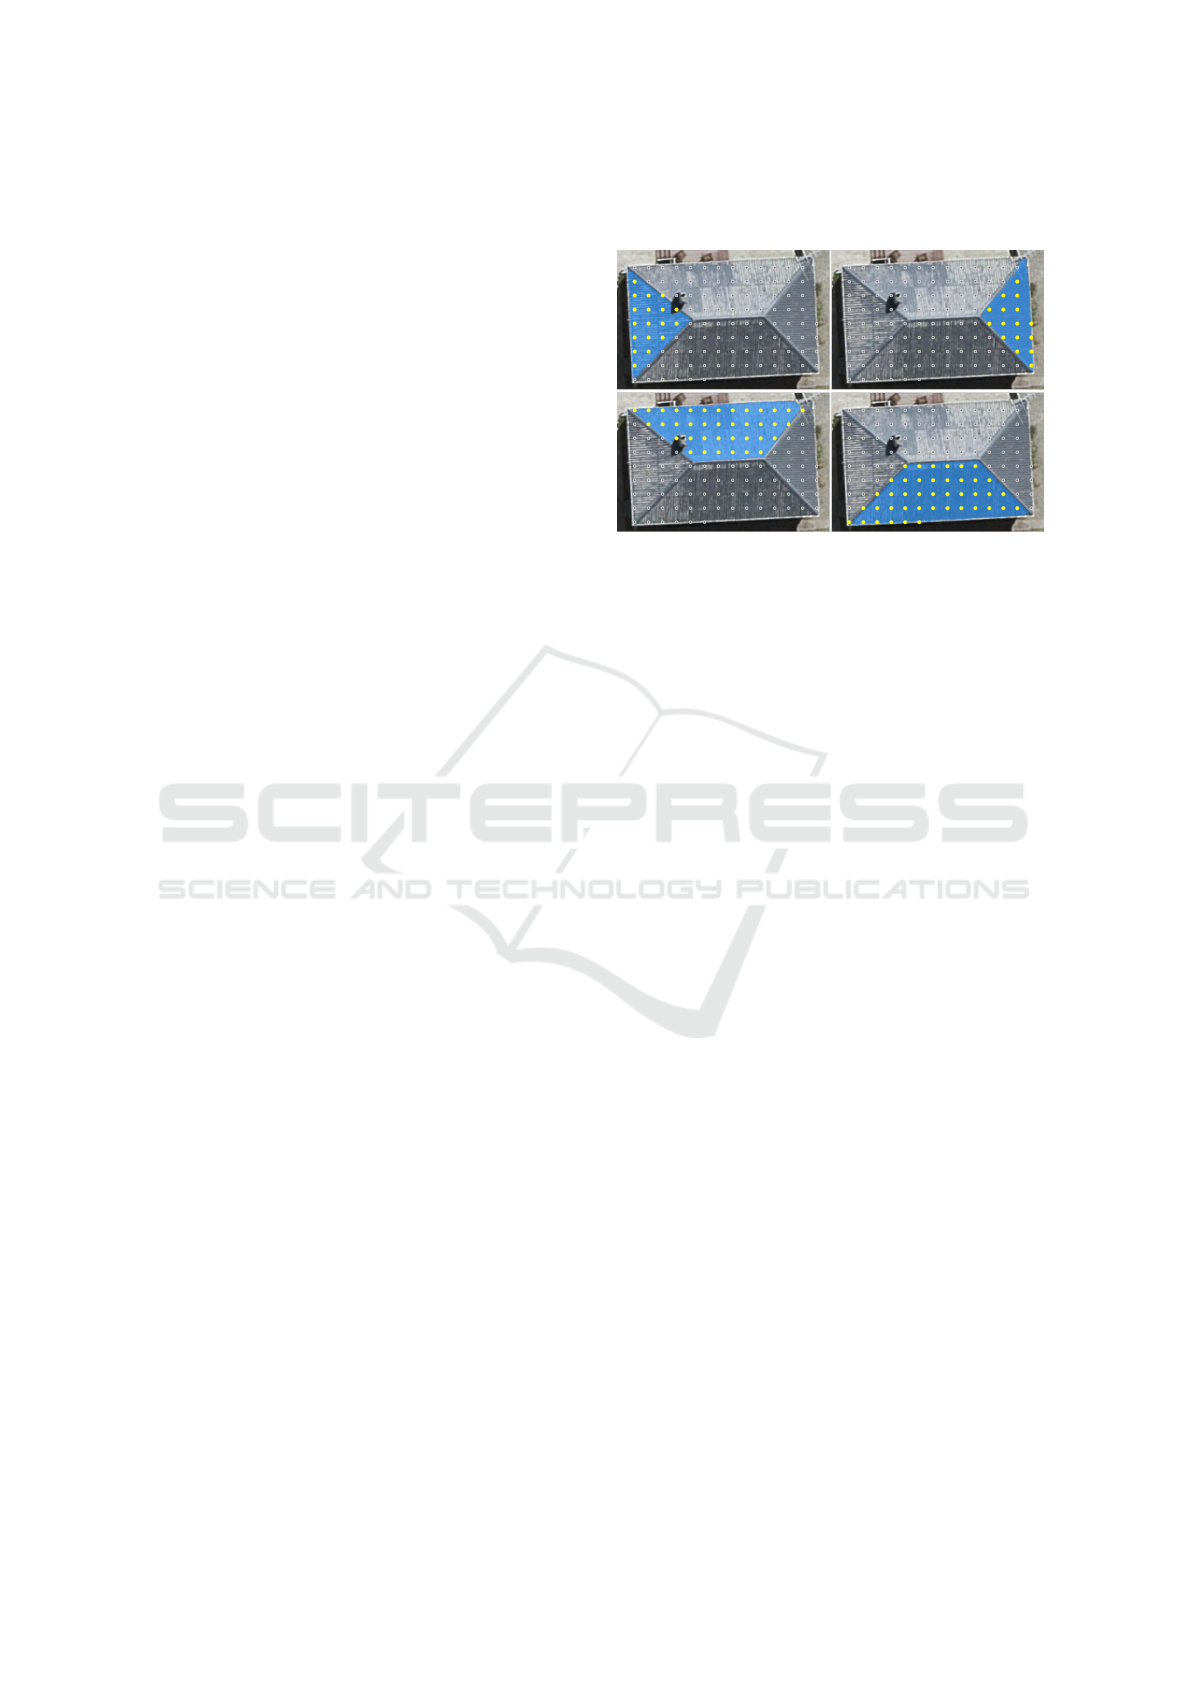
segmentation masks. In our research, we designed
a prompt generation strategy to use SAM to obtain
masks for each face of building roofs, which we then
compared with our method’s results. The prompts
of the SAM can be a set of foreground/background
points. Therefore, we designed a prompt generation
strategy. First, we sample each face f of the roof
based on the ground truth, which plotted from the
roof face vector data in the dataset, to obtain a set of
prompt points.
Figure 3: Example of prompt generation strategy. (Fore-
ground/background prompts are denoted by yellow and
gray points, respectively, while the blue mask denotes the
prediction of SAM.).
Then, we divide the prompt set into two sub-
sets: The subset belonging to f is used as fore-
ground prompt points and the remaining as back-
ground prompt points, as shown in Figure 3. Using
these prompt points, SAM is able to segment each in-
dividual face and delineate the boundary. As a result,
we obtain the prediction results of the foundational
model under strongly directional prompts.
3.3 Findings
3.3.1 Quantitative Evaluation
Figure 4a is the quantitative evaluation on the raster
level. We compare our method and the prediction of
SAM, with outliers removed for a clearer view of the
majority. First of all, it is evident that our method
outperforms SAM in terms of mIoU.
The distribution of our method is heavily skewed
towards higher mIoU, for most roofs falls within the
range of 0.85 to 1, with a mean value of 0.91, indicat-
ing excellent segmentation performance. In contrast,
SAM’s distribution is more spread out and falls within
the range of 0.6 to 1. And its mean value is 0.8.
In terms of ovIoU, the difference between SAM
and our method is relatively small. However, our
method maintains ovIoU within a narrower range of
0.95 to 0.99, while SAM achieves a range of 0.85 to
0.98. This indicates that our approach provides more
consistent coverage of buildings.
Figure 4b presents the quantitative evaluation at
the vector level, with outliers removed for a clearer
view of the majority. Across the three metrics, the
outputs of YOLOv8 closely approximate the ground
truth, with most samples having a q
H
between 0.97
VISAPP 2025 - 20th International Conference on Computer Vision Theory and Applications
44

(a) Raster level. (b) Vector level.
Figure 4: Quantitative evaluation of the SGA dataset.
to 0.99, a q
P
between 0.98 to 0.99 and a q
VM
be-
tween 0.97 to 0.99. After polygonization, the sam-
ple distribution becomes more concentrated, indicat-
ing further optimization of YOLOv8. This improve-
ment is also reflected in the considerably higher me-
dian lines across all metrics compared to YOLOv8.
Consequently, our method demonstrates better con-
sistency.
The q
H
, which is particularly sensitive to outliers,
is of special interest to us. It reveals that YOLOv8’s
lower whiskers extend further, indicating the pres-
ence of some gross errors during evaluation. How-
ever, it’s important to note that these outliers are ef-
fectively suppressed by our polygonization process,
as can be seen from the increase in median value from
0.983 to 0.991, demonstrating the robustness of our
method. The PolyS metric q
P
reveals that YOLOv8
effectively identifies most roof edges, but struggles
with completeness, resulting in relatively low values
of q
p
. Our polygonization method, however, refines
these roof edges, significantly enhancing geometric
similarity to the reference object. Finally, The q
V M
metric, which combines raster-level and vector-level
evaluations, shows minimal divergence from q
P
and
q
H
of our method. This indicates excellent perfor-
mance in both geometric and raster accuracy for most
samples, yielding a reliable and robust vector repre-
sentation of the roof structure.
Overall, at the vector level, YOLOv8’s output is
satisfactory, and our polygonization further enhances
the results. While effectively representing the roofs
in the vector form, our method demonstrates strong
robustness and consistency.
3.3.2 Qualitative Evaluation
Figure 5 presents a qualitative analysis of eight rep-
resentative samples from the SGA dataset. For each
sample, we display its aerial image, the detection re-
sults from YOLOv8 OBB (with detected bounding
boxes shown in yellow), the polygonization results
(final representations of roof structures with vertices
and edges shown in white), the SAM prediction re-
sults, and the ground truth (individual faces repre-
sented as colored areas). The colors of the SAM out-
puts and the ground truth correspond directly to the
colors of each face in the IoU distribution. Addition-
ally, the mIoU and ovIoU values are provided.
Sample (a) demonstrates a simple case. The accu-
rate prediction of YOLOv8 enables our polygoniza-
tion to complete the roof vectorization in the first step.
In the SAM results, each face is also well predicted.
Through further observation of the IoU for each face,
the polygonization results are satisfactory. Sample (b)
is a complex roof case. Despite the complexity of the
roof structure, most of the edges are well recognized.
The lack of prediction of face edges18 leads to its low
IoU. However, for most faces, the results are satisfac-
tory, and the ovIoU is also at a high level.
Sample (c) to (h) have varying degrees of edge
gaps. The gap in Sample (c) is located on the longest
edge of the roof, at the lower left of the building. And
the gaps in Sample (d) are present on the upper and
lower outer contour edges. Our polygonization is able
to effectively handle these situations. The edge im-
plementation approach matches the gap endpoints to
appropriate potential junctions, thus achieving a com-
plete roof topology. As a result, each face obtains ex-
cellent IoU.
Sample (e) demonstrates the effectiveness of ad-
ditional junctions in our edge completing approach.
The presence of additional junctions allows its con-
tour edges to be well completed. From Samples (c) to
(e), we can see that gaps mainly exist in longer edges
of building roofs, and are more common in outer con-
tour lines. Possible reasons include: compared to
shorter edges, long edges have fewer samples; hence,
YOLOv8 may not learn them sufficiently; addition-
ally, the prediction tends to cover areas with higher
confidence, which may sacrifice some areas that could
be edges. Nevertheless, our polygonization compen-
sates well for this weakness, using geometric prior
knowledge to connect these edges with appropriate
junctions.
Sample (f) demonstrates an advantage of our
method: on buildings covered by trees, edge as a geo-
metric primitive have a better spatial continuity, thus
overcoming the effects of visual occlusion. The lower
left corner edge in this example is occasionally ob-
scured by trees, which may present a challenge for
algorithms that use corners as geometric primitives.
The SAM results also show that prompt-based Seg-
mentation cannot cover this face well. However, from
the vector prediction of YOLOv8, this face is still well
reconstructed with the assistance of our polygoniza-
tion.
Polygonizing Roof Segments from High-Resolution Aerial Images Using Yolov8-Based Edge Detection
45
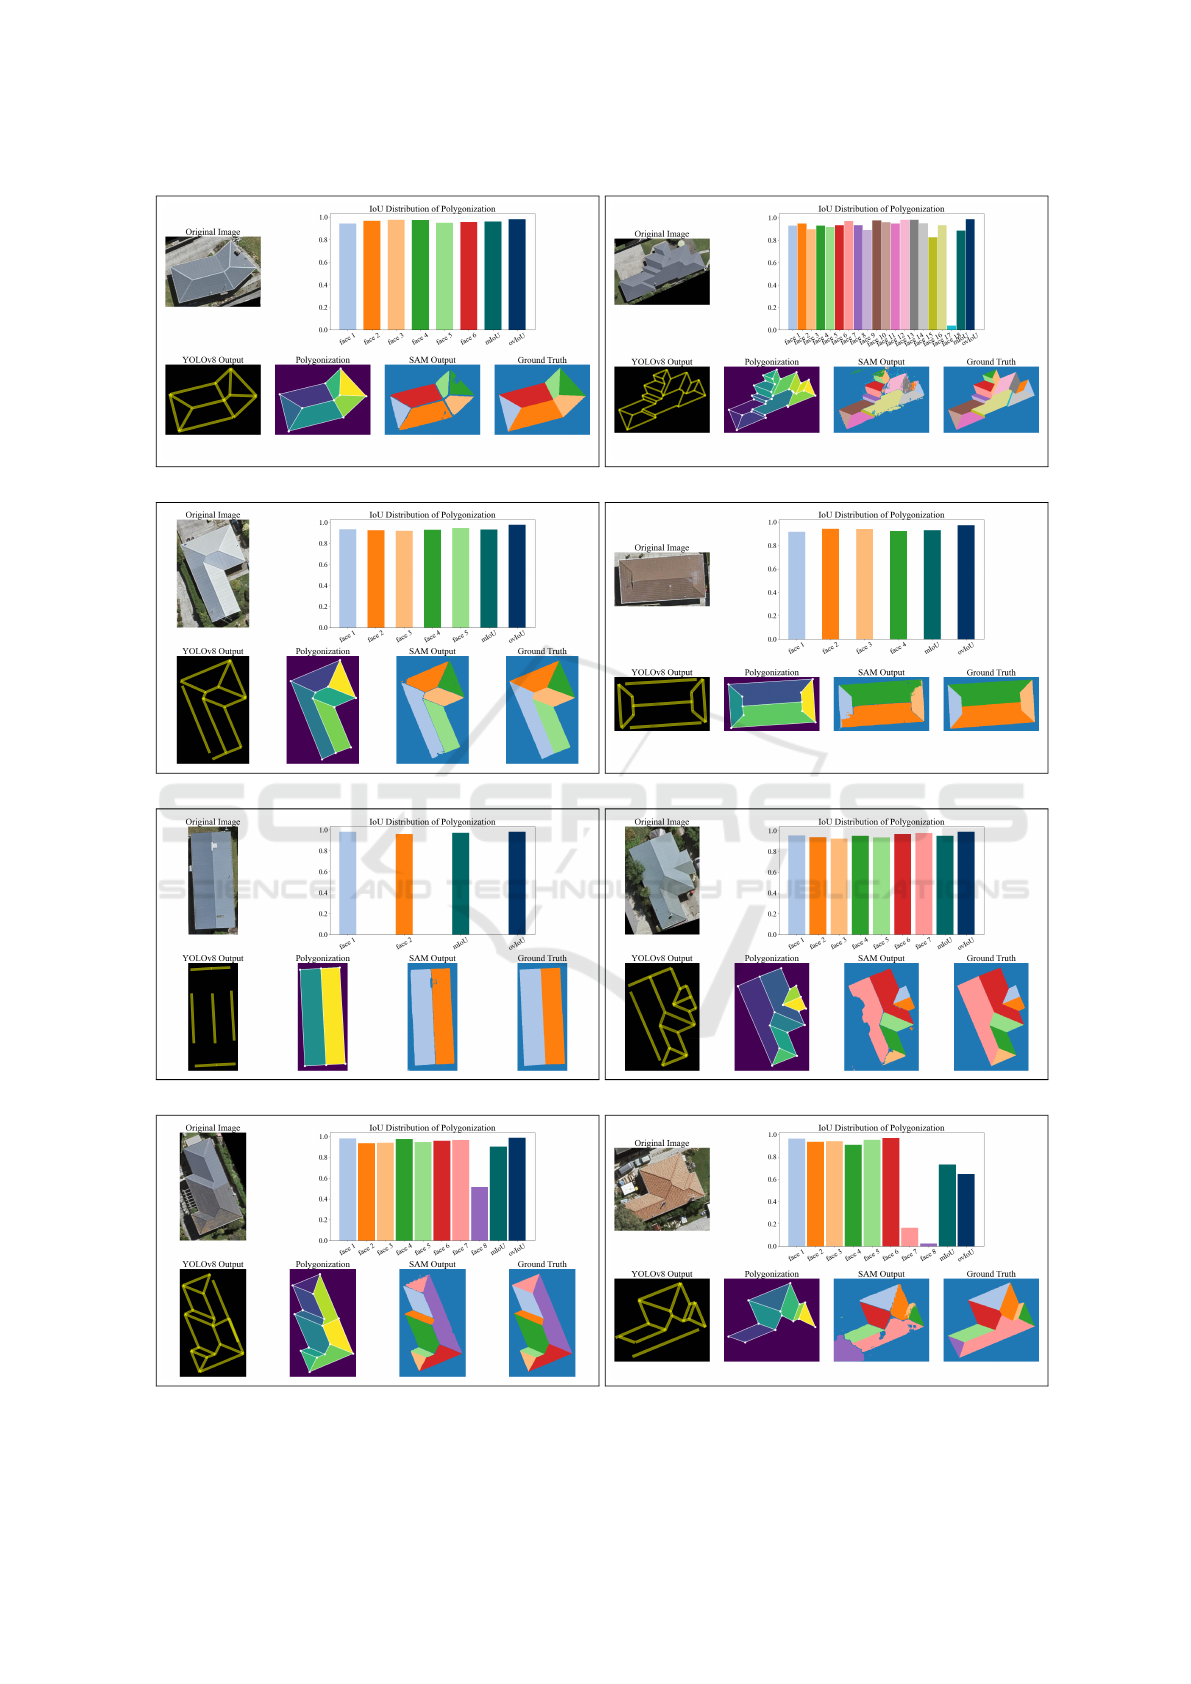
(a) Simple case. (b) Complex case.
(c) One edge gap. (d) Two edge gaps.
(e) Multi edge gaps. (f) Tree cover.
(g) Detect error. (h) Edge loss.
Figure 5: Qualitative evaluation samples (SGA).
VISAPP 2025 - 20th International Conference on Computer Vision Theory and Applications
46

Sample (g) illustrates a weakness of our method,
namely if the roof is composed of textures from two
different materials, this texture may create a false
edge. Then, our method might incorrectly divide this
face, causing prediction errors. Surprisingly, SAM
was able to achieve a better result. Finally, Sample
(h) represents a situation our method cannot handle.
Here, one face is completely occluded by trees, re-
sulting in up to three edges not being recognized, thus
causing the adjacent face to be missed. Certainly, this
also poses a challenge to SAM, which has prompts
situated on trees and results as mask of tree. For such
cases, we can only seek help from other data sources
to achieve roof reconstruction.
Overall, our method can effectively handle vari-
ous roof scenarios with clear geometric relationships,
and also demonstrates well robustness for partially
obscured edges.
Figure 6: Qualitative evaluation samples (Melville). From
left to right: Input patch mit YOLOv8 lines, Polygonization
output, SAM-output, ground truth delineation.
Turning our attention to the dataset Melville,
we present in Figure 6 a comparison between the
roof structure vector representations generated by our
method and the manual annotation. Lines represent
detected roof edges, while points indicate the corners
of these edges. The top row, for example, represents
a very complex building, all edges of which were de-
tected by YOLOv8, followed by one spurious fusion
caused by our polygonization method. SAM, how-
ever, could not detect some narrow segments. The
bottom row represents a building quite typical for the
SGA dataset. It is not very complex, but one solar
panel on the roof makes the SAM algorithm strug-
gle. Our method reconstructs this building completely
and correctly. Although the Melville dataset was not
involved in our model training, our method’s output
shows a generally consistent pattern with manual an-
notations. The main shortcomings lie in the accuracy
of some roof details — our method tends to ignore
or simplify narrower and irregular faces. Such sim-
plification may have severe repercussions in the case
of 3D reconstruction of roofs; nevertheless, these re-
sults demonstrate our method’s potential in handling
complex roof vectorization and significantly reducing
labor costs.
4 CONCLUSION
We have developed a novel method for roof detail
extraction and vectorization based on remote sensing
images. In particular, our approach leverages edges as
the primary elements for reconstruction, facilitating
the determination of roof corners and faces through
geometric relationships. The strength of this approach
lies in its robustness in edge detection, enabling the
reconstruction of accurate structures even when the
roof is partially occluded and minimizing the impact
of noise. This overcomes the limitations of corner-
based vector structure reconstruction.
Specifically, roof edge extraction is achieved us-
ing the YOLOv8 OBB model. We have innovatively
adapted this model, typically employed for rotated
object detection, to the task of roof edge detection. Its
vectorized output is particularly well-suited for edge
extraction, simplifying the process of generating vec-
tor representations of roofs.
We conducted experiments on two datasets: the
SGA dataset created by Ren et al. (2021), to the ex-
tent we could observe, without topological or geomet-
ric errors, and the Melville dataset that we annotated.
The former was also used to train our YOLOv8 OBB
model and evaluated our method at both raster and
vector levels. At the raster level, we used the SAM
as the baseline, which is widely regarded as the state-
of-the-art foundational model for segmentation. Our
Polygonizing Roof Segments from High-Resolution Aerial Images Using Yolov8-Based Edge Detection
47

model not only performed excellently at the raster
and vector level, but also produced quite stable re-
sults with narrow quantile ranges, including for the
quite outlier-sensitive Hausdorff metric. In compari-
son, SAM’s performance fluctuated more. The main
reason for this is that the edges are real, detectable ob-
servations while the roof segments SAM relies on can
suffer from occlusions by trees, color changes, roof
objects, and so on.
We also conducted qualitative evaluations on both
the SGA and Melville datasets, showcasing represen-
tative results. Overall, our method can effectively
handle different roof structures and eliminate edge
gaps in YOLOv8. Even on the Melville model, which
was not involved in training and has a relatively lower
resolution, the results were satisfactory. Although
the roofs in Melville present more complex struc-
tures, most roof segments could still be well recog-
nized. This demonstrates our great potential in han-
dling complex roof vectorization.
In conclusion, our findings highlight the potential
of our method to effectively handle diverse roof struc-
tures, even in challenging scenarios with complex ge-
ometries. Moving forward, we plan to explore addi-
tional datasets and integrate our technique into urban
terrain reconstruction workflows. On the one hand, it
will help to explore further radiometric (detecting im-
portant installations on roofs: photovoltaic panels, so-
lar collectors, etc.) and geometric (non-planar roof el-
ements, such as domes, towers) aspects. On the other
hand, we aim to conduct a more comprehensive com-
parative analysis with other competing methods, fur-
ther establishing the robustness and versatility of our
approach. Finally, in future work, we plan to incorpo-
rate 3D data to search for more precise intersections
near our predicted ones to improve the vectorization.
ACKNOWLEDGEMENTS
The authors thank the China Scholarship Council
(CSC) for supporting this research, Grant/Award
Number: 202308080109. We also thank the review-
ers for their insightful comments.
REFERENCES
Alidoost, F., Arefi, H., and Hahn, M. (2020). Y-shaped
convolutional neural network for 3D roof elements
extraction to reconstruct building models from a sin-
gle aerial image. ISPRS Annals of the Photogramme-
try, Remote Sensing and Spatial Information Sciences,
2:321–328.
Alidoost, F., Arefi, H., and Tombari, F. (2019). 2D image-
to-3D model: Knowledge-based 3D building recon-
struction (3DBR) using single aerial images and con-
volutional neural networks (CNNs). Remote Sensing,
11(19):2219.
Avbelj, J., M
¨
uller, R., and Bamler, R. (2014). A metric for
polygon comparison and building extraction evalua-
tion. IEEE Geoscience and Remote Sensing Letters,
12(1):170–174.
Bulatov, D., H
¨
aufel, G., Meidow, J., Pohl, M., Solbrig, P.,
and Wernerus, P. (2014). Context-based automatic
reconstruction and texturing of 3D urban terrain for
quick-response tasks. ISPRS Journal of Photogram-
metry and Remote Sensing, 93:157–170.
Bulatov, D., Wenzel, S., H
¨
aufel, G., and Meidow, J. (2017).
Chain-wise generalization of road networks using
model selection. ISPRS Annals of the Photogramme-
try, Remote Sensing and Spatial Information Sciences,
4:59–66.
Canny, J. (1986). A computational approach to edge de-
tection. IEEE Transactions on Pattern Analysis and
Machine Intelligence, (6):679–698.
Esmaeily, Z. and Rezaeian, M. (2023). Building roof wire-
frame extraction from aerial images using a three-
stream deep neural network. Journal of Electronic
Imaging, 32(1):013001–013001.
Harris, C., Stephens, M., et al. (1988). A combined corner
and edge detector. In Alvey Vision Conference, vol-
ume 15, pages 147–152. Citeseer.
Henricsson, O. (1998). The role of color attributes and sim-
ilarity grouping in 3-d building reconstruction. Com-
puter Vision and Image Understanding, 72(2):163–
184.
Hensel, S., Goebbels, S., and Kada, M. (2021). Building
roof vectorization with PPGNET. The International
Archives of the Photogrammetry, Remote Sensing and
Spatial Information Sciences, 46:85–90.
House, D., Lech, M., and Stolar, M. (2018). Using deep
learning to identify potential roof spaces for solar pan-
els. In nternational Conference on Signal Process-
ing and Communication Systems (ICSPCS), pages 1–
6. IEEE.
Huang, K., Wang, Y., Zhou, Z., Ding, T., Gao, S., and Ma,
Y. (2018). Learning to parse wireframes in images of
man-made environments. In Proceedings of the IEEE
Conference on Computer Vision and Pattern Recogni-
tion, pages 626–635.
Ilehag, R., Bulatov, D., Helmholz, P., and Belton, D.
(2018). Classification and representation of com-
monly used roofing material using multisensorial
aerial data. The International Archives of the Pho-
togrammetry, Remote Sensing and Spatial Informa-
tion Sciences, 42:217–224.
Jocher, G., Chaurasia, A., and Qiu, J. (2023). Ultralytics
yolov8.
Jung, J., Jwa, Y., and Sohn, G. (2017). Implicit regular-
ization for reconstructing 3D building rooftop models
using airborne lidar data. Sensors, 17(3):621.
Kirillov, A., Mintun, E., Ravi, N., Mao, H., Rolland, C.,
Gustafson, L., Xiao, T., Whitehead, S., Berg, A. C.,
VISAPP 2025 - 20th International Conference on Computer Vision Theory and Applications
48

Lo, W.-Y., et al. (2023). Segment anything. In Pro-
ceedings of the IEEE/CVF International Conference
on Computer Vision, pages 4015–4026.
Lin, M., Jing, W., Li, C., and Jung, A. (2024). Optimized
vectorizing of building structures with switch: High-
efficiency convolutional channel-switch hybridization
strategy. IEEE Geoscience and Remote Sensing Let-
ters.
Lucks, L., Bulatov, D., Th
¨
onnessen, U., and B
¨
oge, M.
(2019). Superpixel-wise assessment of building dam-
age from aerial images. In International Conference
on Computer Vision Theory and Applications (VIS-
APP), pages 211–220.
Meidow, J., Hammer, H., Pohl, M., and Bulatov, D. (2016).
Enhancement of generic building models by recogni-
tion and enforcement of geometric constraints. ISPRS
Annals of the Photogrammetry, Remote Sensing and
Spatial Information Sciences, 3:333–338.
Nauata, N. and Furukawa, Y. (2020). Vectorizing world
buildings: Planar graph reconstruction by primi-
tive detection and relationship inference. In Euro-
pean Conference, Glasgow, UK, August 23–28, 2020,
Proceedings, Part VIII 16 (ECCV), pages 711–726.
Springer.
Partovi, T., Fraundorfer, F., Bahmanyar, R., Huang, H., and
Reinartz, P. (2019). Automatic 3-d building model re-
construction from very high resolution stereo satellite
imagery. Remote Sensing, 11(14):1660.
Pohl, M. and Bulatov, D. (2015). Gap-closing 3D build-
ing reconstruction by aligning boundaries of roof seg-
ments and detecting uncovered details. ISPRS Annals
of the Photogrammetry, Remote Sensing and Spatial
Information Sciences, 2:173–180.
Ren, J., Zhang, B., Wu, B., Huang, J., Fan, L., Ovsjanikov,
M., and Wonka, P. (2021). Intuitive and efficient
roof modeling for reconstruction and synthesis. arXiv
preprint arXiv:2109.07683.
Sander, J., Ester, M., Kriegel, H.-P., and Xu, X. (1998).
Density-based clustering in spatial databases: The al-
gorithm gdbscan and its applications. Data Mining
and Knowledge Discovery, 2:169–194.
Sohn, G., Jwa, Y., Kim, H. B., and Jung, J. (2012). An
implicit regularization for 3D building rooftop model-
ing using airborne LIDAR data. ISPRS Annals of the
Photogrammetry, Remote Sensing and Spatial Infor-
mation Sciences, 2 (3):305–310.
Turker, M. and Koc-San, D. (2015). Building extraction
from high-resolution optical spaceborne images us-
ing the integration of support vector machine (SVM)
classification, Hough transformation and perceptual
grouping. International Journal of Applied Earth Ob-
servation and Geoinformation, 34:58–69.
Verma, V., Kumar, R., and Hsu, S. (2006). 3D building de-
tection and modeling from aerial lidar data. In 2006
IEEE Computer Society Conference on Computer Vi-
sion and Pattern Recognition (CVPR’06), volume 2,
pages 2213–2220. IEEE.
Wang, Y., Zorzi, S., and Bittner, K. (2021). Machine-
learned 3D building vectorization from satellite im-
agery. In Proceedings of the IEEE/CVF Conference
on Computer Vision and Pattern Recognition, pages
1072–1081.
Wei, S., Ji, S., and Lu, M. (2019). Toward automatic
building footprint delineation from aerial images us-
ing CNN and regularization. IEEE Transactions on
Geoscience and Remote Sensing, 58(3):2178–2189.
Zhang, F., Nauata, N., and Furukawa, Y. (2020). Conv-
mpn: Convolutional message passing neural network
for structured outdoor architecture reconstruction. In
Proceedings of the IEEE/CVF Conference on Com-
puter Vision and Pattern Recognition, pages 2798–
2807.
Zhang, Y. (1999). Optimisation of building detection in
satellite images by combining multispectral classifi-
cation and texture filtering. ISPRS Journal of Pho-
togrammetry and Remote Sensing, 54(1):50–60.
Zhang, Z., Li, Z., Bi, N., Zheng, J., Wang, J., Huang, K.,
Luo, W., Xu, Y., and Gao, S. (2019). Ppgnet: Learning
point-pair graph for line segment detection. In Pro-
ceedings of the IEEE/CVF Conference on Computer
Vision and Pattern Recognition, pages 7105–7114.
Zhao, W., Persello, C., Lv, X., Stein, A., and Vergauwen,
M. (2024). Vectorizing planar roof structure from
very high resolution remote sensing images using
transformers. International Journal of Digital Earth,
17(1):1–15.
Zhao, W., Persello, C., and Stein, A. (2022). Extracting
planar roof structures from very high resolution im-
ages using graph neural networks. ISPRS Journal of
Photogrammetry and Remote Sensing, 187:34–45.
Zorzi, S., Bazrafkan, S., Habenschuss, S., and Fraundorfer,
F. (2022). Polyworld: Polygonal building extraction
with graph neural networks in satellite images. In Pro-
ceedings of the IEEE/CVF Conference on Computer
Vision and Pattern Recognition, pages 1848–1857.
Polygonizing Roof Segments from High-Resolution Aerial Images Using Yolov8-Based Edge Detection
49
