
Unveiling Vocal Phenotypes of Dysphonia with Unsupervised Learning
Federico Cal
`
a
1 a
, Francesco Correnti
1 b
, Lorenzo Frassineti
1 c
, Giovanna Cantarella
2,3 d
,
Giulia Buccichini
3 e
, Ludovica Battilocchi
2 f
and Antonio Lanat
`
a
1 g
,
1
Department of Information Engineering, Universit
`
a degli Studi di Firenze, Firenze, Italy
2
IRCCS Ca’ Grande Foundation, Ospedale Maggiore Policlinico Milano, Milano, Italy
3
Department of Clinical Sciences and Community Health, University of Milan Milan Italy
francesco.correnti@edu.unifi.it, {giulia.buccichini, ludovica.battilocchi}@unimi.it,
giovan unifi.it
Keywords:
Dysphonia, Acoustic Analysis, Unsupervised Learning, k-means.
Abstract:
Dysphonia is a voice disorder caused by morphological and neurological alterations. This work proposes a
clustering analysis on vocal properties of patients diagnosed with benign lesions of the vocal folds (BLVF) and
unilateral vocal fold paralysis (UVFP) to identify if they constitute separate vocal subtypes of dysphonia and
to understand whether misclustered data depend on a specific diagnosis and age. Two hundred seventy-five
patients uttered a sustained vowel /a/, from which acoustic features were extracted and transformed. Two con-
ditions were tested separately for each gender: the unaware and the aware approach, where statistical analysis
was performed to select the significantly different parameters between BLVF and UVFP. The best clustering
results were obtained for the aware condition, with a silhouette score of 0.70 for both genders; accuracies were
0.67 and 0.70 for the female and male patients. A single component was retained for both genders: phonation
and articulation parameters presented high weights for female and male patients, respectively. Misclustered
observations analysis showed that feature transformation and reduction improved the UVFP voices cluster-
ability. The clustering error outcome did not depend on age, voice disorder types, or subtypes. These findings
may contribute to a better understanding of voice disorders’ properties, reducing misdiagnoses and supporting
their follow-up.
1 INTRODUCTION
The acoustic analysis represents an automatic, ob-
jective, computer-based approach to study and char-
acterize a wide variety of digitalized human sounds,
such as snoring, neonatal cry, voice and speech (Se-
bastian et al., 2021; Manfredi et al., 2018; Frassineti
et al., 2023). Usually, acoustic analysis implements
specific models of sound production to compute a set
of parameters capable of describing certain properties
of these biomedical signals, e.g., frequency perturba-
tion, noise level or nonlinear dynamics (Brockmann-
Bauser and Drinnan, 2011). With the recent advance-
ments in artificial intelligence (AI) methods and ap-
a
https://orcid.org/0009-0001-2214-8597
b
https://orcid.org/0009-0002-3226-8143
c
https://orcid.org/0000-0001-7455-5656
d
https://orcid.org/0000-0001-6008-3010
e
https://orcid.org/0009-0003-8027-1854
f
https://orcid.org/0000-0003-0897-3264
g
https://orcid.org/0000-0002-6540-5952
plications, such metrics are increasingly used as fea-
tures to train AI frameworks to develop automatic
tools that aim at supporting clinicians’ work to dif-
ferential diagnosis and severity assessment of vocal
pathologies. Indeed, several studies have demon-
strated how machine learning (ML) algorithms can
carry out exploratory analysis to identify vocal sub-
types (Desjardins et al., 2022; Shembel et al., 2023),
to recognize and classify voice disorders (Hu et al.,
2021; Verde et al., 2021) and to predict perceptual
assessments ratings (Jalali-Najafabadi et al., 2021).
These results are achieved by applying two different
AI strategies: unsupervised learning techniques are
performed for exploratory analyses, whereas classifi-
cation and regression tasks are typically carried out
with supervised methods. The main difference be-
tween these two relies on the type of data used. Su-
pervised learning uses labelled data, which means that
models, when trained, are provided with a baseline
understanding of what the correct output should be.
On the contrary, unsupervised learning or clustering
860
Calà, F., Correnti, F., Frassineti, L., Cantarella, G., Buccichini, G., Battilocchi, L. and Lanatà, A.
Unveiling Vocal Phenotypes of Dysphonia with Unsupervised Learning.
DOI: 10.5220/0013132200003911
Paper published under CC license (CC BY-NC-ND 4.0)
In Proceedings of the 18th International Joint Conference on Biomedical Engineering Systems and Technologies (BIOSTEC 2025) - Volume 1, pages 860-867
ISBN: 978-989-758-731-3; ISSN: 2184-4305
Proceedings Copyright © 2025 by SCITEPRESS – Science and Technology Publications, Lda.

works with unlabelled data. Therefore, it analyzes the
inherent structure of data without any specific instruc-
tion to identify hidden groups by considering prox-
imity or dissimilarity rules (Xu and Wunsch, 2005;
Saxena et al., 2017). Clustering in acoustic analysis
has been used firstly as a feature weighting technique,
i.e., to estimate and rank the relevance of extracted
features to better highlight an underlying pattern in
data and improve classification performance (Ni
˜
no-
Adan et al., 2021). The k-means algorithm, one of the
most used clustering techniques, was used to trans-
form nonlinearly separable features to linearly separa-
ble ones that, by gathering data with similar features,
proved to determine an increase in the discrimination
ability of ML algorithms. This has allowed obtaining
better accuracy, sensitivity and specificity to detect
the presence of voice pathology up to 10 percentage
points for some models (Hariharan et al., 2014) and
to boost the diagnostic power of a voice-based auto-
matic Parkinson’s disease classifier (G
¨
ur
¨
uler, 2017).
Moreover, clustering is particularly indicated in case
of highly heterogeneous diseases that are character-
ized by complex and large pathophysiology to refine
the phenotype of a given disease. This allows high-
lighting novel clusters of patients to make and plan
better precision medicine procedures. Indeed, such
an approach could identify that patients grouped by
specific properties present a unique symptom requir-
ing separate assessments and therapies to make them
more effective. For this latter task, the k-means al-
gorithm was implemented to characterize the degree
of speech impairments and find speech subtypes in
Huntington’s (Diehl et al., 2019) and Parkinson’s dis-
ease (Rusz et al., 2021). There is no accepted guide-
line to define such subgroups, and several factors can
be considered as motor, cognitive and speech dis-
orders and symptoms. Therefore, these evaluations
may suffer from clinicians’ experience and exper-
tise, as well as intra-subject variability (Tsanas and
Arora, 2022). A data-driven approach helped to de-
fine more compact speech disorder subtypes to bet-
ter understand the underlying mechanism of speech
production and to find possible explanations of con-
tradictory effects in applying specific treatments in
both Huntington’s and Parkinson’s diseases. Dyspho-
nia is another type of voice disorder, typically char-
acterized by a higher irregular pitch and lower vocal
intensity (G
´
omez-Garc
´
ıa et al., 2019). The combi-
nation of acoustic analysis and supervised AI tech-
niques proved that distinct voice pathologies can be
recognized with good accuracies, usually around 85%
(Za’im et al., 2023; Cal
`
a et al., 2023). However, the
underlying patterns that supervised learning can de-
tect between data and labels may be difficult to ex-
plain and interpret to clinicians unless specific precau-
tions are taken. In this study, it will be investigated
whether unsupervised learning can detect subtypes
of dysphonia in a newly recorded Italian database of
pathological voices. Specifically, as an exploratory
analysis, two main disorders will be considered: uni-
lateral vocal fold paralysis (UVFP) and benign le-
sions of the vocal folds (i.e., nodules, polyps, cysts,
hereinafter abbreviated with BLVF). They were cho-
sen because they present a straightforward difference
in vocal fold motor dynamics that can be assessed
with visual inspection by means of high-resolution
endoscopy. However, this device may not always
be available, especially in decentralized ambulato-
ries, and its invasiveness hinders patients’ tolerability
(Hamdan et al., 2023). Moreover, it requires the pa-
tients’ physical presence in a medical care setting. On
the other hand, acoustic analysis is a contactless and
cost-effective procedure. Nevertheless, the distinction
of dysphonia subtypes is not trivial with acoustic mea-
sures only. Moreover, it will be explored if clustering
can further recognize the subtypes of the BLVF class
to understand whether acoustic parameters may sup-
port their differential diagnosis. Finally, an evaluation
of misclustered observations will be performed to un-
derstand the role of two confounding factors. Firstly,
it will be investigated if cluster errors are biased by a
specific pathological group, including their subtypes
(i.e., unilateral left or right vocal fold paralysis or
cysts rather than nodules and polyps). Additionally,
the implicit role of age will be addressed to develop
an effective tool that can detect voice pathologies even
in the ageing population.
This approach could be helpful for otolaryngolo-
gists to support voice perceptual assessment, and re-
duce the impact of confounding factors in mis- and
underdiagnosis of voice pathologies.
2 MATERIALS AND METHODS
The pipeline of this work comprises three main steps:
after data collection and organization, features were
preprocessed as explained in subsection 2.2. Then,
two clustering problems based on the k-mean algo-
rithm were implemented to understand whether and
how selecting acoustic features that are statistically
different between pathological classes (aware analy-
sis, subsection 2.5) enhances clustering performance
with respect to using uncorrelated features only (un-
aware analysis, subsection 2.4).
Unveiling Vocal Phenotypes of Dysphonia with Unsupervised Learning
861

2.1 Dataset
A total of 287 patients (183 females F, mean age =
44.6±4.6 years, 104 males M, mean age = 42.6±9.4
years) was recruited at the Ospedale Maggiore Poli-
clincio Milano (Milan, Italy). Dysphonia and re-
lated voice pathology were diagnosed with both per-
ceptual evaluation of voice with the GRB scale (Hi-
rano, 1981) and video-laryngostroboscopic assess-
ment. However, in this study, only acoustic features
were considered in the unsupervised learning experi-
ments.
Commonly, UVFP patients present a higher mean
age with respect to BLVF (Herrington-Hall et al.,
1988). In our database, female patients diagnosed
with BLVF have a mean age of 44 years (minimum-
maximum range: 19-68), whereas the ones diagnosed
with UVFP present a mean age of 50 years (min-max
range: 21-72). For male patients, the mean age for
BLVF is 42 years (min-max range: 19-78), whereas
the mean age of UVFP subjects is 51 years (min-max
range: 26-80).
Table 1 displays their distribution, expliciting
BLVF subtypes, i.e., nodules, polyps and cysts.
Table 1: Patients distribution divided by gender and voice
pathology.
Pathology Female patients Male patients
Nodules 15 2
Polyps 56 38
Cysts 34 6
UVFP 78 58
For the acoustic analysis, patients were asked to
utter a sustained /a/ for at least 3s at a comfortable
pitch and loudness. Audio samples were recorded
through a C1000S dynamic microphone (AKG, Vi-
enna, Austria), with a sampling frequency of 44.1kHz
and a fixed distance of 5cm from the patient’s mouth
during phonation.
2.2 Feature Extraction, Transformation
and Selection
Acoustic parameters were extracted with the open-
source BioVoice software (Morelli et al., 2021). After
selecting age, gender and the type of vocal emission,
this tool automatically selects the proper frequency
range to identify and compute the fundamental fre-
quency F0 and, subsequently, a set of features encom-
passing both time and frequency domains. Specifi-
cally, BioVoice calculates a perturbation measure (the
local jitter), a noise measure (the Adaptive Normalize
Noise Energy, NNE), first, second and third formants
(F1, F2, F3, respectively), the number and duration
of voiced and unvoiced parts of the recordings. Ad-
ditionally, the median, standard deviation, minimum
and maximum values of these metrics are computed.
Two preprocessing methods have also been im-
plemented to enhance the clusterability of the data:
logarithm and cube-root transform. They are both
used to reduce the skewness of a distribution with the
cube-root transform being less effective but suitable
for both positive and negative values than the loga-
rithm one. Finally, to reduce the problem’s dimen-
sionality and extract a subset of acoustic features con-
taining the most valuable information, Principal Com-
ponent Analysis (PCA) and correlation analysis were
applied.
2.3 Clustering
A clustering problem assumes that an event space E,
described by an observation matrix n × p comes from
k different underlying divisible clusters (sometimes
referred to as the clusterability assumption and aims
to find each of the clusters. Several methods have
been proposed, with the k-means algorithm being one
of the most commonly used.
This algorithm initializes by selecting k values
from the event space as candidate cluster centers. It
then iteratively follows two steps:
• Assign: Each point in the event space is assigned
to the nearest candidate cluster center, resulting in
k different clusters.
• Update: Each cluster center is recalculated as the
mean of the coordinates of all points in the cluster,
yielding centroids.
The algorithm repeats these steps iteratively until con-
vergence, where the cluster centers no longer change.
Lloyd’s algorithm is esteemed for its optimal re-
sults, particularly when the event space consists of
data sampled from k independent normally distributed
clusters with diagonal covariance matrices (Bock,
1996). Clustering efficiency was evaluated by consid-
ering the silhouette score, a value ranging between -1
and 1 that compares inter-cluster distances with intra-
cluster ones. Moreover, accuracy was taken into ac-
count after performing manual diagnosis assignment,
given that clustering is an unsupervised learning ap-
proach.
2.4 Unaware Analysis
A first clustering problem investigates whether the
k-means algorithm can separate data into two sepa-
rate groups, corresponding to the BLVF and UVFP
BIOSIGNALS 2025 - 18th International Conference on Bio-inspired Systems and Signal Processing
862
classes, for each gender. On the other hand, a second
clustering problem explores the possibility of sepa-
rating data into four groups, i.e., the BLVF subclasses
(nodules, polyps, cysts) and UVFP. This experiment
was performed for the F dataset only due to the low
nodules numerosity of the M dataset.
The three approaches follow:
• Vanilla: No preprocessing is involved. It serves
as a reference point for comparison.
• PCA: Outlier removal based on the Interquartile
Range (IQR) is performed. Depending on data
normality, features are also scaled and centred ac-
cordingly. PCA is then applied: the number of
principal components m was chosen according to
the k-means clustering performance.
• Unskew + PCA: Before applying the PCA
pipeline, skewed data are cube-root or log-
transformed.
2.5 Aware Analysis
To improve the identification of clustered structures in
the analyzed groups, all available information should
be leveraged to filter out irrelevant features. Hence, to
identify an optimal subset, statistical tests were em-
ployed to determine which parameters present sig-
nificant differences between groups. An analogous
pipeline to the one presented in subsection 2.4 was
implemented.
2.6 Misclustered Observations Analysis
To provide interpretable results for clinicians, this
study also proposes an analysis over misclustered data
for the best unsupervised learning pipeline. Specif-
ically, by implementing cross-tabulation and chi-
square statistics, it was investigated whether the clus-
tering outcome depends on two factors: the pathol-
ogy and the age of patients. Moreover, since both the
considered diseases present subtypes, it was explored
whether errors are related to BLVF subtypes, i.e., nod-
ules, polyps and cysts, and UVFP subtypes, i.e., right
and left vocal fold paralysis.
3 RESULTS
This section presents the results of both the unaware
and aware analyses in subsection 3.1 and 3.2, respec-
tively. In turn, each subsection displays the outcome
of the 2- and 4-groups cluster analysis separately. For
all experiments, the best results were obtained with
BLVF
UVFP
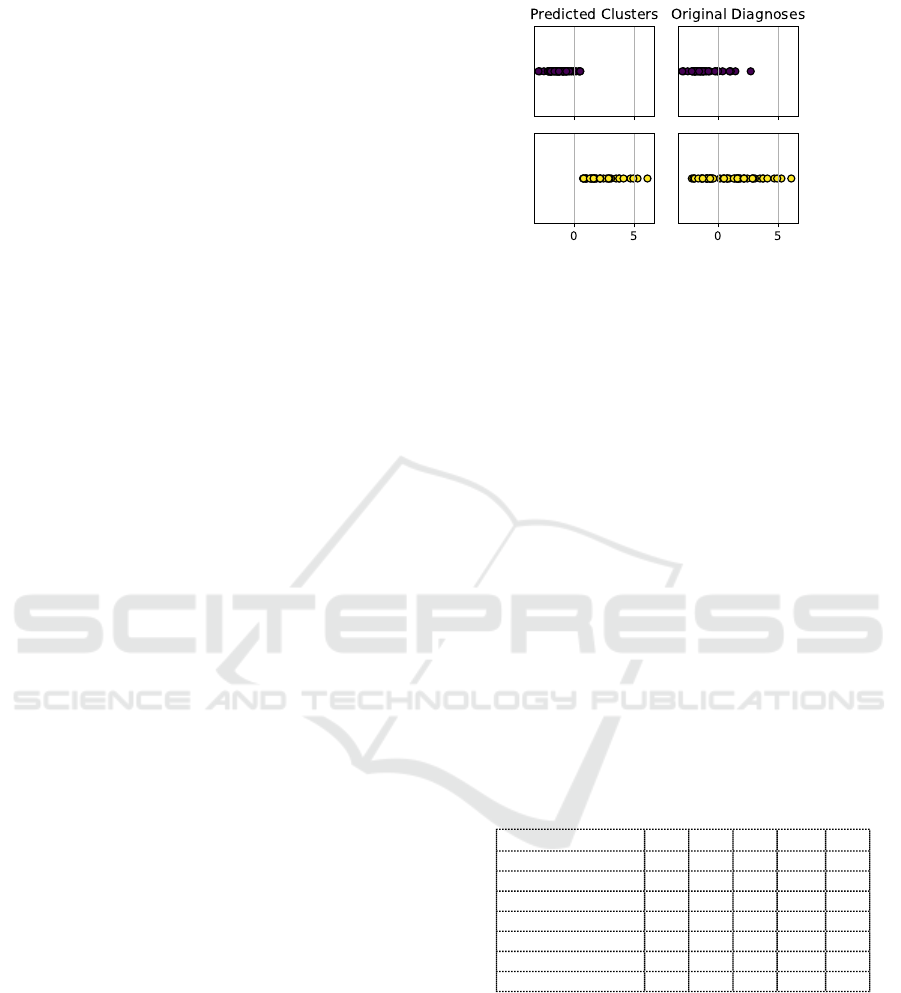
Figure 1: Graphical representation of the distribution of the
observations along the principal component axis in the orig-
inal dataset (right) and the predicted clusters (left).
one single principal component (m = 1). Figure 1 dis-
plays how the observations are distributed along the
principal component.
3.1 Unaware Analysis
3.1.1 2 Clusters
Table 2 shows the results of the three pipelines for the
2-groups unaware cluster analysis, divided by gen-
der. S
n
is the silhouette score computed for each
pathological group, where n = 1 refers to the BLVF
class, whereas n = 2 refers to the ULVF one; on the
other hand, S corresponds to the average silhouette
score. The abbreviation A refers to accuracy. Finally,
σ shows the percentage of variance explained by the
single PCA component.
Table 2: Results of k = 2 clusters analysis on the males and
females datasets. S = silhouette score, A = accuracy, σ =
retained variance percentage.
F - Unaware
S
1
S
2
S A σ
Vanilla 0.47 0.37 0.42 0.54 1.00
PCA 0.68 0.62 0.65 0.55 0.19
Unskew + PCA 0.70 0.59 0.64 0.616 0.21
M - Unaware
Vanilla 0.61 0.51 0.56 0.52 1.00
PCA 0.79 0.62 0.70 0.68 0.26
Unskew + PCA 0.77 0.64 0.70 0.69 0.28
3.1.2 4 Clusters
Table 3 displays the results of the three pipelines for
the 4-groups unaware cluster analysis. S
n
is the sil-
houette score computed for each pathological group,
where n = 1 refers to the nodules, n = 2 refers to
polyps, n = 3 to cysts, whereas n = 4 to UVFP. This
experiment was not performed for the male dataset
due to nodules low numerosity.
Unveiling Vocal Phenotypes of Dysphonia with Unsupervised Learning
863

Table 3: Results of k = 4 clusters analysis on the females
datasets. S = silhouette score, A = accuracy, σ = retained
variance percentage.
F - Unaware
S
1
S
2
S
3
S
4
S A σ
Vanilla 0.21 0.28 0.18 0.17 0.21 0.34 1.00
PCA 0.63 0.59 0.61 0.55 0.60 0.30 0.19
Unskew + PCA 0.57 0.67 0.66 0.6 0.62 0.34 0.21
num
1
num
2
num
3
num
4
Vanilla 30 55 49 77
PCA 18 75 64 40
Unskew + PCA 24 52 79 56
3.2 Aware Analysis
3.2.1 2 Clusters
Table 4 shows the results of the three pipelines for the
2-groups aware cluster analysis, divided by gender.
Table 4: Results of k = 2 clusters analysis on the males and
females datasets, after only retaining statistically significant
features.
F - Aware
S
1
S
2
S A σ
Vanilla 0.47 0.37 0.42 0.54 1.00
PCA 0.71 0.65 0.68 0.69 0.34
Unskew + PCA 0.68 0.72 0.70 0.665 0.35
M - Aware
Vanilla 0.61 0.51 0.56 0.52 1.00
PCA 0.79 0.61 0.70 0.69 0.43
Unskew + PCA 0.77 0.64 0.70 0.70 0.42
3.2.2 4 Clusters
Table 5 shows the results of the three pipelines for the
4-groups aware cluster analysis for the female dataset
only.
Table 5: Results of k = 4 clusters on females dataset, after
only retaining statistically significant features.
F - Aware
S
1
S
2
S
3
S
4
S A σ
Vanilla 0.21 0.28 0.18 0.17 0.21 0.34 1.00
PCA 0.52 0.56 0.54 0.60 0.58 0.33 0.43
Unskew + PCA 0.56 0.53 0.56 0.60 0.58 0.34 0.43
num
1
num
2
num
3
num
4
Vanilla 34 46 54 77
PCA 31 29 55 82
Unskew + PCA 26 71 36 78
3.3 PCA Weights Analysis
Figure 2 shows the barplot explaining which acoustic
features, after checking for their statistically signifi-
cant difference between BLVF and UVFP, contributed
the most to the PCA component before (left) and after
(right) unskewing the original data. Blue bars refer to
male patients, whereas red bars to female ones. An
unskewed feature is marked with a green dotted line.
3.4 Misclustered Observation Analysis
Figure 3 shows the percentage of misclustered obser-
vations for each voice disorder divided by pipeline
and gender for the unaware condition.
Figure 4 displays the percentage of misclustered
observation for each voice disorder, divided per
pipeline and gender, for the aware condition.
The best clustering results were obtained for the
aware condition and the Unskew + PCA pipeline, for
both genders. Therefore, the relationship between
clustering outcome and pathology and age was per-
formed for these models only.
For the female dataset, the clustering outcome did
not depend on the general voice pathology (p = 0.91).
Specifically, when considering the BLVF subtypes, a
close to significant (p = 0.08) relationship was found
with the clustering outcome. The incorrectly clus-
tered observations mostly belonged to patients diag-
nosed with polyps. Similarly, separating right and
left vocal fold paralysis had no significant result (p =
0.41). As far as age is concerned, the clusterization
outcome did not depend on patients’ age (p = 0.51),
and this result was also confirmed when separating
the female cohort in the BLVF (p = 0.06) and UVFP
classes (p = 0.37).
Similar results were found for the male dataset.
Clustering error did not relate to patients’ pathology,
neither in general terms (BLVF vs UVFP, p = 0.34)
nor considering their respective subtypes (nodules vs
polyps vs cysts, p = 0.32, and left vs right vocal fold
paralysis, p = 0.79). Moreover, age and clustering
outcome did not relate significantly (p = 0.58 consid-
ering pathologies altogether, 0.59 considering BLVF
only, p = 0.63 considering UVFP only).
4 DISCUSSION
This study proposes an unsupervised learning ap-
proach to explore the clusterability of patients di-
agnosed with benign lesions of the vocal folds and
unilateral vocal fold paralysis based on uncorrelated
acoustic features (unaware condition) and signifi-
cantly different features between BLVF and UVFP
(aware condition).
When considering the two groups classification
problem, the best results for both genders were
achieved using the aware condition. Indeed, for the
female dataset, the average silhouette score and accu-
racy for the best pipeline (i.e., the Unskew + PCA
one) are 0.70 and 0.67, respectively, compared to
the unaware condition where S = 0.64 and A = 0.62.
On the other hand, for the male dataset, the aware
condition obtained similar results of those concern-
ing the unaware condition. In fact, both experiments
present S = 0.70 and a slightly higher accuracy for
the aware condition (A = 0.70 vs A = 0.69). Interest-
ingly, the preprocessing procedure helped improving
BIOSIGNALS 2025 - 18th International Conference on Bio-inspired Systems and Signal Processing
864
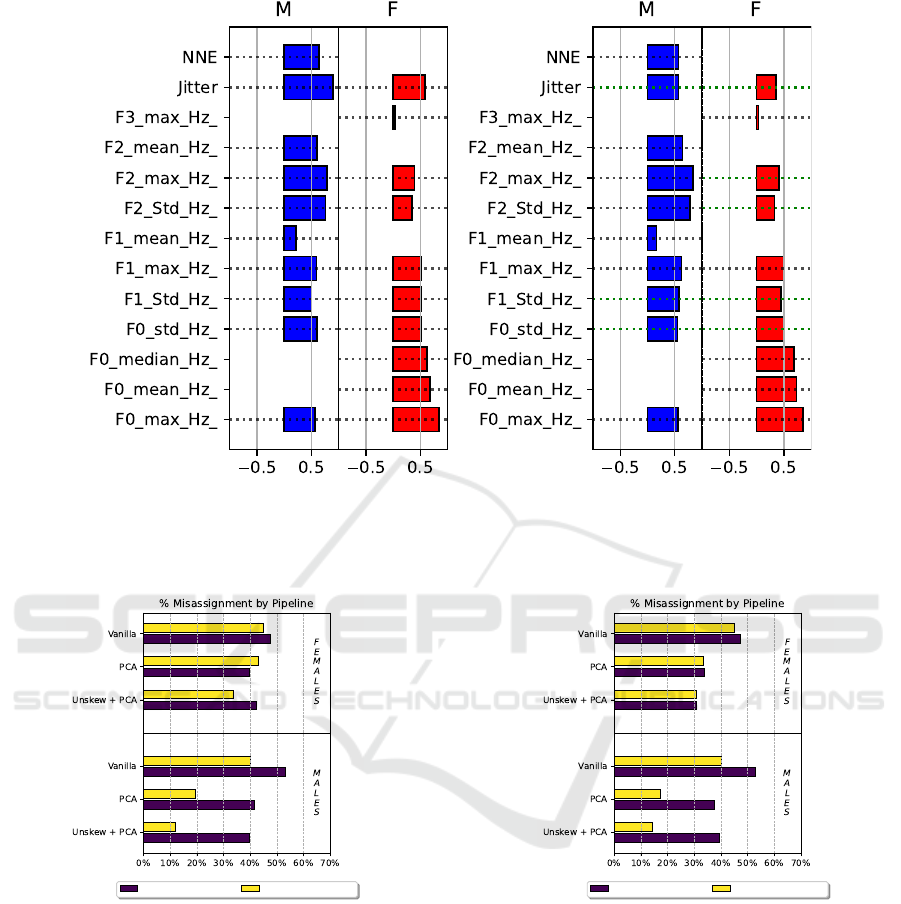
(a) Vanilla (b) Unskewed
Figure 2: Barplot of features weights in the first principal component after retaining only features that show statistical dif-
ference. PCA is performed before (a) and after (b) unskewing. The skewed, transformed features, are marked with a dotted
green line.
Cluster 1 : BLVF Cluster 2 : UVFP
Figure 3: Barplot of the percentage of misassignments in
each cluster found by the unaware condition in the three
pipelines.
the silhouette score for the UVFP class, especially for
the female dataset. Indeed, clustering went from the
S
2
= 0.37 of the Vanilla pipeline to the S
2
= 0.72 of
the Unskew + PCA one. A model with such a property
could be helpful in clinical practice because it better
recognizes the most severe of the considered patholo-
gies, possibly reducing its misdiagnosis (Low et al.,
2024). An analogous result was obtained for the male
dataset, for which feature transformation allowed to
obtain a S
2
= 0.64, starting from the Vanilla pipeline
value of S
2
= 0.51.
Cluster 1 : BLVF Cluster 2 : UVFP
Figure 4: Barplot of the percentage of misassignments
in each cluster found by the aware condition in the three
pipelines.
The benefits of feature preprocessing is also sup-
ported by Figure 4, as indeed the upper panel concern-
ing female patients shows a monotonical decrease of
the number of misassignments from the vanilla to the
Unskew + PCA pipelines and, for this latter one, a
balance between misclustered BLVF and UVFP ob-
servations. Moreover, Figure 2 highlights that the
largest contributions for the principal component de-
rive from parameters describing phonation character-
istics only, specifically the mean and maximum of the
fundamental frequency. This outcome suggests that
Unveiling Vocal Phenotypes of Dysphonia with Unsupervised Learning
865

parameters related to the vibratory dynamics of the
vocal folds may be sufficient to distinguish the patho-
logical classes, possibly simplifying recording proto-
cols and the subsequent objective analysis of audio
acquisitions (Robotti et al., 2021).
For the male dataset, the lower panel of Figure
4 highlights a similar beneficial effect. However, it
also displays a close number of misassignments for
both pathologies to the one showed in Figure 3. A
smaller sample size might cause this similarity, there-
fore, more data from a male population should be col-
lected to validate such an outcome. Oppositely to the
female dataset, articulation parameters weighted the
most to the principal component (right panel of Figure
2). Specifically, the maximum and standard deviation
of the second formant, as well as the standard devi-
ation of the first formant, show the largest contribu-
tion. This may mean that the UVFP negatively affect
the constriction degree and motility of the supraglottic
area and the tongue, consequently altering vocal prop-
erties differently from BLVF. This could suggest clin-
icians using non-invasive tools, e.g., ultrasound imag-
ing, to assess their movements as additional methods
to monitor UVFP (Saigusa et al., 2006; Wang et al.,
2012).
A chi-squared test of associations (α = 0.05)
proved that the number of errors in the clustering did
not depend on the pathology. Furthermore, even if
UVFP usually presents a later onset with respect to
BLVF, age was not a significant factor when com-
paring correctly and incorrectly clustered data (p =
0.51). Such a result suggests the feasibility of the pro-
posed approach to better define a vocal phenotype for
the involved pathologies that can be effectively used
in elder care. Similarly to the female dataset, the chi-
squared test of associations (α = 0.05) proved that the
number of errors in the clustering did not depend on
the pathology and age (p = 0.58), even when con-
sidering subtypes. Regarding the four groups clas-
sification experiment, the usage of the optimal subset
of significantly different features between BLVF and
UVFP did not produce a better outcome. In fact, the
best average silhouette score of S = 0.62 was obtained
for the unaware condition. Analogously to the two
group problem, feature selection and transformation
allowed to improve all evaluation metrics.
Finally, the right panel of Figure 1 shows that, even
if the proposed approach achieves a good separation
of the two considered pathologies, the original data
distribution of UVFP observations seem to be more
dispersed than BLVF ones. This could result from the
severity degree of vocal fold paralysis, which should
be considered in future studies as a confounding fac-
tor.
5 CONCLUSION
This study has developed an automatic and ro-
bust framework that, based on unsupervised learning
methods, can distinguish between two voice disor-
ders provoking dysphonia with acoustic features only.
Therefore, clinicians could use it to support differen-
tial diagnosis. The results from the male dataset re-
main similar between the unaware and aware condi-
tions, whereas the female data clusterability benefits
the most from the identification of significantly dif-
ferent parameters between BLVF and UVFP. In both
genders, misclustered observations seem not to de-
pend on a specific pathology (and its subtypes) and
age. Moreover, through the PCA weight analysis, this
study highlighted that phonation parameters were the
most contributive ones for the female dataset, whereas
articulation feature were the most relevant for the
male dataset.
ACKNOWLEDGEMENTS
The research leading to these results has received
funding from the project PE8-AGE-IT “A NOVEL
PUBLICPRIVATE ALLIANCE TO GENERATE
SOCIOECONOMIC, BIOMEDICAL AND TECH-
NOLOGICAL SOLUTIONS FOR AN INCLUSIVE
ITALIAN AGEING SOCIETY”, Codice MIUR: PE
00000015, CUP: B83C22004800006.
REFERENCES
Bock, H. H. (1996). Probabilistic models in cluster analysis.
CSDA, 23(1):5–28.
Brockmann-Bauser, M. and Drinnan, M. J. (2011). Routine
acoustic voice analysis: time to think again? Curr
Opin Otolaryngol Head Neck Surg, 19(3):165–170.
Cal
`
a, F., Frassineti, L., Cantarella, G., Battilocchi, L., Buc-
cichini, G., Lanat
`
a, A., and Manfredi, C. (2023).
AI techniques applied to acoustical features of para-
lytic dysphonia versus dysphonia due to benign vo-
cal fold masses. In Models and Analysis of Vocal
Emissions for Biomedical Applications: 13th Interna-
tional Workshop, September, 12-13, 2023, pages 83–
86. Firenze University Press.
Desjardins, M., Halstead, L., Simpson, A., Flume, P., and
Bonilha, H. S. (2022). The impact of respiratory func-
tion on voice in patients with presbyphonia. J Voice,
36(2):256–271.
Diehl, S. K., Mefferd, A. S., Lin, Y.-C., Sellers, J., Mc-
Donell, K. E., de Riesthal, M., and Claassen, D. O.
(2019). Motor speech patterns in huntington disease.
Neurology, 93(22):e2042–e2052.
BIOSIGNALS 2025 - 18th International Conference on Bio-inspired Systems and Signal Processing
866

Frassineti, L., Cal
`
a, F., Sforza, E., Onesimo, R., Leoni, C.,
Lanat
`
a, A., Zampino, G., and Manfredi, C. (2023).
Quantitative acoustical analysis of genetic syndromes
in the number listing task. Biomed Sig Process Con-
trol, 85:104887. doi: 10.1016/j.bspc.2023.104887.
G
´
omez-Garc
´
ıa, J. A., Moro-Vel
´
azquez, L., and Godino-
Llorente, J. I. (2019). On the design of auto-
matic voice condition analysis systems. Part I: Re-
view of concepts and an insight to the state of the
art. Biomed Sig Process Control, 51:181–199. doi:
10.1016/j.bspc.2018.12.024.
G
¨
ur
¨
uler, H. (2017). A novel diagnosis system for parkin-
son’s disease using complex-valued artificial neural
network with k-means clustering feature weighting
method. Neural Comput App, 28:1657–1666.
Hamdan, A.-L., Jabbour, C., Khalifee, E., Ghanem, A., and
El Hage, A. (2023). Tolerance of patients using differ-
ent approaches in laryngeal office-based procedures. J
Voice, 37(2):263–267.
Hariharan, M., Polat, K., and Yaacob, S. (2014). A new fea-
ture constituting approach to detection of vocal fold
pathology. IJSS, 45(8):1622–1634.
Herrington-Hall, B. L., Lee, L., Stemple, J. C., Niemi,
K. R., and McHone, M. M. (1988). Description of
laryngeal pathologies by age, sex, and occupation in
a treatment-seeking sample. J Speech Hear Disord,
53(1):57–64. doi: 10.1044/jshd.5301.57.
Hirano, M. (1981). Clinical examination of voice. Disor-
ders of human communication, 5:1–99. ISSN 0173-
170X.
Hu, H.-C., Chang, S.-Y., Wang, C.-H., Li, K.-J., Cho,
H.-Y., Chen, Y.-T., Lu, C.-J., Tsai, T.-P., and Lee,
O. K.-S. (2021). Deep learning application for vo-
cal fold disease prediction through voice recognition:
preliminary development study. J Med Internet Res,
23(6):e25247.
Jalali-Najafabadi, F., Gadepalli, C., Jarchi, D., and
Cheetham, B. M. (2021). Acoustic analysis and digital
signal processing for the assessment of voice quality.
Biomed Sig Process Control, 70:103018.
Low, D. M., Rao, V., Randolph, G., Song, P. C., and Ghosh,
S. S. (2024). Identifying bias in models that detect vo-
cal fold paralysis from audio recordings using explain-
able machine learning and clinician ratings. PLOS
Digit Health, 3(5):e0000516.
Manfredi, C., Bandini, A., Melino, D., Viellevoye, R.,
Kalenga, M., and Orlandi, S. (2018). Automated de-
tection and classification of basic shapes of newborn
cry melody. Biomed Sig Process Control, 45:174–181.
Morelli, M. S., Orlandi, S., and Manfredi, C. (2021).
Biovoice: A multipurpose tool for voice analysis.
Biomed Sig Process Control, 64:102302.
Ni
˜
no-Adan, I., Manjarres, D., Landa-Torres, I., and Portillo,
E. (2021). Feature weighting methods: A review. Ex-
pert Syst Appl, 184:115424.
Robotti, C., Costantini, G., Saggio, G., Cesarini, V., Calas-
tri, A., Maiorano, E., Piloni, D., Perrone, T., Sabatini,
U., Ferretti, V. V., et al. (2021). Machine learning-
based voice assessment for the detection of positive
and recovered covid-19 patients. J Voice.
Rusz, J., Tykalova, T., Novotny, M., Zogala, D., Sonka,
K., Ruzicka, E., and Dusek, P. (2021). Defining
speech subtypes in de novo parkinson disease: re-
sponse to long-term levodopa therapy. Neurology,
97(21):e2124–e2135.
Saigusa, H., Saigusa, M., Aino, I., Iwasaki, C., Li, L., and
Niimi, S. (2006). M-mode color doppler ultrasonic
imaging of vertical tongue movement during articula-
tory movement. J Voice, 20(1):38–45.
Saxena, A., Prasad, M., Gupta, A., Bharill, N., Patel, O. P.,
Tiwari, A., Er, M. J., Ding, W., and Lin, C.-T. (2017).
A review of clustering techniques and developments.
Neurocomputing, 267:664–681.
Sebastian, A., Cistulli, P. A., Cohen, G., and de Chazal,
P. (2021). Association of snoring characteristics with
predominant site of collapse of upper airway in ob-
structive sleep apnea patients. Sleep, 44(12):zsab176.
Shembel, A. C., Lee, J., Sacher, J. R., and Johnson, A. M.
(2023). Characterization of primary muscle tension
dysphonia using acoustic and aerodynamic voice met-
rics. J Voice, 37(6):897–906.
Tsanas, A. and Arora, S. (2022). Data-driven subtyping of
parkinson’s using acoustic analysis of sustained vow-
els and cluster analysis: findings in the parkinson’s
voice initiative study. SN Comput Sci, 3(3):232.
Verde, L., De Pietro, G., Ghoneim, A., Alrashoud, M., Al-
Mutib, K. N., and Sannino, G. (2021). Exploring the
use of artificial intelligence techniques to detect the
presence of coronavirus covid-19 through speech and
voice analysis. Ieee Access, 9:65750–65757.
Wang, C.-P., Chen, T.-C., Lou, P.-J., Yang, T.-L., Hu, Y.-L.,
Shieh, M.-J., Ko, J.-Y., and Hsiao, T.-Y. (2012). Neck
ultrasonography for the evaluation of the etiology of
adult unilateral vocal fold paralysis. Head & neck,
34(5):643–648.
Xu, R. and Wunsch, D. (2005). Survey of clustering
algorithms. IEEE Trans Neural Netw Learn Syst,
16(3):645–678.
Za’im, N. A. N., Al-Dhief, F. T., Azman, M., Alsemawi,
M. R. M., Abdul Latiff, N. M. a., and Mat Baki, M.
(2023). The accuracy of an online sequential extreme
learning machine in detecting voice pathology using
the malaysian voice pathology database. Otolaryngol
Head Neck Surg, 52(1):s40463–023.
Unveiling Vocal Phenotypes of Dysphonia with Unsupervised Learning
867
