
Immersive in Situ Visualizations for Monitoring Architectural-Scale
Multiuser MR Experiences
Zhongyuan Yu
a
, Daniel Zeidler
b
, Krishnan Chandran
c
, Lars Engeln
d
, Kelsang Mende
e
and Matthew McGinity
f
Immersive Experience Lab, Technische Universit
¨
at Dresden, Helmholtzstr. 10, 01069 Dresden, Germany
{zhongyuan.yu, daniel.zeidler, krishnan.chandran, lars.engeln, kelsang.mende, matthew.mcGinity}@tu-dresden.de
Keywords:
Information Visualization, in Situ Visualization, Multiuser Mixed Reality.
Abstract:
Mixed reality (MR) environments provide great value in displaying 3D virtual content. Systems facilitating
co-located multiuser MR (Co-MUMR) experiences allow multiple users to co-present in a shared immersive
virtual environment with natural locomotion. They can be used to support a broad spectrum of applications
such as immersive presentations, public exhibitions, psychological experiments, etc. However, based on our
experiences in delivering Co-MUMR experiences in large architectures and our reflections, we noticed that the
crucial challenge for hosts to ensure the visitors’ quality of experience is their lack of insight into the real-time
information regarding visitor engagement, device performance, and system events. This work facilitates the
display of such information by introducing immersive in situ visualizations.
1 INTRODUCTION
Over recent years, multiuser MR (MUMR) systems,
in which groups of people share a single, coherent
world composed of virtual and real elements, have
been shown to hold great promise, with applications
spanning education, gaming, and data analysis. By
enabling direct perception of both the physical world
and fellow users, MUMR fosters collective, collabo-
rative behavior, and contributes to overcoming isola-
tion experienced with pure VR (Guo et al., 2024).
Recently, low-cost mobile HMDs with video see-
through capabilities, such as Meta Quest 3s, allow for
seamless and flexible adjustment in the integration be-
tween real and virtual environments across the entire
reality-virtuality continuum (Milgram et al., 1995).
Besides, with the emergence of robust markerless
inside-out tracking and on-device computing, such
devices can now be effectively used in large spaces
without depending on any external tracking or com-
puting infrastructure. Hence MUMR systems built on
such devices become highly scalable, allowing visi-
a
https://orcid.org/0000-0002-3671-1619
b
https://orcid.org/0000-0003-4954-4896
c
https://orcid.org/0000-0002-5718-7043
d
https://orcid.org/0000-0002-9268-4854
e
https://orcid.org/0009-0005-5978-5513
f
https://orcid.org/0000-0002-8923-6284
tors to explore expansive virtual scenarios by natu-
rally walking through large architectural spaces, mak-
ing them ideally suited for creating immersive presen-
tations.
We use the term Co-MUMR to refer to Co-Located
Multiuser Mixed Reality experiences. Further, we
define a Co-MUMR experience to be “architectural
scale” when it enables viewers to navigate freely
within spaces that exceed the dimensions of typi-
cal room-sized environments and involves structures
such as hallways, staircases, mezzanines, elevators,
escalators, etc (Schier et al., 2023). In our lab, we
have developed and deployed many Architectural-
scale Co-MUMR experiences, in artistic, educational,
museum, research studies or prototypes, gaming, and
psychotherapy domains, gaining many hundreds of
hours of experience with hundreds of subjects. In
all cases, we observe roles are typically differentiated
into “host” and “visitors”. Depending on the context,
the “host” may be a tour guide, teacher, instructor,
moderator, experiment coordinator, or support techni-
cian, while the “visitors” may be museum or exhibi-
tion visitors, trainees or students, or trial subjects, for
example. The “host” typically has experience with the
system, and is responsible for ensuring a smooth ex-
perience for everyone involved. Sometimes multiple
hosts are active, or the roles change dynamically.
Very often, the hosts themselves are wearing an
HMD, because they have an active role as guid-
Yu, Z., Zeidler, D., Chandran, K., Engeln, L., Mende, K. and McGinity, M.
Immersive in Situ Visualizations for Monitoring Architectural-Scale Multiuser MR Experiences.
DOI: 10.5220/0013135600003912
Paper published under CC license (CC BY-NC-ND 4.0)
In Proceedings of the 20th International Joint Conference on Computer Vision, Imaging and Computer Graphics Theory and Applications (VISIGRAPP 2025) - Volume 1: GRAPP, HUCAPP
and IVAPP, pages 895-902
ISBN: 978-989-758-728-3; ISSN: 2184-4321
Proceedings Copyright © 2025 by SCITEPRESS – Science and Technology Publications, Lda.
895
ing experts in the experience. In this case, they
face the challenge of performing their “in-experience”
diegetic role (e.g. teacher), while simultaneously per-
forming the role of host. However, even in cases
where the host has no active diegetic role, our expe-
rience demonstrates that the performing of the duties
of a host can be greatly enhanced when the host them-
selves is wearing an HMD.
In this paper, we therefore explore the possibili-
ties and investigate the usefulness of in situ mixed re-
ality visualizations for hosting architectural-scale Co-
MUMR experiences. We facilitate the display of real-
time visitor and device information with immersive in
situ visualizations, empowering hosts with direct in-
formation access. The visualized information serves
as an initial step towards enabling informed decision-
making, assisting in resolving technical issues, or po-
tentially offering targeted assistance and explanations
to visitors during the experience.
Our main contributions are: (1) The design of im-
mersive in situ visualizations for monitoring visitor
engagement and system performance towards aiding
hosts in enhancing visitor experiences. (2) The imple-
mentation of the proposed in situ visualizations in an
operational system.
2 RELATED WORK
A few approaches have investigated in situ visualiza-
tions of visitors’ engagement, such as view directions,
directly in the immersive environment. For instance,
Wang et al. proposed a system to enhance trans-
parency and integrative transition between the reali-
ties of HMD users sharing the same physical envi-
ronment (Wang et al., 2020). It allows guests to ob-
serve all other HMD users’ interactions contextual-
ized in their own MR environment. However, this ap-
proach primarily aims at enabling guests to perceive
each other’s perspectives without distinguishing be-
tween hosts and visitors and it is not specifically tai-
lored to address the challenge of understanding visi-
tor engagement in large architectural spaces. Thanya-
dit et al. developed a system to enable instructors
to observe and guide students in the context of VR
classrooms (Thanyadit et al., 2019). They proposed
immersive visualizations to enhance the instructor’s
ability to monitor students’ activities and focus. How-
ever, the system primarily caters to educational set-
tings where the virtual environment for each visitor
is consistently synchronized, which is considered as
a “guided” experience, visualizations to offer insights
into visitor engagement in an “explorative” setting are
not included in their work.
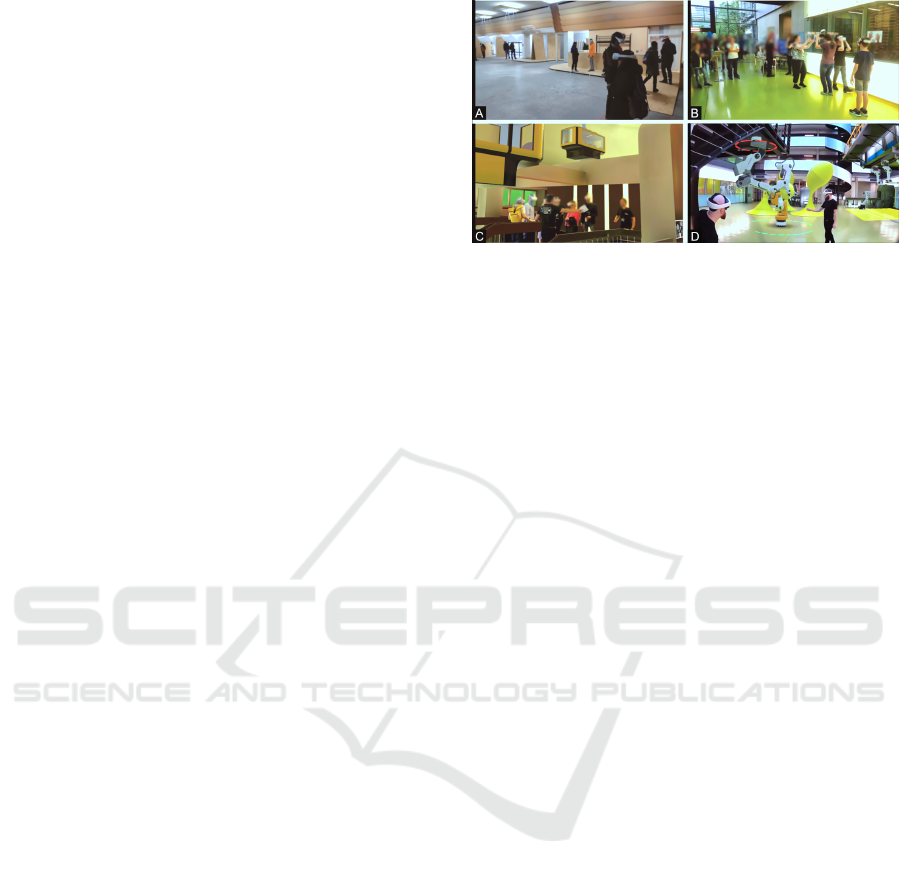
Figure 1: Photos and screenshots of our previously orga-
nized and hosted Co-MUMR experiences.
3 INFORMATION
EXPECTATIONS AND DESIGN
CONSIDERATIONS
3.1 Co-MUMR Hosting Experiences
Throughout the past years, our lab has developed and
exhibited many Co-MUMR experiences, in a variety
of public and research domains, ranging from public
exhibitions in museums to multi-user educational ex-
periences and large-scale MUMR scientific studies in
psychology and psychotherapy (as shown in Fig. 1).
Collectively, this constitutes many hundreds of hours
of hands-on MUMR experience with many hundreds
of visitors. We present four such cases here:
E1: Hybrid Spaces. In February 2023, we de-
veloped and hosted a Co-MUMR experience that
blended real and virtual elements, transforming a 30m
x 20m space into an immersive multi-layered parkour
environment. This explorative experience spanned
four days, with 180 visitors, each on average staying
30 minutes in MR (see Fig. 1 (A)). The hosts were re-
sponsible for introducing the concept to participants,
aiding the tracking alignment, and resolving issues for
unexpected disruptions. Hosts did not wear MR head-
sets themselves.
E2: Virtual Leap of Faith. Around the same pe-
riod, we conducted a second Co-MUMR experience,
augmenting a four-story building with a large space
(20m x 30m) by superimposing it with an artistic
version of the space. This Co-MUMR experience
spanned one day, engaging around 100 visitors. Each
session accommodated a minimum of two partici-
pants, managed by three individuals (see Fig. 1 (B)).
IVAPP 2025 - 16th International Conference on Information Visualization Theory and Applications
896

E3: Future Mobility. In mid-2023, we organized
an additional Co-MUMR experience in the foyer and
on the terrace of the second floor (around 15m x 5m
each), with a focus on future climate-neutral mobil-
ity concepts. This one-day event drew the interest of
approximately 50 visitors (see Fig. 1 (C)).
E4: Robot Lab. In early 2024, we developed and
hosted a Co-MUMR robot lab experience in a large
foyer space (20m x 30m) with around 20 participants,
aimed to illustrate the concepts of human-robot inter-
action (see Fig. 1 (D)).
3.2 Challenges and Expectations
Given the novelty and the limited access to Co-
MUMR experiences at the time of writing, very few
people have adequate experience in hosting such ex-
periences except our colleagues. Thus in this work,
we conducted meta-reflection sessions with four ex-
perienced hosts within our team (including colleagues
and authors, all hosted at least two Co-MUMR expe-
riences before) based on those previous hosting ex-
periences (E1-4) and collected the challenges and ex-
pectations. The sessions are organized as interviews
and each session lasts around 60 min. During the in-
terview, we encouraged the hosts to recall and enu-
merate all challenges encountered during their host-
ing and their anticipated solutions uninterrupted (Yoo
et al., 2018). We then filtered the ones that could po-
tentially be addressed through immersive in situ visu-
alizations. The findings are in the following.
During E1, without information on the visitors’
rendered view, it was difficult for hosts to determine
whether the visitors were viewing the intended con-
tent or mistakenly entered another scene or opened a
wrong app. When assisting visitors with issues, the
hosts always started by communicating verbally, in-
quiring about what the visitors were seeing, some-
times the hosts even had to take over visitors’ headsets
to understand their perspective. There was a need for
hosts to understand visitors’ perspectives efficiently
and effectively. Besides, as described above, the visi-
tor flow was extensive. The hosts found it challenging
to provide headsets with sufficient battery life. There
is a risk of visitors’ headset batteries depleting un-
expectedly. Moreover, due to the complex nature of
Co-MUMR systems and visitor interactions, hosts en-
countered unexpected technical issues, including net-
work offline events, calibration failures, and frame
drops. There is a need to show system events in their
occurring places to help identify issues. In addition to
the visualization of system events, for diagnosing the
issues, it is necessary to delve deeper by examining
detailed device performance history before and after
the event time point.
In E2, hosting an artistic experience, the hosts ex-
pected the virtual content to be delivered optimally
with the best possible device performance. This re-
quires hosts to remain attentive to technical factors as
the experience runs, including rendering frame rate,
CPU/GPU usage, battery levels, positional tracking,
hand tracking, network strength, bandwidth, etc and
be ready to assist.
Co-MUMR experience E3 was held in a multi-
story building with obstacles. The hosts noticed that
visitors sometimes spread out, making it difficult to
track where they went, let alone assist them. Besides,
the network connection was not stable – visitors might
suddenly go offline due to unexpected reasons such as
going out of range, low battery life, or pressing the
wrong button. There is a need to be aware of such de-
vice offline events to aid in debugging network issues.
During E4, when demonstrating the manipulation
of virtual robot arms, hosts noticed that it wasn’t
clear if visitors fully understood the steps taken and
whether the visitors could see the intended actions be-
ing performed. Questions like “Are you seeing what I
am seeing?” was frequently observed.
3.3 Key Information for Hosts
Based on the above reflections, we observed that hosts
face a recurring challenge related to the hindered
awareness of the entire operational context and they
require real-time information to provide the necessary
assistance. We summarize the expected information
as follows:
I1: Information Regarding Visitor Engagement.
There is a need for hosts to understand how visitors
are engaging with and enjoying the Co-MUMR expe-
rience. This includes: What are visitors seeing and
doing? Where are they? Thus, it is classified as visi-
tors’ perspectives (E1, E4) and locations (E3).
I2: Information Regarding Device Performance.
Besides, there is a need to know the real-time status
of device performance and make sure they are work-
ing optimally. This could be classified as the devices’
general performance (including rendering frame rate,
CPU/GPU usage, 3D position, etc) (E1, E2), hand
tracking performance (E2), and networking perfor-
mance (E2). Device performance history for inspect-
ing system events is also desired based on E1.
I3: Information Regarding Real-time Event. We
note that based on the experience in E1 and E3, there
Immersive in Situ Visualizations for Monitoring Architectural-Scale Multiuser MR Experiences
897

is a need for hosts to be aware of system events, in-
cluding networking events (E3) and calibration events
(E1) to help debug system functions.
3.4 Design Considerations
In this work, we aim to deliver the expected informa-
tion (I1, I2, I3) to hosts through visualizations, en-
hancing their awareness and effectiveness when mon-
itoring the visualizations. Through monitoring, hosts
are empowered with great information access and im-
proved awareness of issues, which could lead to po-
tential actions such as active visitor flow guidance to
improve the visiting experience.
Immersive In Situ Visualization. Based on our ex-
perience, in many cases, the host must join the immer-
sive experience to share his spatial movements with
the visitors and be in the same virtual reality while
hosting. While it is also possible to display the visitor
and system information on an additional 2D display,
we target immersive in situ mixed-reality visualiza-
tions in this work given the following reasons: 1) The
spatial and dynamic nature of the desired information
(I1, I2, I3) is well-suited to be displayed spatially in
mixed reality. For example, the visitors’ movement
is originally in 3D and would move around the space
constantly. 2) Wearing the same mixed-reality head-
sets as visitors allows hosts to experience the same
virtual environment, enabling a better understanding
of the visitors’ perspectives. 3) Embedded visualiza-
tions (Willett et al., 2017) in mixed reality allow users
to effortlessly access desired information (I1, I2, I3)
by simply approaching the relevant subject, thus elim-
inating the need for context switching.
Adaptivity. By offering visualization alternatives,
hosts can transform the visualizations into various
forms, enabling them to meet their monitoring needs.
We designed visualizations to be adaptive in large ar-
chitectural spaces, ranging from subject-centric: vi-
sualizations placed embedded by the side of the rel-
evant subjects (visitors, devices) to host-centric: vi-
sualizations projected in front of the host. For host-
centric visualizations, we enable hosts to adjust the
visual displays to either eye or floor level.
4 VISUALIZATION DESIGN AND
IMPLEMENTATION
Here, we designed a series of immersive in situ vi-
sualizations and refined the visual style of the visu-
alizations iteratively with an experienced visual de-
signer. The visualizations are classified according to
the desired information in Sec. 3.3 with Sec. 4.1 de-
signed for displaying I1 (information regarding visitor
engagement), Sec. 4.2 for I2 (information regarding
device performance), and Sec. 4.3 for I3 (information
regarding real-time event). At runtime, the visualiza-
tions can be configured separately and integrated on
demand with great flexibility with an MR GUI panel.
Note that in the following figures, the items shown
in grayscale indicate scene-specific or background
components, while the colorized elements highlight
the proposed visualizations. The reddish color is used
solely to emphasize the visualization concepts pre-
sented in this work. In practical applications, the color
scheme is customizable to suit specific needs or pref-
erences.
4.1 Visitor Engagement Visualization
Based on the analysis of desired visitor information
in Sec. 3.3, in this section, we describe the proposed
visualizations to show visitors’ perspective with a de-
tailed view (visitors’ rendered view in Sec. 4.1.1)
and coarse overview (real-time view frustum in Sec.
4.1.1), location of individual visitors (Sec. 4.1.2) and
a group of visitors as an overview (Sec. 4.1.3).
4.1.1 Visitors’ Rendered View and View
Frustum
Showing visitors’ rendered view serves as an intu-
itive approach for hosts to understand their engage-
ment (I1). However, built-in view monitoring func-
tions on most MR headsets trend to stream the views
to a website or a mobile application, providing min-
imal support for monitoring the view directly from
another MR device. For this, we developed a cus-
tomized code block to handle the data transmission
and support the display of visitors’ rendered views
directly within the host’s headset. When rendering
in an immersive space, instead of the conventional
approach of placing all views on a large panel, we
support embedded visualization by showing a view
frustum for each visitor and subsequently texturing
the visitor’s perspective directly onto the forefront of
this frustum. However, given the dynamic nature of
the visitors’ viewing directions, view frustums could
move constantly. Thus, we suggest attaching the view
adjacent to visitors and keeping the view oriented to
the host to show the detailed visitors’ rendered view
(as shown in Fig. 2 (A)) while using the view frustum
as an overview of visitor engagement (Fig. 2 (D)).
In large spaces, however, the attached views could
be less visible when visitors are distant from the host.
IVAPP 2025 - 16th International Conference on Information Visualization Theory and Applications
898
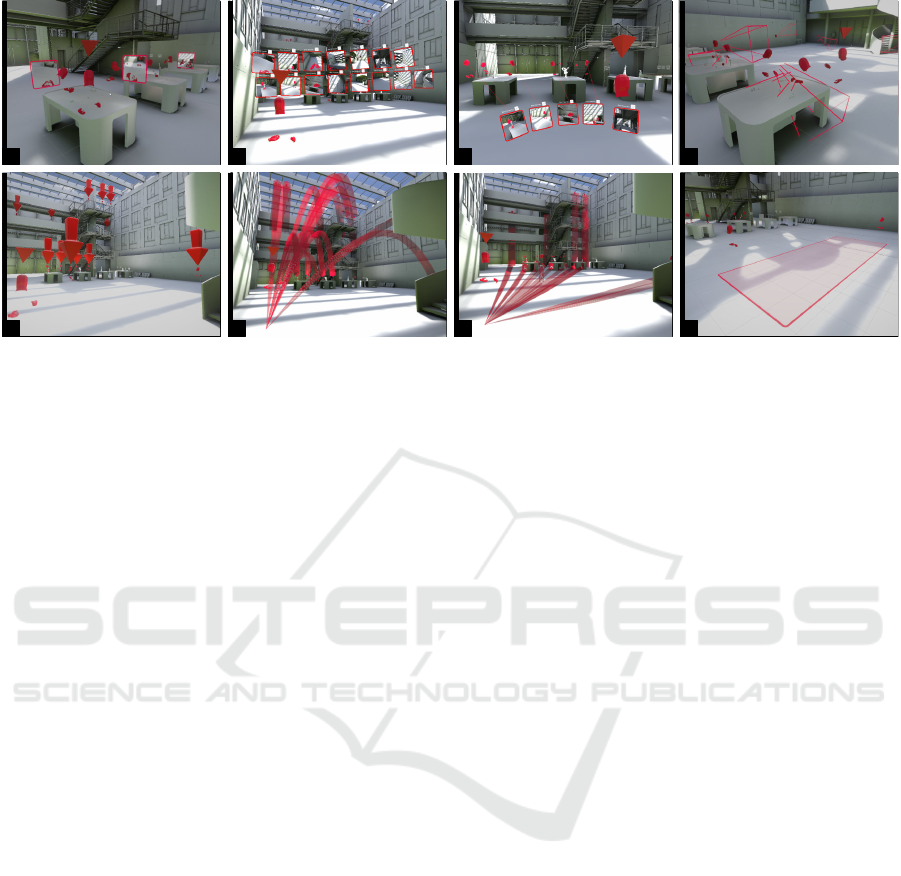
A B C D
E F G H
Figure 2: The screenshot of the proposed visitor engagement visualizations for displaying visitors’ detailed rendered views
placed in space embedded by the side of visitors (A), projected in front of the host (B and C), and a coarse view of visitors’
perspective with view frustums (D). Spatial locations of individual visitors with embedded giant arrows (E), visual links from
the host to visitors (F and G), and a coarse view of the spatial locations of a group of visitors (H).
To enhance the visibility of the views, we propose to
project visitors’ views onto a hemispherical surface
near the host for host-centric monitoring. Neverthe-
less, when dealing with numerous visitors, their views
can overlap. To address this, we also support the auto-
matic organization of the views into a grid, resulting
in a body-centric array of views (Ens and Irani, 2017)
(see Fig. 2 (B) and (C)).
4.1.2 Locating Individual Visitors
In Co-MUMR experiences, identifying a visitor’s lo-
cation is relatively simple when they are near the host,
but it becomes challenging when they interact with
scene elements lie beyond the host’s immediate field
of view (similar issue reported in (Hou et al., 2023;
Lin et al., 2023)). One option for indicating visitors’
locations in architectural Co-MUMR experiences is
to strengthen the visual appearance of visitors with
embedded visual cues. The ghosted views proposed
in (Kalkofen et al., 2013) would be helpful, but when
monitoring in large spaces, a larger and stronger vi-
sual cue is desired. Therefore, a giant arrow is de-
signed to appear above each visitor (as shown in Fig.
2 (E)). Another option is to show a visual link (sim-
ilar to (Prouzeau et al., 2019)) between visitors and
the host. Here we utilize spatial curves. We imple-
mented these curves to originate from a point fixed
in front of the host and extend toward the visitors’
heads. These curves gradually widen as the distance
from the host increases, enhancing its visibility when
viewed from a distance. The maximum width is con-
figurable. Besides, these curves are marked with an-
imated arrow patterns for directionality. The anima-
tion could serve as a visual guide to help hosts follow
the spatial curves. From the host’s perspective, each
curve uniquely identifies a visitor, enabling the host
to physically approach the visitor by following the
curve’s trajectory (as shown in Fig. 2 (F)). To reduce
visual clutter, this spatial curve can be configured to
be flattened on the floor (as shown in Fig. 2 (G)), and
visitors within a certain distance in the viewing range
can be excluded.
4.1.3 Overview of Visitor Spatial Locations
To help provide an overview of the visitors’ location,
we further propose an area indicator on the ground to
highlight the area and boundary of a group of visi-
tors. We implemented the area indicator in a square
shape, it dynamically shifts and adjusts its dimensions
in real time in response to the visitors’ movements. A
screenshot is shown in Fig. 2 (H).
4.2 Device Performance Visualization
Even when visitors are smoothly engaging with the
Co-MUMR system, due to the complexity and im-
mature nature of the technique, technical issues can
readily happen at any time. Hosts should be aware of
such issues immediately and be prepared to assist in
resolving any potential problems. During the expe-
riences, hosts can roughly know a headset’s tracking
status when a passthrough bubble around visitors is
shown (the case in (Schier et al., 2023)). However, de-
tails regarding the performance of individual devices,
especially the performance of the HMDs, including
the rendering efficiency, battery level, and tracking
accuracy, remain obscured.
Immersive in Situ Visualizations for Monitoring Architectural-Scale Multiuser MR Experiences
899
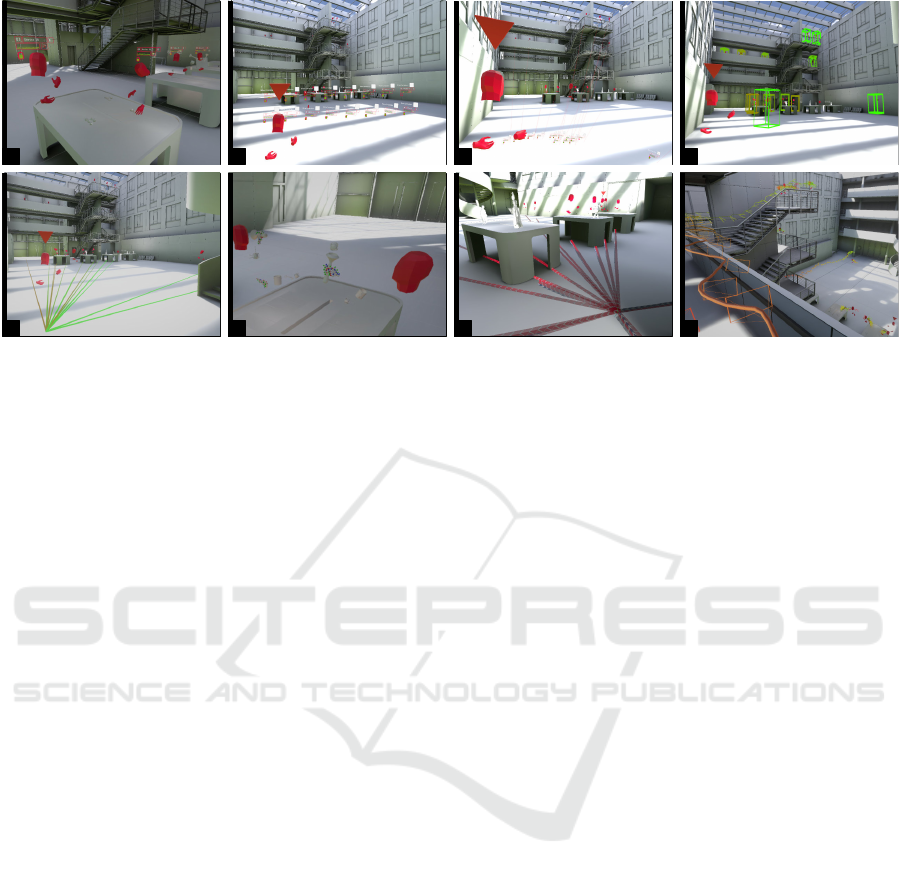
A B C D
E F G H
Figure 3: Screenshots of the visualizations for showing detailed performance metrics with information panel placed by side
of individual HMDs (A), projected in front of the host (B and C). Coarse overview of the performance by encoding into the
color of visitor bounding boxes (D) and visual links between visitors and the host (E). Hand tracking performance in (F) and
networking performance in (G). Device performance history alongside its spatial movement trajectory in (H).
4.2.1 Embedded Information Panel
The effectiveness of embedded in situ visualizations
has been demonstrated in the field of augmented real-
ity (Fleck et al., 2023). However, little work has been
dedicated to the visualization of HMD information in
co-located multiuser MR scenarios. An intuitive so-
lution is to show information panels. This panel is
designed to be oriented towards the host at all times
and display the status of visitors’ headsets to help vi-
sualize I2 (similar to the panel for displaying the AR
device’s status in (Cavallo and Forbes, 2019)). In
the current implementation, we offer two options to
show the information panels and allow hosts to con-
figure them freely to adapt to various situations under
various situations when hosting in large architectural
spaces. One option is to render the information panel
embedded atop visitors’ individual headsets as shown
in Fig. 3 (A). Another option is to render the panel
projected to the host in front at eye level or on the
floor (see Fig. 3 (B) and (C)). The embedded pan-
els are mainly designed for monitoring near visitors
while the projected panels are designed for monitor-
ing at a distance. In our system, real-time perfor-
mance data on individual HMDs such as the battery
life and rendering FPS, are collected on the visitors’
headsets and then transmitted to hosts in real time for
visualization.
4.2.2 Performance Overview with Visitor
Bounding Box and Color-Encoded Links
To provide an overview of the panel-based textual
representation when conveying HMD performance
information, we explore a stronger visual cue to help
hosts identify the performance issues. One option is
to show a bounding box-like frame (to avoid blocking
vision) and encode performance metrics in the color
around visitors. We currently implemented a color-
coded bounding box around visitors as an example. It
is shown in Fig. 3 (D). Another option is to show a
visual link between the host and the visitors. An ex-
ample is shown in Fig. 3 (E). We also refer to this
visualization as “FPS Lines” in this specific exam-
ple. The color of the bounding box and the visual link
transitions from green to red and reflects the real-time
frame rate value. Moreover, we note that additional
glyphs or potential metaphors could be considered as
alternatives and integrated into the system in the fu-
ture.
4.2.3 Head and Hand Tracking Visualization
In this work, we implemented the real-time data trans-
mission and visualization of live head and hand poses.
We utilized a polygonal virtual head to display the
head pose. For hand poses, we support the visualiza-
tion of detailed joint positions and coordinate axes, to
aid in debugging hand skeleton tracking (Fig. 3 (F)).
This visualization becomes especially useful when
superimposing it to the video see-through, which en-
ables direct comparison between the tracked hand
poses in the system and the real hand movement. In
the future, hand tracking issues could be detected and
aggregated over time into a visualization, aiding hosts
in diagnosing and debugging the system further.
4.2.4 Network Traffic Visualization
For certain experiences with media content streams in
the network, the visualization of the network band-
IVAPP 2025 - 16th International Conference on Information Visualization Theory and Applications
900
width as well as incoming and outgoing network
packages would help hosts identify the network bot-
tlenecks and other potential network issues. Similar
to (Rowden et al., 2023), this work visualizes network
data transmission within a 3D spatial context to help
further show I2. Distinctively, we employ 3D curves
that have specific start and end points corresponding
to the physical locations of devices in the environment
in situ. Those curves show arrow-like patterns in bi-
directional with certain widths and directions, and are
animated. The direction indicates the direction of data
transmission, the animation speed reflects the network
latency and the curve width depicts the network band-
width (see Fig. 3 (G)). We note that for this visualiza-
tion, we mainly focus on the visualization design and
prototyping, the real network data is not currently in-
tegrated.
4.2.5 Device Performance History
We propose a visualization of HMD performance his-
tory combined with its spatial movement history, rep-
resented as multivariate encoded trajectories in space,
assisting hosts in diagnosing issues related to device
performance. The spatial movement history com-
prises both positional movement and rotational move-
ment (relevant to view direction history), and is vi-
sualized as a spatial trajectory with mini-frustums
placed at specific intervals to indicate the visitor’s
view direction over time, similar to the camera tra-
jectories described in (Yu et al., 2023).
At the same time, the HMD performance history,
which includes metrics such as battery life, frame
rate, and CPU usage over time, is traced and can be vi-
sualized alongside the spatial movement trajectories.
They can be encoded into the texture or mapped onto
specific geometries along the trajectory. An example
is shown in Fig. 3 (H), where each trajectory repre-
sents an individual HMD, and the color of each seg-
ment of the trajectory reflects the corresponding ren-
dering framerate. In the current implementation, the
movement and performance data of all HMDs have
been traced since the system started. At a certain time,
hosts can request and visualize the cumulative data up
to that point.
4.3 System Event Visualization
4.3.1 Network and Tracking Loss Event
In the system, we monitor internet connection and
visitors’ positional tracking quality, emitting events
when there are status changes. This visualization
helps hosts recognize sudden offline events and iden-
tify their spatial patterns. A screenshot of two sudden
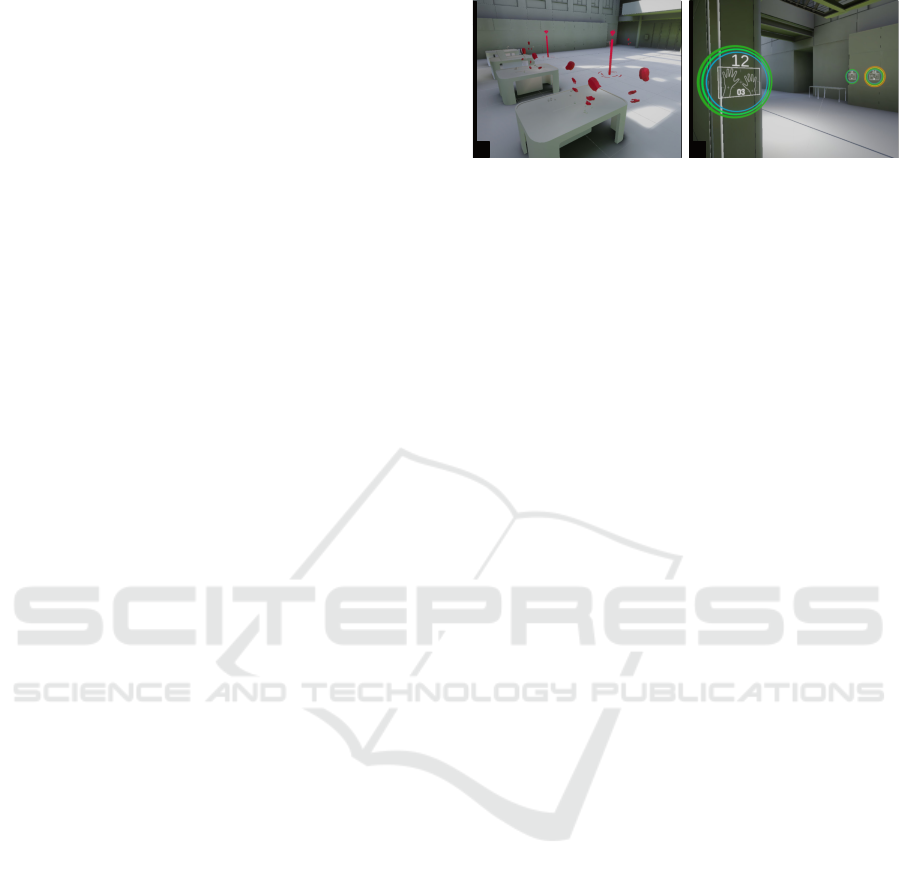
A B
Figure 4: Visualizations for showing system events: offline
events (A) and calibration events (B).
offline events is shown in Fig. 4 (A).
4.3.2 Calibration Event
As depicted in Fig. 4 (B), we accumulate the count
of calibration events and show this data by encircling
the calibration stations with color-coded circles. The
color transitions from blue to red from inner to outer
circles. The frequency of visitor calibration at a spe-
cific station is directly proportional to the number of
circles displayed around that station. This color cod-
ing aims to help hosts quickly discern the importance
of a calibration station from a distance with a glance.
The insights from this visualization can be used to
help guide hosts in optimizing the layout of calibra-
tion stations or virtual installations.
5 TECHNICAL DETAILS
We implemented our system based on an open-source
framework (Schier et al., 2023). Our system mainly
targets Meta Quest devices including Quest 2, 3, and
pro. All visualizations proposed in this work are im-
plemented and optimized for real-time rendering at 90
FPS in standalone mode on the device. The source
code is available on our project page. The 3D spatial
curves proposed (such as the ones proposed in section
4.1.2, 4.2.4, and 4.2.5) are rendered by Unity’s “VFX
Graph” with the “Particle Strips” block.
6 CONCLUSION AND FUTURE
WORK
In this paper, we proposed immersive in situ visual-
izations to help convey visitor information to hosts
in real time in architectural-scale multi-user experi-
ences. We developed methods to reduce visual clut-
ter by preventing overlapping visualizations when the
number of visual elements becomes excessive. Fur-
ther mechanisms could be introduced to address vi-
sual clutter in scenarios involving a large number of
visitors. This work designed visualizations to assist in
Immersive in Situ Visualizations for Monitoring Architectural-Scale Multiuser MR Experiences
901

visualizing visitor engagements. However, fully un-
derstanding these engagements poses a broader and
more complex challenge. Future designs could fo-
cus on providing deeper insights into the nature and
nuances of engagement information. With an in-
creasing number of visitors and larger spatial envi-
ronments, hosting becomes an even more challenging
task. Future designs and mechanisms could be devel-
oped to support more efficient and effective hosting
in such complex scenarios. For instance, a prioriti-
zation mechanism based on proximity and the sever-
ity of visitors’ needs could be introduced to enhance
the responsiveness and decision-making capabilities
of the hosts.
We tested the system function by delivering an ex-
emplary Co-MUMR puppet exhibition. A complete
evaluation study of the system’s functionality and the
effectiveness of the visualizations could be conducted
in future work. Additionally, an investigation into bal-
ancing the reduction of visual clutter against the risk
of increased information loss could be conducted to
guide further refinement.
ACKNOWLEDGEMENTS
This project is funded by the European Union and co-
financed from tax revenues on the basis of the budget
adopted by the Saxon State Parliament (Project No.
100690214).
REFERENCES
Cavallo, M. and Forbes, A. G. (2019). CAVE-AR: A VR
authoring system to interactively design, simulate, and
debug multi-user AR experiences. In 2019 IEEE Con-
ference on Virtual Reality and 3D User Interfaces
(VR), pages 872–873. IEEE.
Ens, B. and Irani, P. (2017). Spatial Analytic Inter-
faces: Spatial User Interfaces for In Situ Visual An-
alytics. IEEE Computer Graphics and Applications,
37(2):66–79.
Fleck, P., Calepso, A. S., Hubenschmid, S., Sedlmair, M.,
and Schmalstieg, D. (2023). Ragrug: A toolkit for
situated analytics. IEEE Transactions on Visualization
and Computer Graphics, 29(7):3281–3297.
Guo, Z., Wang, H., Deng, H., Xu, W., Baghaei, N., Lo,
C.-H., and Liang, H.-N. (2024). Breaking the isola-
tion: Exploring the impact of passthrough in shared
spaces on player performance and experience in VR
exergames. pages 1–11. Conference Name: IEEE
Transactions on Visualization and Computer Graph-
ics.
Hou, Z., Xia, Q., Xu, Z., and Tang, Y. (2023). Arradar:
Arrow and radar driven hmd-based visual guidance
in limited field-of-view. In 2023 IEEE International
Symposium on Mixed and Augmented Reality Adjunct
(ISMAR-Adjunct), pages 444–449.
Kalkofen, D., Veas, E., Zollmann, S., Steinberger, M., and
Schmalstieg, D. (2013). Adaptive ghosted views for
augmented reality. In 2013 IEEE International Sym-
posium on Mixed and Augmented Reality (ISMAR),
pages 1–9.
Lin, T., Yang, Y., Beyer, J., and Pfister, H. (2023). Labeling
out-of-view objects in immersive analytics to support
situated visual searching. IEEE Transactions on Visu-
alization and Computer Graphics, 29(3):1831–1844.
Milgram, P., Takemura, H., Utsumi, A., and Kishino, F.
(1995). Augmented reality: a class of displays on the
reality-virtuality continuum. In Das, H., editor, Tele-
manipulator and Telepresence Technologies, volume
2351, pages 282 – 292. International Society for Op-
tics and Photonics, SPIE.
Prouzeau, A., Lhuillier, A., Ens, B., Weiskopf, D., and
Dwyer, T. (2019). Visual Link Routing in Immer-
sive Visualisations. In Proceedings of the 2019 ACM
International Conference on Interactive Surfaces and
Spaces, pages 241–253, Daejeon Republic of Korea.
ACM.
Rowden, A., Krokos, E., Whitley, K., and Varshney, A.
(2023). Exploring effective immersive approaches to
visualizing wifi. In 2023 IEEE International Sym-
posium on Mixed and Augmented Reality (ISMAR),
pages 732–740, Los Alamitos, CA, USA. IEEE Com-
puter Society.
Schier, F., Zeidler, D., Chandran, K., Yu, Z., and McGin-
ity, M. (2023). Viewr: Architectural-scale multi-
user mixed reality with mobile head-mounted dis-
plays. IEEE Transactions on Visualization and Com-
puter Graphics, pages 1–14.
Thanyadit, S., Punpongsanon, P., and Pong, T.-C. (2019).
Observar: Visualization system for observing virtual
reality users using augmented reality. In 2019 IEEE
International Symposium on Mixed and Augmented
Reality (ISMAR), pages 258–268.
Wang, C.-H., Tsai, C.-E., Yong, S., and Chan, L. (2020).
Slice of light: Transparent and integrative transition
among realities in a multi-hmd-user environment. In
Proceedings of the 33rd Annual ACM Symposium on
User Interface Software and Technology, UIST ’20,
page 805–817, New York, NY, USA. Association for
Computing Machinery.
Willett, W., Jansen, Y., and Dragicevic, P. (2017). Embed-
ded data representations. IEEE Transactions on Visu-
alization and Computer Graphics, 23(1):461–470.
Yoo, D., Kantengwa, O., Logler, N., Interayamahanga, R.,
Nkurunziza, J., and Friedman, B. (2018). Collabora-
tive reflection: A practice for enriching research part-
nerships spanning culture, discipline, and time. In
Proceedings of the 2018 CHI Conference on Human
Factors in Computing Systems, CHI ’18, page 1–11,
New York, NY, USA. Association for Computing Ma-
chinery.
Yu, Z., Zeidler, D., Victor, V., and Mcginity, M. (2023). Dy-
nascape: Immersive authoring of real-world dynamic
scenes with spatially tracked rgb-d videos. In Pro-
ceedings of the 29th ACM Symposium on Virtual Re-
ality Software and Technology, VRST ’23, New York,
NY, USA. Association for Computing Machinery.
IVAPP 2025 - 16th International Conference on Information Visualization Theory and Applications
902
