
Generating Accessibility: Using AI to Improve Higher Education for the
Visually Impaired
Sophie Schauer
a
, Katharina Simbeck
b
and Leon Sch
¨
ußler
c
School of Computing, Communication and Business, HTW University of Applied Sciences Berlin,
Wilhelminenhofstraße, Berlin, Germany
Keywords:
AI for Good, Inclusive Higher Education, Accessibility.
Abstract:
Visually impaired students face many obstacles in higher education, including access to adapted course ma-
terial. While accessibility is a legal requirement in many countries, its implementation is linked to practical
challenges for educators. In this paper, we discuss the adaptation of existing course materials for blind stu-
dents in a case study and propose using generative Artificial Intelligence to facilitate the creation of accessible
educational materials, contributing to a more inclusive learning environment. We introduce and evaluate the
tool TRAIL to generate accessible textual descriptions of lecture slides.
1 INTRODUCTION
In higher education, visually impaired students en-
counter barriers that hinder their access to and intake
of information (Croft, 2020). These challenges, rang-
ing from inaccessible materials to barriers in content
delivery, highlight the need for innovative solutions
to promote inclusive education (Firat, 2021). Arti-
ficial intelligence (AI) brings an opportunity to ad-
dress these barriers and redefine the educational ex-
periences of visually impaired students (Mohamady
et al., 2023).
Visual impairment generally denotes a spectrum
of reduced vision, ranging from mild to severe, where
individuals may benefit from visual aids or adapta-
tions (Kim et al., 2021). Blindness, on the other hand,
implies a total loss of vision, often necessitating al-
ternative means of learning and interacting with the
environment, such as braille, auditory cues or assis-
tive technology in the form of screen readers. Screen
readers read content from a computer screen to the
user for them to comprehend written text as well as
graphical visualisations (Sharif et al., 2021). Recog-
nising these distinctions is essential for tailoring sup-
port and accommodations to meet the specific needs
of individuals along the spectrum of visual challenges
(Permvattana et al., 2013).
However, inaccessible documents are only part of
a
https://orcid.org/0009-0006-3350-7803
b
https://orcid.org/0000-0001-6792-461X
c
https://orcid.org/0009-0003-4126-3392
the problem. Accessible higher education extends
beyond providing accessible documents but also in-
cludes accessible campus facilities and external finan-
cial support. Environmental barriers, such as access
to campus or inadequate accommodations, add to the
obstacles they encounter (Bishop and Rhind, 2011).
The paper’s focus narrows down to the challenges sur-
rounding accessible documents for visually impaired
individuals and brings attention to existing barriers.
As Kim et al. (2021) argue, there is a need for
scalable, low-cost methods for making documents
with visualisations accessible.
This paper explores the possibilities of ”generat-
ing accessibility” and finds innovative strategies and
technologies to allow visually impaired students to
navigate educational contexts with greater autonomy.
Generative AI refers to technologies that generate im-
ages, videos, sounds or, in our case, texts based on
models learned from high volumes of training data.
Generative AI has the potential to mitigate accessibil-
ity challenges by changing how educational content
is created, adapted and delivered (Leiker et al., 2023).
The inclusivity and accessibility for visually impaired
students are discussed, beginning with fundamental
principles of the right to accessibility and the current
need for accessibility in educational settings. Inclu-
sivity should not be viewed as an additional consid-
eration but as an integral part of the initial solution.
Embracing inclusivity from the start ensures that di-
verse needs are inherently addressed, regardless of
background or ability (Heyer, 2021).
Schauer, S., Simbeck, K. and Schüßler, L.
Generating Accessibility: Using AI to Improve Higher Education for the Visually Impaired.
DOI: 10.5220/0013136300003932
In Proceedings of the 17th International Conference on Computer Supported Education (CSEDU 2025) - Volume 1, pages 15-25
ISBN: 978-989-758-746-7; ISSN: 2184-5026
Copyright © 2025 by Paper published under CC license (CC BY-NC-ND 4.0)
15

To provide a practical context, the paper presents
a prototype developed for parsing inaccessible docu-
ments into a screen-readable format. Ultimately, our
study contributes to the discourse on enhancing acces-
sibility in education. It advocates for integrating AI
as a tool to empower visually impaired students with
equitable access to educational resources, as well as
giving lecturers a tool for producing accessible mate-
rial.
2 ACCESSIBILITY IN HIGHER
EDUCATION
2.1 Right to Accessibility
The right to inclusive education is recognised as a
human right, particularly for people with disabilities.
The United Nations Convention on the Rights of Per-
sons with Disabilities (CRPD) from 2006 mandates
an inclusive education system at all levels, emphasis-
ing the importance of learning together regardless of
different learning styles and rates (United Nations, n
d). In Article 24 on education in the CRPD, the right
of persons with disabilities to education is outlined,
highlighting the principles of non-discrimination and
equal opportunity. The article calls for the establish-
ment of inclusive education systems at all levels with
a focus on the full development of human potential,
respect for human rights and effective participation in
society. Individuals with disabilities should not be ex-
cluded from the general education system based on
their disability. It further addresses specific measures
for academic and social development, such as the fa-
cilitation of learning braille, alternative communica-
tion modes and sign language with qualified teachers
and professionals (United Nations, n d).
The CRPD shifts with Article 24 towards inclu-
sion in response to the history of segregation and
marginalisation of students with disabilities, to op-
pose discriminatory attitudes and to create an inclu-
sive society. However, there is a significant gap be-
tween the aspiration of the CRPD and the global real-
ity of exclusion that many students with disabilities
are still facing (Heyer, 2021). Rethinking the pur-
pose of education and rebuilding education systems is
necessary to emphasise diversity as a positive aspect
(De Beco, 2014).
2.2 Accessibility for Visually Impaired
Students
The need for accessibility and inclusion in education
for visually impaired students originates from the fun-
damental principles of ensuring equal rights and op-
portunities for people with disabilities, as stated in the
United Nations CRPD (MacKay, 2006). The conven-
tion recognises the importance ”to promote, protect
and ensure the full and equal enjoyment of all human
rights and fundamental freedoms by all persons with
disabilities, and to promote respect for their inherent
dignity.”
Any limitations in accessibility to education for
visually impaired students imply barriers to their in-
clusion and participation in society and everyday life.
Barriers that visually impaired students face when en-
rolling at university can be grouped into four cate-
gories: attitudinal, institutional, environmental and
physical (Hutchinson et al., 1998). Attitudinal re-
lates ”to the attitudes of key individuals with whom
a visually impaired student will interact” (Bishop and
Rhind, 2011). Individuals, such as parents and insti-
tutional staff, play an important role in the academic
journey of visually impaired students, and their atti-
tudes can significantly shape the student’s experience
and development in higher education. Institutional
barriers refer to the accessibility of educational re-
sources and materials. Further, environmental factors
can include access to buildings, classrooms and ac-
commodation, which can be overcome through lifts,
automatic doors, appropriate signs and assistive tech-
nology. Physical challenges, such as headaches and
tiredness after learning periods, must be managed by
the students themselves (Bishop and Rhind, 2011).
Educating staff members is necessary to best sup-
port students with visual impairments, including clear
communication of the student’s disability and provi-
sion of adequate materials (Bishop and Rhind, 2011).
Similar findings are backed up by (Giese et al., 2022).
They state that most barriers for students with vi-
sual impairments stem from a lack of qualified teach-
ers and inaccessible learning materials as a result
of short-term lesson planning. Thurston (2014) ad-
vocates for developing ”visually impaired literacy
skills” that would allow real-time access to educa-
tional material for inclusive learning and teaching
(Thurston, 2014).
Incorporating information and communication
technology can help students with visual impairments
access information independently and foster the de-
velopment of new skills at a similar pace as students
without disabilities. Bradea and Bl
ˆ
adel (2017) stud-
ied the training level and attitude of teachers toward
CSEDU 2025 - 17th International Conference on Computer Supported Education
16

using ICT for educational purposes for increased ac-
cessibility. Their research focused on students in Ro-
mania and found that the majority of teachers lacked
the required skills and knowledge on how to use or
adapt educational software to the scholar curriculum
for visually impaired students. Their result showed
that only 3% of interviewed teachers believed to have
high-level skills to support school inclusion of stu-
dents with visual impairments.
Vanderheiden (2008) coined the term ”ubiquitous
accessibility” to describe the ability of people with
disabilities to access and use the same mainstream
technologies. In this context, the concept of ”plug-
gable interfaces” for computing devices is introduced.
Pluggable interfaces adapt to a user’s disability and
are adjusted to the user’s profile, interaction history
and the specific kind of disability. A study found
that the goal of ubiquitous accessibility can only be
achieved through consistent screen reading experi-
ences across different devices, applications and op-
erating systems (Billah et al., 2017).
A comprehensive study review investigated fac-
tors for the academic success of students with vi-
sual impairments (Simui et al., 2018). Challenges
were identified in inflexible time constraints for as-
sessments, insufficient availability of adaptive tech-
nologies, technical issues with e-learning platforms,
difficulties connecting to websites and course man-
agement systems and improper use of e-learning tools
by lecturers. Problems that the students mentioned
were incomplete online course notes, delay of mate-
rial provision on the website and pacing of in-class
presentation (Fichten et al., 2009). Consequently, stu-
dents with visual impairments are less likely to attend
courses in higher education (Athanasios et al., 2009).
Factors for success emerging from a study were a pos-
itive attitude, self-advocacy and inventiveness (Simui
et al., 2018).
2.3 Accessibility of Documents Used in
Higher Education
Students with visual impairments use assistive tech-
nology to navigate educational material. While fully
blind students might use screen or braille readers to
narrate on-screen text, those with low vision can use
magnifying software to enlarge documents. Graphi-
cal material, particularly diagrams, images and visual
cues, on the other hand, are often more difficult or im-
possible to access (Armstrong and Murray, 2007). In
many disciplines, these kinds of materials, however,
make up an integral part of the studies. It has been
discovered that in response, vision-impaired students
skip graphical material and ultimately are less likely
to enrol in STEM disciplines in comparison to arts
and humanities (Butler et al., 2017).
Visualisations are used frequently in higher edu-
cational classes to communicate concepts, create va-
riety in study materials and help students keep and
regain attention during learning (Naps et al., 2002).
Visualisations can play a major role in education
to help students create mental models of scientific
concepts(Rapp, 2005; Vavra et al., 2011), course
content or learning progress (Tervakari et al., 2014;
Vieira et al., 2018). In biology, they help stu-
dents understand structures on a cellular and sub-
cellular level that cannot be observed without mi-
croscopes (Jenkinson, 2018). In chemistry, under-
standing of atomic or molecular structures can be en-
hanced using visualisations, experimental set-ups are
communicated in sketches, experimental data is plot-
ted, and simulations help understand molecular pro-
cesses (Jones et al., 2005; Burewicz and Miranow-
icz, 2002). In computer science education, visualisa-
tions to illustrate algorithms or data structures (Naps
et al., 2002; Fouh et al., 2012). Educational visu-
alisations fulfil several functions (Jenkinson, 2018),
such as schematic representations that point students
to the central concepts to be understood, diagrams
that display data, and flow schemes that describe
dynamic processes and temporal order. However,
even learners without visual impairments sometimes
lack visual literacy to correctly interpret scientific im-
ages and understand spatial and temporal dependen-
cies (Jenkinson, 2018; Jones et al., 2005). Visual-
isations can also replace educational experiments if
those are too costly, time-consuming or dangerous to
be executed in classrooms (Burewicz and Miranow-
icz, 2002). Several researchers thus argue that educa-
tional visualisation needs to be accompanied by tex-
tual explanations to help learners interpret the images
and understand the underlying concepts (Vavra et al.,
2011; Naps et al., 2002). Beyond education, domain-
specific visualisations are commonly used, especially
in the natural sciences, to communicate data or exper-
imental results.
Three main methods for making graphical ma-
terial accessible to visually impaired students were
identified: enlargement, description and tactile graph-
ics (Butler et al., 2017). Depending on the student’s
level of vision impairment, enlarging graphics might
not be sufficient. While descriptions give students
a general idea, creating an accurate mental model
of layout and content is difficult. Tactile graphics
provide students with haptic drawings through raised
lines. However, this requires financial resources, time
and tactile reading skills from the student (Butler
et al., 2017).
Generating Accessibility: Using AI to Improve Higher Education for the Visually Impaired
17

To provide equal opportunities to visually im-
paired students, visualisations used in class need to be
either described textually or provided as haptic expe-
riences (Jones et al., 2006; Jung et al., 2021). Alterna-
tive text for educational visualisations should enable
visually impaired learners to form visual mental mod-
els (Jung et al., 2021). Visually impaired users of alt
texts to diagrams emphasised the need for a clear de-
scription of chart type, axes including range and data
trend (Jung et al., 2021). They also preferred to learn
about the colours used and longer texts and complete
texts over shorter texts.
The need for accessible scientific PDF files was
addressed in a study (Wang et al., 2021). Scientific
papers in PDF format are often unusable on screen
readers and, therefore, inaccessible to visually im-
paired students. SciA11y was proposed as a solution
for extracting and rendering semantic content of PDFs
as an accessible HTML document (Wang et al., 2021).
There is a large number of recommendations for
accessible documents (Kim et al., 2021; Jung et al.,
2021).
Alongside graphical material, the document lay-
out can pose accessibility barriers to students with
visual impairments when using assistive technology.
New approaches have been tested with added spatial
information and extra metadata, including informa-
tion regarding the visual structure. As Moured et al.
(2023) state, AI-based image-processing technologies
can format accessible content automatically through
the extraction and analysis of pixel information. They
developed and evaluated a 2D interface for tactile dis-
plays that uses an annotated data set and real-time ob-
ject detection. Users could ”arrange a suitable reading
order based on their needs” and make the overall pro-
cess of creating an accessible document lightweight
and time-efficient.
Three key criteria need to be met for making doc-
uments and presentations accessible: an appropriate
reading order, alternative text for non-text objects and
grouping of related graphical objects (Ishihara et al.,
2006). Further, decorative elements commonly found
on presentation slides must be appropriately marked
for exclusion by screen-reading software. These men-
tioned guidelines and requirements can easily be in-
tegrated using standard software platforms, such as
PowerPoint.
The German Association of the Blind and Visually
Impaired in Study and Work has released a guide for
the creation of accessible PowerPoint presentations.
They highlight the importance of using predefined
slide layouts that let users of screen readers navigate
through text and graphics. They further stress the us-
age of titles for each slide since they indicate the most
important point of orientation for screen readers. Ad-
ditionally, they advise using alternative text for com-
plex tables in which the key message is mentioned
(DBSV e. V., n d).
3 METHODOLOGY
The enrolment of a student with total blindness in a
business computing bachelor’s degree program un-
veiled a critical need to assess and improve the ac-
cessibility of educational materials. This revela-
tion prompted the conduction of a case study to de-
crease the barriers to accessibility in higher education,
specifically of existing documents. It focused particu-
larly on the documents’ compatibility with commonly
used screen readers and the development of an AI tool
that parses documents into an accessible format.
Our approach to the case study involved three
main steps in a participatory design process:
1. Material Assessment. The first phase entailed a
detailed examination of the existing educational
content. This review aimed to understand how
these materials interacted with screen readers and
identify areas of incompatibility or difficulty.
2. Technology Integration. In response to the chal-
lenges identified, we explored AI-based solutions,
particularly those leveraging generative AI mod-
els. This step involved assessing the potential of
these technologies to create more accessible ver-
sions of educational content tailored to the needs
of visually impaired students.
3. Evaluation. The prototype was iteratively refined
with human oversight for validation, prompt en-
gineering to enhance the AI response consistency
and user feedback from visually impaired individ-
uals to assess usability and identify areas for im-
provement.
The following chapter will detail how the material
was assessed, and the findings were translated into the
development and deployment of the AI tool.
4 IMPLEMENTATION
4.1 Material Assessment
In the business computing program in question, stu-
dents are typically provided with lecture notes, usu-
ally slides, in PDF format. Lecturers also use stan-
dard software such as integrated development envi-
ronments in programming courses, the enterprise re-
source planning (ERP) software SAP and the statistics
CSEDU 2025 - 17th International Conference on Computer Supported Education
18
package R. A first analysis revealed that the standard
software solutions were found to be accessible, but
not the lecture notes.
Lecturers in the bachelor’s degree program in
business computing were interviewed about the use
of domain-specific visualisations. As a result, sev-
eral diagram types were identified as relevant for
business computing studies. In software engineer-
ing and object-oriented programming courses, class
diagrams are used to visualise relationships between
classes as well as their functions and attributes using
the widely established Unified Modelling Language
(UML). Business process model notation (BPMN) di-
agrams depict the flow of events and activities in busi-
ness processes. In several classes, graphical represen-
tations of functions are used, such as the linear cost
function in cost accounting or linear regression func-
tions in statistics.
As UML diagrams can be viewed as a hierarchical
representation of textual elements, they can be made
accessible to blind students more easily. BPMN di-
agrams, however, contain a variety of symbols with
different meanings, elements are ordered in so-called
”swim lanes” to represent sub-organisational areas of
responsibility, while the arrangement of elements rep-
resents the order of process flow. As BPMN diagrams
are a major tool in business computing and are more
difficult to describe textually, the study program used
tactile printing for an exemplary BMPN diagram.
To assess the current state of accessibility in the
presentations and documents used at our institution,
we initially tested an exemplary presentation slide
(Figure 1) in both the open-source software PAVE
and closed-source software Eye-Able for evaluation.
These applications are designed to analyse PDF struc-
tures, identifying key elements such as alternative
texts for images, logical structural trees that dictate
reading order and the marking of non-essential ele-
ments as decorative.
The analysis revealed a significant deficit in ac-
cessibility: a majority of the educational materials
utilised were almost entirely inaccessible for screen
readers and, therefore, for blind students. Many tables
were saved as graphics and code snippets or mathe-
matical formulas were inserted as screenshots instead
of markdown or LaTeX. In addition, even if diagrams
or plain text were readable with a screen reader, the
missing structure meant they were not easily com-
prehensible or otherwise made navigation difficult for
screen readers. Lecturers also used unreadable graph-
ics to transfer information. For example, the course
structure, deadlines and grading criteria could have
been presented tabularly. We primarily attributed this
to the lack of consideration for the key elements dur-
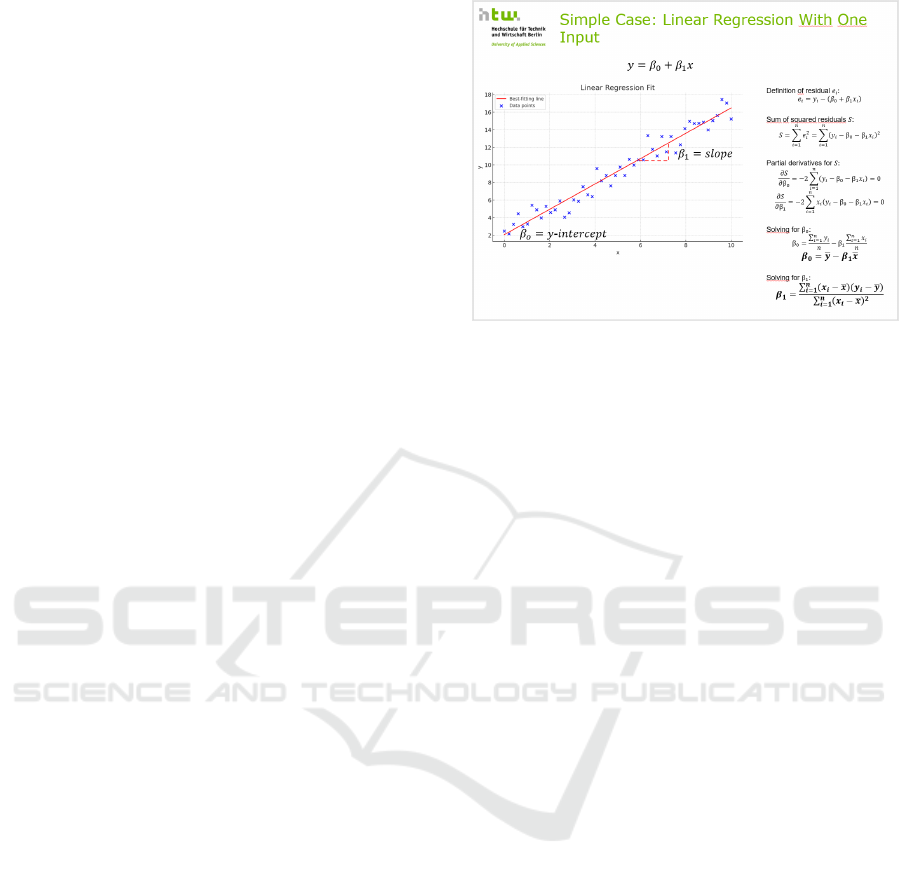
Figure 1: This exemplary slide showcases a Linear Regres-
sion graph with relevant formulas on the right side. The
graphic contains decorative elements, a graph and formulas
for intelligibility. For screen reader users, neither the read-
ing order nor the difference between decorative elements
and those for comprehensibility is clear.
ing the initial creation of the documents, namely an
appropriate reading order, alternative text and group-
ing of related graphical objects.
The lecturers were surprised to learn that not only
slides with visualisations were unusable for the blind
student but also slides with mainly textual elements
that only made sense with a specific reading order.
While a typical course often provided hundreds of
slides as lecture notes, the material used only in the
six courses of the first semester added up to dozens
of documents with hundreds of pages. The lack of at-
tention to accessibility during course creation led to
the need to quickly improve the accessibility of many
documents created iteratively over several years.
To solve these deficits, initially, Microsoft Pow-
erPoint’s built-in accessibility tab was considered to
provide a list of images without alternative texts
where a structure or reading sequence was missing
or where elements were not marked as decorative.
Despite its limitations, the built-in suggestions indi-
cated that manually making the material accessible
would require significant time. It became apparent
that recreating the material entirely while incorporat-
ing key accessibility principles from the outset would
be more time-efficient. This led to the question of how
the pre-existing course materials could be adapted and
made available to blind students quickly.
The main requirements for the envisioned solution
were:
• Automatically provide textual representations of
existing course material in PDF format
• Create well-structured texts with references to
original slides (heading, slide number)
Generating Accessibility: Using AI to Improve Higher Education for the Visually Impaired
19

• Handle different types of visualisations
4.2 Technology Integration
Machine learning approaches have made documents
accessible to visually impaired and blind users. Choi
et al. (2019) built a browser extension using deep
learning technology to provide textual descriptions of
charts, including chart type and data tables. Lundgard
and Satyanarayan (2021) propose a four-level seman-
tic model for the usefulness of descriptions generated
using natural language processing (NLP).
To meet the requirements described in the previ-
ous section, the use of large language models (LLMs),
specifically the generative pre-trained transformers
(GPT) provided by OpenAI, was explored to pro-
cess these documents and generate screen-reader-
accessible alternative texts in a separate file. While
this approach is fast and scalable, there are several
challenges:
1. Accurate Text Generation. The LLM must ac-
curately interpret and convert the content of the
original document into alternative text. This in-
cludes not just the textual content but also the cor-
rect and complete interpretation of charts, graphs
and other non-textual elements.
2. Contextual Understanding. The LLM should
not lose the document’s context and subject matter
in the generation process. This is crucial for en-
suring that the alternative text accurately reflects
the intended message and information of the orig-
inal content.
3. Avoid Hallucinations: The LLM must not make
up content not part of the document.
4. Built for Use with Screen Readers. The alterna-
tive text needs to be optimised for screen reader
software. This involves structuring the text in
an easily navigable and understandable way when
read aloud by these tools.
The output format of choice is HTML to ensure
compatibility with screen readers. This format fa-
cilitates the creation of a structured reading experi-
ence through language, header, and paragraph tags.
Such structures allow visually impaired students to ef-
ficiently navigate the document using a screen reader,
particularly if sections are demarcated with descrip-
tive headers. For instance, a header using the <h1>-
Tag like ”Sequential Diagrams” is markedly more in-
formative than a vague designation such as ”Page 2”.
The tool was implemented as a web application using
the Flask framework, Python and the OpenAI GPT-
API.
The PDF documents were handled using the
libraries PyPDF2 and pdf2image. PyPDF2’s
PdfReader class was instrumental in reading and
manipulating the content of PDF files. Meanwhile,
pdf2image allowed the conversion of PDF pages into
images—a crucial step in processing the documents
for the intended use case.
The proof-of-concept prototype TRAIL
1
inte-
grates the GPT-4 Vision API to process images of the
PDF slides. The Vision API is parameterised for low
temperature to moderate the creativity level of GPT-4
during the generation process, ensuring the produced
text remains closely aligned with the content and con-
text of the original PDF document. The generated text
is then compiled into an HTML document, optimised
for compatibility with screen readers.
Specifically, the prototype disassembles the PDF,
segregating each page into an individual image. Sub-
sequently, each image is processed through the GPT-4
Vision API with a prompt to generate a detailed al-
ternative text and an appropriate title for each page.
Upon process completion, these responses are me-
thodically assembled into an HTML document. This
document is structured with a distinct header, repre-
senting each page of the original PDF, followed by the
corresponding alternative text for the page as a para-
graph, enhancing the navigability and accessibility of
the content for visually impaired users. Mathemati-
cal formulas are written as LaTeX in the HTML file
for correct parsing by screen readers. The processed
HTML text for the exemplary slide from Fig. 1 is
shown in Fig. 2, followed by the final LaTeX result.
Resulting LaTeX
The slide is titled ”Simple
Case: Linear Regression With One Input” and
is divided into two sections. On the left, there
is a scatter plot with the x-axis labelled as ’x’
and the y-axis labelled as ’y’. The plot shows
numerous data points marked with blue ’x’ sym-
bols. A red dashed line passes through the data
points, indicating the best-fitting line for the lin-
ear regression. Two annotations on the graph in-
clude ”β
0
= y-intercept” at the point where the
line crosses the y-axis and ”β
1
= slope” along
the line, indicating the slope of the best-fitting
line. The linear regression model is given by
y = β
0
+ β
1
x.
On the right side of the slide, there are sev-
eral mathematical equations and definitions re-
lated to linear regression. The definition of
residual e
i
is provided as e
i
= y
i
− (β
0
+ β
1
x
i
).
The sum of squared residuals S is defined as S =
1
https://github.com/AltarisV/TRAIL-PDF
CSEDU 2025 - 17th International Conference on Computer Supported Education
20
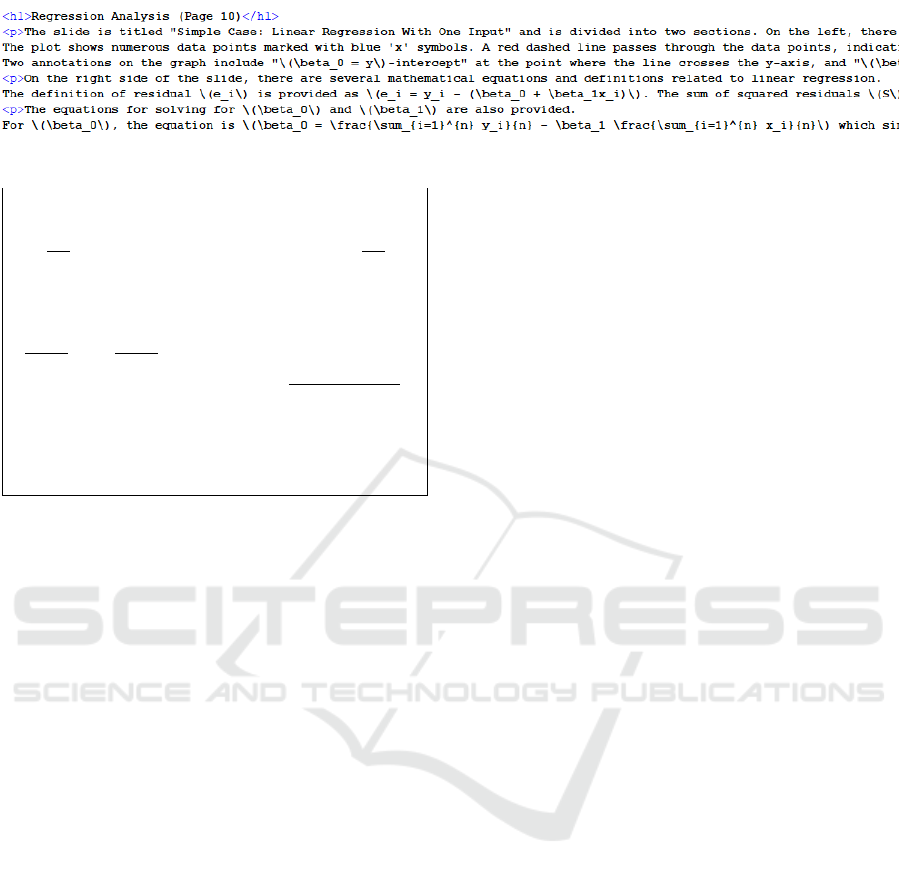
Figure 2: HTML text for the slide shown in Fig. 1 generated with TRAIL.
∑
n
i=1
e
2
i
=
∑
n
i=1
(y
i
− β
0
− β
1
x
i
)
2
. Partial deriva-
tives for S with respect to β
0
and β
1
are given
as
∂S
∂β
0
= −2
∑
n
i=1
(y
i
− β
0
− β
1
x
i
) = 0 and
∂S
∂β
1
=
−2
∑
n
i=1
x
i
(y
i
− β
0
− β
1
x
i
) = 0, respectively.
The equations for solving for β
0
and β
1
are
also provided. For β
0
, the equation is β
0
=
∑
n
i=1
y
i
n
− β
1
∑
n
i=1
x
i
n
which simplifies to β
0
= ¯y −
β
1
¯x. For β
1
, the equation is β
1
=
∑
n
i=1
(x
i
− ¯x)(y
i
− ¯y)
∑
n
i=1
(x
i
− ¯x)
2
,
where ¯x and ¯y represent the mean values of x and
y, respectively.
Figure 3: LaTeX for the slide shown in Fig. 1 gener-
ated with TRAIL
5 EVALUATION
The evaluation process focused on the effectiveness of
GPT-4 for rendering educational materials in accessi-
ble formats. The approach was guided by iterative re-
finement and critical examination of the AI-generated
outputs and consisted of a few main focus points:
1. Human Oversight. Human oversight was a vi-
tal part of the evaluation process to validate AI-
generated outputs and correct significant errors.
This step was essential in ensuring the quality and
accuracy of the final accessible documents.
2. Prompt Engineering. The evaluation also fo-
cused on refining prompt engineering techniques
to enhance the consistency and relevance of AI re-
sponses. We experimented with different prompt
structures and formulations to optimise the AI’s
performance.
3. User Feedback. We gathered feedback from end-
users, including lecturers and a blind student, to
assess the usability and understandability of the
produced accessible documents. This input was
crucial in identifying areas for improvement and
validating AI technologies in educational settings.
The tool underwent the testing and evaluation pro-
cess using a variety of slides sourced from business
computing classes. The interpretation was possi-
ble for conventional text slides and worked also for
mathematical formulas and LaTeX expression. How-
ever, the technology had errors distinguishing relevant
from irrelevant content, making human oversight nec-
essary. The requirement for manual intervention to
correct significant errors, such as incorrect semantic
interpretations or inaccuracies in graph descriptions,
remains paramount. Notably, the frequency and na-
ture of these errors depend on the input material’s
quality, with common challenges arising from low-
resolution images or misinterpreting fine details in di-
agrams used in the slides.
An illustrative instance of this was observed dur-
ing our experiments with an image of quadratic equa-
tions employing the quadratic formula, a concept
prevalent in German-speaking regions, titled ”PQ-
Formel”. The AI’s response to the GPT-API accu-
rately recognised the formula’s application in solving
quadratic equations. However, the generated LaTeX
code for the formulas was erroneous. Once we re-
moved the title ”PQ-Formel” from the image, we got
flawless explanations and LaTeX generation, albeit
without any reference to the quadratic formula.
A second step was iteratively testing the tool with
the blind student, which played a pivotal role in re-
fining its effectiveness and accessibility. Immediate
implementation of the feedback from the blind stu-
dent was crucial to enhance the tool’s performance
and address usability concerns specific to visually im-
paired users. This process identified areas for im-
provement and made necessary adjustments to ensure
that the tool could accurately interpret and present ed-
ucational content in an accessible format.
Furthermore, an integral aspect of the evaluation
methodology was the process of prompt engineering,
which played a crucial role in reducing randomness
and minimising errors in the responses generated by
the GPT-API. Extensive experimentation with differ-
ent structures and phrasings of prompts revealed sig-
nificant variations in the results. These differences
were often attributed to subtle changes or omitting
certain prompt words.
For instance, the prompt snippet ”short and pre-
cise alternative text” was interpreted literally by the
GPT model, typically yielding brief descriptions, of-
ten just one to two sentences long, for complex dia-
grams. However, modifying the snippet to ”precise
Generating Accessibility: Using AI to Improve Higher Education for the Visually Impaired
21

alternative text” resulted in more comprehensive and
clearer responses. This alteration also helped elimi-
nate the tendency for extraneous elaboration, encoun-
tered in earlier tests with different formulations.
To further streamline the consistency of the AI re-
sponses, the GPT-API’s temperature setting was ad-
justed to 0.2. This modification significantly reduced
the range of variability in the responses, aligning them
more closely with our specific requirements for alter-
native text generation (Open AI, n d).
To summarise, prioritising initial content genera-
tion, followed by evaluative revision, has proven to
be a time-efficient approach, aligning with our pri-
mary objective of enhancing document accessibility
for educational purposes. This was reaffirmed by the
feedback from the student, who emphasised the im-
portance of well-structured and complete content and
was happy to learn with a document after such evalu-
ative revision.
6 DISCUSSION
AI holds considerable promise in enhancing the ac-
cessibility of educational materials for visually im-
paired students. As highlighted earlier, a crucial el-
ement of accessible documents is providing alterna-
tive text for graphical content. Utilising common
language models like Chat-GPT offers a viable solu-
tion for generating comprehensive image descriptions
(Johnson et al., 2023).
Moreover, AI can generate detailed descriptions
for complex diagrams and structured textual content
(He and Deng, 2017; Bernardi et al., 2016). This
functionality aids in parsing information presented vi-
sually and gives visually impaired students a more
comprehensive understanding of the material.
Engaging with content in code snippets or tables
poses a challenge for those with visual impairments.
Optical character recognition (OCR) within AI sys-
tems can be a valuable technology (Sheela et al.,
2023). Converting code and tabular data into acces-
sible formats can be an assistive tool.
Other approaches focused on accessible slide-
creation solutions where visually impaired users
could complete slide reading and authoring tasks in-
dependently through a multimodal interaction board
(Zhang et al., 2023). The developed A11yBoard was
an extension for Google Slides and gave visually im-
paired users an inclusive interface to navigate and
modify slides themselves.
Similar to our findings, Glazko et al. (2023) val-
ued generative AI technology as a useful tool but
found it required ”significant human involvement and
iteration, rather than an out-of-the-box end-to-end so-
lution for [their] access needs” .
6.1 Learnings
AI technologies have demonstrated significant effi-
cacy in rendering previously inaccessible documents
usable for educational purposes. Advanced iterations
of GPT, such as GPT-4, exhibit remarkable profi-
ciency in extracting and elucidating information from
conventional university lecture slides. This capabil-
ity extends to interpreting and generating mathemati-
cal formulas and LaTeX expressions facilitated by the
extensive training data used for these models.
During the material assessment, it also became
apparent that each course brings different require-
ments to accessibility. Many mathematical formulas
were printed as an image instead of markdown or La-
TeX and were therefore impossible for screen read-
ers to interpret. Diagrams to depict business cases
in business process modelling notation (BPMN) were
saved as screenshots. The same applied to accounting
classes where t-accounts or booking rates were pic-
tured. Most of these cases were unique to business
computing classes but showcased the need for further
material evaluation in other study programs.
Nonetheless, the journey towards full automation
in document accessibility remains incomplete. Cur-
rent large language models, including GPT-4, are not
infallible and exhibit limitations, particularly in im-
age comprehension. The ability of these AI models
to distinguish between relevant and irrelevant content
is still being refined, necessitating human oversight
during the conversion process.
One key learning from this case study is the reali-
sation that, in many cases, it is more efficient to recre-
ate slides entirely with accessibility in mind rather
than attempting to retrofit existing slides to meet ac-
cessibility standards. This highlights the importance
of incorporating accessibility principles from the out-
set of slide creation, ensuring that educational materi-
als are inherently accessible to all users.
6.2 Limitations
Our study was bound in its focus on converting a lim-
ited number of existing slides into an accessible for-
mat. The tool’s evaluation was restricted to business
computing classes and limited in broader applicability
across different educational settings and disciplines.
Further research should be done to evaluate TRAIL’s
effectiveness in other study fields.
Additionally, the development and evaluation pro-
cess involved only one blind student, and while their
CSEDU 2025 - 17th International Conference on Computer Supported Education
22

insights have been instrumental, they may not fully
capture the diverse needs and perspectives of the
broader blind community. We acknowledge the ne-
cessity for further testing and validation across vari-
ous contexts and with a more representative sample
of blind users.
6.3 Future Work
Moving forward, further development should address
the previously mentioned limitations by expanding
the tool’s applicability to diverse academic contexts
and a broader sample group of visually impaired stu-
dents. Engaging with a larger blind community from
different academic disciplines will ensure the tool’s
functionalities align with varied preferences and re-
quirements.
Furthermore, integrating options for direct user
feedback on the generated slides as part of the
tool’s functionality would help iterative improve-
ments based on user interactions and experiences.
By addressing these areas, researchers can con-
tribute to advancing accessible technologies for visu-
ally impaired individuals in educational settings, en-
hancing effectiveness, usability, and inclusivity for a
broader audience.
7 CONCLUSION
This paper discussed the possibilities of AI for gen-
erating accessible learning material. Despite le-
gal requirements for accessibility, visually impaired
students still encounter barriers in many aspects of
higher education, particularly regarding access to
adapted course material. These deficits were high-
lighted with the enrolment of a fully blind student in
one of our study programs. This formed the basis of a
comprehensive case study in which the complexities
of adapting existing course materials for blind stu-
dents were investigated. The exploration introduced
a promising solution: leveraging generative AI tech-
nology to streamline the creation of accessible edu-
cational materials. The introduction and evaluation of
the TRAIL tool exemplified the potential of AI in gen-
erating textual descriptions of lecture slides, thereby
enhancing accessibility and creating a more inclusive
learning environment. Moving forward, continued re-
search and innovation in AI-driven accessibility so-
lutions hold the key to overcoming barriers and en-
suring equitable educational opportunities for all stu-
dents, regardless of disabilities.
ACKNOWLEDGEMENTS
This paper portrays the work carried out in the con-
text of the KIWI project (16DHBKI071) that is gen-
erously funded by the Federal Ministry of Education
and Research (BMBF).
REFERENCES
Armstrong, H. and Murray, I. (2007). Remote and local de-
livery of cisco education for the vision-impaired. In
Proceedings of the 12th annual SIGCSE conference
on Innovation and technology in computer science ed-
ucation, pages 78–81.
Athanasios, K., Konstantinos, P., Doxa, P., and Eleni, K.
(2009). Students with visual impairments in higher
education institutes. In 7th European Conference of
ICEVI.
Bernardi, R., Cakici, R., Elliott, D., Erdem, A., Erdem, E.,
Ikizler-Cinbis, N., Keller, F., Muscat, A., and Plank,
B. (2016). Automatic description generation from im-
ages: A survey of models, datasets, and evaluation
measures. Journal of Artificial Intelligence Research,
55:409–442.
Billah, S. M., Ashok, V., Porter, D. E., and Ramakrishnan, I.
(2017). Ubiquitous accessibility for people with visual
impairments: Are we there yet? In Proceedings of the
2017 chi conference on human factors in computing
systems, pages 5862–5868.
Bishop, D. and Rhind, D. J. (2011). Barriers and enablers
for visually impaired students at a UK Higher Educa-
tion Institution. British Journal of Visual Impairment,
29(3):177–195.
Bradea, A. and Bl
ˆ
andul, V. C. (2017). New Modalities to
Increase the Accessibility of Students with Visually
Impaired to Education Using ICT. New Trends and Is-
sues Proceedings on Humanities and Social Sciences.
Burewicz, A. and Miranowicz, N. (2002). Categorization of
visualization tools in aspects of chemical research and
education. International Journal of Quantum Chem-
istry, 88(5):549–563.
Butler, M., Holloway, L., Marriott, K., and Goncu, C.
(2017). Understanding the graphical challenges faced
by vision-impaired students in Australian universi-
ties. Higher Education Research & Development,
36(1):59–72.
Choi, J., Jung, S., Park, D. G., Choo, J., and Elmqvist,
N. (2019). Visualizing for the non-visual: Enabling
the visually impaired to use visualization. Computer
Graphics Forum, 38(3):249–260.
Croft, E. (2020). Experiences of visually impaired and blind
students in UK higher education: an exploration of ac-
cess and participation. Scandinavian Journal of Dis-
ability Research, 22(1):382–392.
DBSV e. V. (n. d.). Quick Guide Barrierefreie PowerPoint-
Folien. Online; accessed 08.01.2025.
De Beco, G. (2014). The right to inclusive education ac-
cording to Article 24 of the UN Convention on the
Generating Accessibility: Using AI to Improve Higher Education for the Visually Impaired
23

rights of persons with disabilities: background, re-
quirements and (remaining) questions. Netherlands
Quarterly of Human Rights, 32(3):263–287.
Fichten, C. S., Ferraro, V., Asuncion, J. V., Chwojka, C.,
Barile, M., Nguyen, M. N., Klomp, R., and Wolforth,
J. (2009). Disabilities and e-learning problems and so-
lutions: An exploratory study. Journal of Educational
Technology & Society, 12(4):241–256.
Firat, T. (2021). Experiences of students with visual impair-
ments in higher education: barriers and facilitators.
British Journal of Special Education, 48(3):301–322.
Fouh, E., Akbar, M., and Shaffer, C. A. (2012). The role of
visualization in computer science education. Comput-
ers in the Schools, 29(1-2):95–117.
Giese, M., Greisbach, M., Meier, M., Neusser, T., and
Wetekam, N. (2022). ‘I usually never got involved’:
understanding reasons for secondary students with
visual impairments leaving mainstream schooling in
Germany. European Journal of Special Needs Educa-
tion, 37(2):264–277.
Glazko, K. S., Yamagami, M., Desai, A., Mack, K. A.,
Potluri, V., Xu, X., and Mankoff, J. (2023). An Au-
toethnographic Case Study of Generative Artificial In-
telligence’s Utility for Accessibility. In Proceedings of
the 25th International ACM SIGACCESS Conference
on Computers and Accessibility, pages 1–8.
He, X. and Deng, L. (2017). Deep learning for image-to-
text generation: A technical overview. IEEE Signal
Processing Magazine, 34(6):109–116.
Heyer, K. (2021). What is a human right to inclu-
sive education? The promises and limitations of the
crpd’s inclusion mandate. Handbuch Inklusion inter-
national/International Handbook of Inclusive Educa-
tion, pages 45–58.
Hutchinson, J. S. O., Atkinson, K., and Orpwood, J. (1998).
Breaking down barriers: Access to further and higher
education for visually impaired students. Nelson
Thornes.
Ishihara, T., Takagi, H., Itoh, T., and Asakawa, C. (2006).
Analyzing visual layout for a non-visual presentation-
document interface. In Proceedings of the 8th inter-
national ACM SIGACCESS conference on Computers
and accessibility, pages 165–172.
Jenkinson, J. (2018). Molecular biology meets the learning
sciences: Visualizations in education and outreach.
Journal of Molecular Biology, 430(21):4013–4027.
Johnson, O., Alyasiri, O., Akhtom, D., and Johnson, O.
(2023). Image analysis through the lens of chatgpt-
4. Journal of Applied Artificial Intelligence, 4(2).
Jones, L. L., Jordan, K. D., and Stillings, N. A. (2005).
Molecular visualization in chemistry education: the
role of multidisciplinary collaboration. Chemistry Ed-
ucation Research and Practice, 6(3):136–149.
Jones, M. G., Minogue, J., Oppewal, T., Cook, M. P., and
Broadwell, B. (2006). Visualizing without vision at
the microscale: Students with visual impairments ex-
plore cells with touch. Journal of science education
and technology, 15(5):345–351.
Jung, C., Mehta, S., Kulkarni, A., Zhao, Y., and Kim, Y.-S.
(2021). Communicating visualizations without visu-
als: Investigation of visualization alternative text for
people with visual impairments. IEEE transactions
on visualization and computer graphics, 28(1):1095–
1105.
Kim, N. W., Joyner, S. C., Riegelhuth, A., and Kim, Y.
(2021). Accessible Visualization: Design Space, Op-
portunities, and Challenges. Computer Graphics Fo-
rum, 40(3):173–188.
Leiker, D., Gyllen, A. R., Eldesouky, I., and Cukurova, M.
(2023). Generative AI for Learning: Investigating the
Potential of Learning Videos with Synthetic Virtual
Instructors. In International conference on artificial
intelligence in education, pages 523–529. Springer.
Lundgard, A. and Satyanarayan, A. (2021). Accessible vi-
sualization via natural language descriptions: A four-
level model of semantic content. IEEE transactions
on visualization and computer graphics, 28(1):1073–
1083.
MacKay, D. (2006). The United Nations Convention on the
rights of persons with disabilities. Syracuse J. Int’l L.
& Com., 34:323.
Mohamady, A. A., Fathy, A. G., Ibrahim, A. E., Darwish,
M. S., and Salama, M. K. (2023). Enhancing Acces-
sibility and Independence of Visually Impaired Indi-
viduals through AI, ML and IoT: The Development
of a Smart Robot Assistant. Enhancing Accessibil-
ity and Independence of Visually Impaired Individuals
through AI, ML and IoT: The Development of a Smart
Robot Assistant.— IUSRJ, 4.
Moured, O., Alzalabny, S., Schwarz, T., Rapp, B., and
Stiefelhagen, R. (2023). Accessible Document Lay-
out: An Interface for 2D Tactile Displays. In Proceed-
ings of the 16th International Conference on PErva-
sive Technologies Related to Assistive Environments,
pages 265–271.
Naps, T. L., R
¨
oßling, G., Almstrum, V., Dann, W., Fleis-
cher, R., Hundhausen, C., Korhonen, A., Malmi, L.,
McNally, M., Rodger, S., et al. (2002). Exploring the
role of visualization and engagement in computer sci-
ence education. In Working group reports from ITiCSE
on Innovation and technology in computer science ed-
ucation, pages 131–152. Association for Computing
Machinery.
Open AI (n. d.). Text generation models. Online; accessed
08.01.2025.
Permvattana, R., Armstrong, H., and Murray, I. (2013). E-
learning for the vision impaired: A holistic perspec-
tive. International Journal of Cyber Society and Edu-
cation, 6(1):15–30.
Rapp, D. N. (2005). Mental models: Theoretical issues for
visualizations in science education. Visualization in
science education, pages 43–60.
Sharif, A., Chintalapati, S. S., Wobbrock, J. O., and Rei-
necke, K. (2021). Understanding screen-reader users’
experiences with online data visualizations. In Pro-
ceedings of the 23rd International ACM SIGACCESS
Conference on Computers and Accessibility, pages 1–
16.
Sheela, S., Krishnan, R., Srivathsan, R., Sudharsan, M., and
Sriram, S. (2023). Enhancing accessibility: object
CSEDU 2025 - 17th International Conference on Computer Supported Education
24

detection and optical character recognition for em-
powering visually impaired individuals. In Interna-
tional Conference on Computer Vision and Internet of
Things 2023 (ICCVIoT’23), volume 2023, pages 305–
309. IET.
Simui, F., Kasonde-Ngandu, S., Cheyeka, A. M.,
Simwinga, J., and Ndhlovu, D. (2018). Enablers
and disablers to academic success of students with
visual impairment: A 10-year literature disclosure,
2007–2017. British Journal of Visual Impairment,
36(2):163–174.
Tervakari, A.-M., Silius, K., Koro, J., Paukkeri, J., and Pirt-
til
¨
a, O. (2014). Usefulness of information visualiza-
tions based on educational data. In 2014 IEEE global
engineering education conference (EDUCON), pages
142–151. IEEE.
Thurston, A. (2014). Disability, power and equality in the
school. International Journal of Disability, Develop-
ment and Education, 61(2):105–107.
United Nations (n. d.). Convention on the rights of persons
with disabilities (crpd). Online; accessed 08.01.2025.
Vanderheiden, G. C. (2008). Ubiquitous accessibility, com-
mon technology core, and micro assistive technology:
Commentary on “computers and people with disabil-
ities”. ACM Transactions on Accessible Computing
(TACCESS), 1(2):1–7.
Vavra, K. L., Janjic-Watrich, V., Loerke, K., Phillips, L. M.,
Norris, S. P., and Macnab, J. (2011). Visualization in
science education. Alberta Science Education Jour-
nal, 41(1):22–30.
Vieira, C., Parsons, P., and Byrd, V. (2018). Visual learning
analytics of educational data: A systematic literature
review and research agenda. Computers & Education,
122:119–135.
Wang, L. L., Cachola, I., Bragg, J., Cheng, E. Y.-Y., Haupt,
C., Latzke, M., Kuehl, B., van Zuylen, M. N., Wagner,
L., and Weld, D. (2021). Scia11y: Converting scien-
tific papers to accessible html. In Proceedings of the
23rd International ACM SIGACCESS Conference on
Computers and Accessibility, pages 1–4.
Zhang, Z., Kim, G. S., and Wobbrock, J. O. (2023). De-
veloping and Deploying a Real-World Solution for
Accessible Slide Reading and Authoring for Blind
Users. In Proceedings of the 25th International ACM
SIGACCESS Conference on Computers and Accessi-
bility, pages 1–15.
Generating Accessibility: Using AI to Improve Higher Education for the Visually Impaired
25
