
Deep Local Feature Matching Image Anomaly Detection with Patch
Adaptive Average Pooling Technique
Afshin Dini
a
and Esa Rahtu
b
Unit of Computing Sciences, Tampere University, Finland
{firstname.lastname}@tuni.fi
Keywords:
Anomaly Detection, Deep Local Feature Matching, MVTec-AD Dataset.
Abstract:
We present a new visual defect detection approach based on a deep feature-matching model and a patch
adaptive technique. The main idea is to utilize a pre-trained feature-matching model to identify the training
sample(s) being most similar to each test sample. By applying a patch-adaptive average pooling on the ex-
tracted features and defining an anomaly map using a pixel-wise Mahalanobis distance between the normal
and test features, anomalies can be detected properly. By evaluating our method on the MVTec dataset, we
discover that our method has many advantages over similar techniques as (1) it skips the training phase and
the difficulties of fine-tuning model parameters that may vary from one dataset to another, (2) it performs quite
well on datasets with only a few training samples, reducing the costs of collecting large training datasets in
real-world applications, (3) it can automatically adjust itself without compromising performance in terms of
shift in data domain, and (4) the model’s performance is better than similar state-of-the-art methods.
1 INTRODUCTION
Anomalies in vision applications refer to patterns in
images or video data that deviate significantly from
the expected behavior of normal patterns (Cao et al.,
2024). Anomaly detection is the process of iden-
tifying these outliers by learning the characteristics
of normal samples and pointing out deviations as
anomalies (Xie et al., 2024). Visual defect detec-
tion is a critical task in various real-world applica-
tions, including quality control in manufacturing (Liu
et al., 2024), industrial inspection (Dini. et al., 2024),
and autonomous driving (Bogdoll et al., 2022) where
early detection of defects improves the performance.
Due to the data-driven characteristics of the
anomaly detection topic, machine learning methods
are suitable candidates to deal with this problem.
Many traditional approaches, like clustering tech-
niques (Aytekin et al., 2018), are developed based
on training models on engineered features. How-
ever, their performance is limited due to some intrin-
sic complexities of anomalies, such as unknownness,
scarcity, and diversity of anomalies (Palakurti, 2024).
Generally, defects occur rarely and are unknown
before happening in real-world applications, as a re-
a
https://orcid.org/0000-0001-6234-3322
b
https://orcid.org/0000-0001-8767-0864
sult of which collecting a labeled dataset containing
both anomalous and normal samples for training deep
models is impossible in most cases (Palakurti, 2024).
Deep semi-supervised methods (Rippel and Merhof,
2023) try to address this issue by developing models
that only require normal samples for training purposes
in such a way that the model learns the characteris-
tics of normal samples and the potential anomalies are
specified based on their differences from the normal
pattern. In addition, abnormalities appear in a variety
of sizes, forms, colors, and types, making them diffi-
cult to identify with semi-supervised models that are
solely trained on normal data. Self-supervised tech-
niques (Hojjati et al., 2024) are evolved to address
this issue in which anomalies are firstly simulated in
a proxy task from the available normal samples, and
then the combinations of normal and simulated de-
fects are utilized to train a more efficient deep model.
Although semi and self-supervised methods out-
perform traditional approaches, they still have limi-
tations. Reliance on a specific domain, the need for
fine-tuning the model’s parameters for each dataset,
high computational demands during training, real-
time processing challenges, and the requirement for
a large number of normal samples to train deep mod-
els are a few of these limitations (Hojjati et al., 2024).
Recent approaches like (Dini and Rahtu, 2024) try to
decrease the computational costs of the training phase
332
Dini, A. and Rahtu, E.
Deep Local Feature Matching Image Anomaly Detection with Patch Adaptive Average Pooling Technique.
DOI: 10.5220/0013136400003912
Paper published under CC license (CC BY-NC-ND 4.0)
In Proceedings of the 20th International Joint Conference on Computer Vision, Imaging and Computer Graphics Theory and Applications (VISIGRAPP 2025) - Volume 2: VISAPP, pages
332-339
ISBN: 978-989-758-728-3; ISSN: 2184-4321
Proceedings Copyright © 2025 by SCITEPRESS – Science and Technology Publications, Lda.

by utilizing a pre-trained model as a feature extractor
and skipping the training procedure. Although these
methods can be used in different datasets without any
further parameter fine-tuning, their performance still
mainly depends on the number of normal samples as
they are directly used in anomaly detection.
In this paper, we have developed a new approach
to tackle some of the aforementioned challenges. Our
primary goal is to develop an approach that is com-
putationally efficient, does not depend significantly
on the number of normal samples, has a high perfor-
mance even with a small number of samples, and can
be reused easily in case of data domain changes.
To achieve these goals, we propose a method that
finds samples of the training dataset that are most sim-
ilar to each test image using a local feature-matching
model. Then, a feature adaptor, designed with the
help of a patch-adaptive average pooling technique,
is applied to the extracted features to enrich the sam-
ple presentations. We have demonstrated that patch-
adaptive pooling enables the model to capture infor-
mation from neighboring pixels for more accurate de-
tection while reducing the size of the final features,
which decreases the computational demands. We dis-
cover that a small number of similar normal samples
is sufficient to find defective samples, as a result of
which this method does not require a large training
dataset. Moreover, this method can easily be adapted
to significant changes in the data domain by simply
adding a few new samples to the normal datasets,
avoiding the time-consuming process of retraining the
model from scratch. We have assessed our method
on the MVTec-AD (Bergmann et al., 2019) dataset in
Section 4 and discussed the results in Section 5.
2 RELATED WORK
Anomaly detection approaches can be categorized
from various perspectives. (Mohammadi et al., 2021)
categorizes them into three groups as supervised,
semi-supervised, and unsupervised methods based on
the availability of labeled samples in the training
datasets. However, since most of the recent meth-
ods utilize only normal samples in the training phase,
we follow (Liu et al., 2024), which mainly focuses
on semi-supervised approaches and categorizes them
into three main groups as reconstruction-based, self-
supervised, and feature embedding-based methods.
Reconstruction-based methods are the most com-
mon semi-supervised methods in which a model is
trained only with normal samples in such a way that
it can reconstruct the normal images from a latent
space properly while the abnormalities cannot be re-
constructed accurately (Yang et al., 2022). The differ-
ence between the original and the reconstructed im-
ages defines whether an image is normal or contains
defects. Although all reconstruction-based methods
follow the same principle, they differ slightly in ar-
chitecture. Autoencoders (AEs) (Yang et al., 2022)
are the most common approaches, consisting of an
encoder that maps samples to a latent space and a
decoder that reconstructs the images from the en-
coded space. Many variants of AEs, like RIAD (Za-
vrtanik et al., 2021b), primarily incorporate convolu-
tional layers in their architecture to detect anomalies.
Generative Adversarial Networks (GANs), such
as OCR-GAN (Liang et al., 2023), are another group
of reconstruction-based methods that consist of a gen-
erator, which produces synthetic images from a nor-
mal data distribution and a discriminator, which dif-
ferentiates between real and generated images. The
reconstruction error between the synthetic and origi-
nal images highlights the defects. The main limitation
of GAN-based models is their stability issue, specifi-
cally when a small training dataset is available (Li and
Li, 2023). Other recent reconstruction-based methods
have incorporated transformers into their architecture,
like InTra (Pirnay and Chai, 2022). While these meth-
ods achieve superior performance compared to earlier
approaches, they are complex and require large train-
ing datasets.
Although reconstruction-based methods perform
well in detecting anomalies, they need a large dataset
for training. Moreover, to achieve proper accuracy, a
unique model must be trained for each dataset, espe-
cially in the case of significant shifts in the data do-
main. These limitations, in addition to the instabil-
ity problem of GAN-based methods, limit the use of
reconstruction-based techniques in real-world appli-
cations.
On the other hand, self-supervised methods (Hoj-
jati et al., 2024) try to simulate irregularities within a
proxy task and then utilize both normal and artificial
anomalies to train a more powerful model that can de-
tect anomalous samples. The effectiveness of these
methods mainly relies on the proxy task algorithms.
The large group of semi-supervised approaches
involves feature embedding-based methods, includ-
ing various types of architectures, such as teacher-
student models and one-class classifiers. Teacher-
student models, like AST (Rudolph et al., 2023), con-
sist of a teacher and a student parts in which a pre-
trained teacher transfers knowledge of normal sam-
ples to a student model during the training phase. In
the inference phase, features of normal images ex-
tracted by both the teacher and student networks are
similar, while features of abnormal images specify de-
Deep Local Feature Matching Image Anomaly Detection with Patch Adaptive Average Pooling Technique
333

fects. The primary limitation of these methods is their
tendency to overfit, particularly when there is a mis-
match between the size of the student model and the
complexity of the samples (Hojjati et al., 2024).
One-class classifiers (OCC) define a normal re-
gion based on features extracted from normal sam-
ples and identify defects when the features of test
samples fall outside this region. The quality and size
of anomalous samples are critical aspects that can af-
fect the performance of OCC algorithms. Many OCC
methods, like SVDD (Zhang and Deng, 2021), try
to train a model from scratch, while patch-wise ap-
proaches, like patchSVDD (Yi and Yoon, 2020), di-
vide samples into patches and utilize them for train-
ing purposes. Patch-wise OCCs are slow during train-
ing, while the performance of other OCC methods is
constrained by the size of the training dataset (Hojjati
et al., 2024).
3 METHOD
3.1 Model Overview
We have proposed a simple method that detects ir-
regularities by finding the difference between each
test image and its similar normal samples from the
training dataset. In this regard, a pre-trained deep lo-
cal feature matching model is first utilized to retrieve
and categorize similar normal images in a pre-testing
phase. Then, with the help of a feature extractor, a
patch adaptor, and an appropriate anomaly metric in
the testing phase, defects can be detected precisely.
The feature extractor provides a rich representation of
the related normal and test samples. The patch-wise
feature adaptor primarily serves to reduce the feature
space’s size while preserving information across the
patch pixels of the image to enhance performance. In
the end, the Mahalanobis distance between each test
patch and its corresponding normal patch is used to
detect irregularities. It’s important to emphasize that
this method requires no additional training, as it relies
solely on pre-trained models in all stages. The pre-
testing phase is only designed to increase the speed of
the inference stage while reducing the computational
costs by going through limited groups of similar nor-
mal samples instead of all the individual samples for
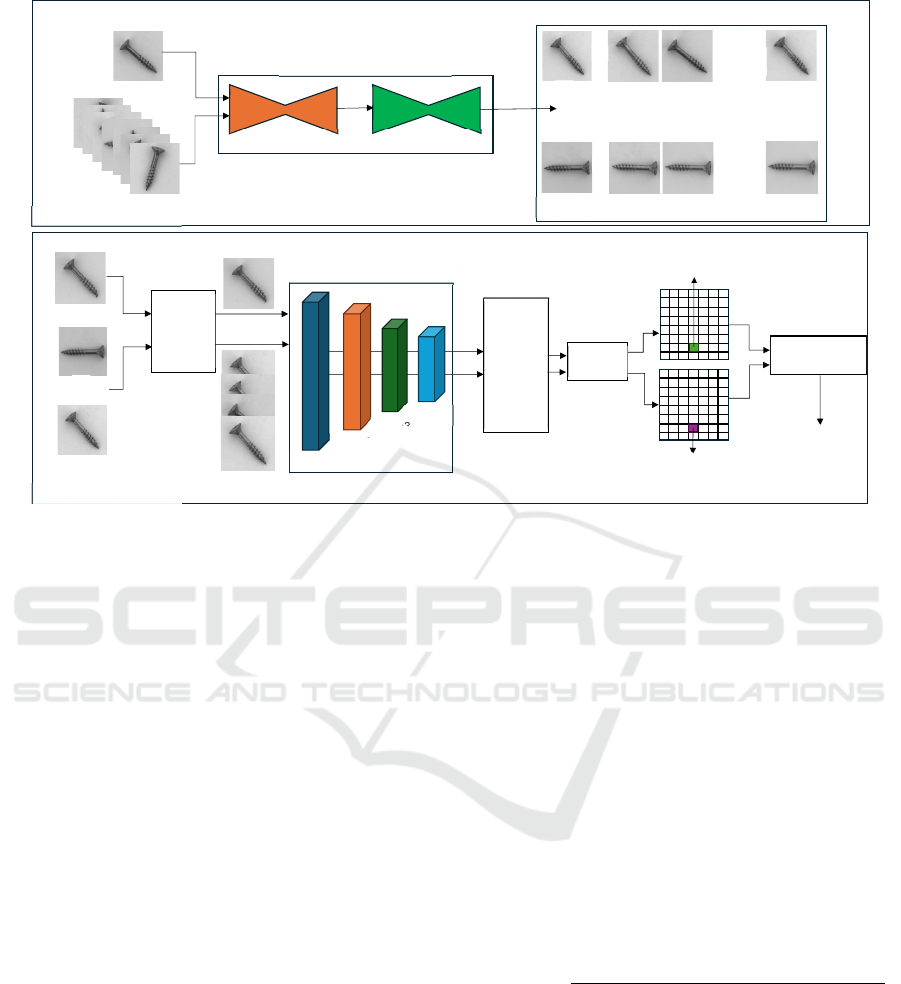
each test image. The overview and model architecture
of the proposed method are shown in Fig. 1.
3.2 Pre-Testing Phase
The core idea of this method is to identify anomalous
samples based on their differences from their simi-
lar samples, much like how a human would detect
defects. To reach this goal, normal samples similar
to each test sample should be selected with the help
of a local feature-matching model. This process in-
volves unnecessary repeated detection and matching
of key points in images, which is computationally in-
efficient, especially as the number of normal samples
grows.
To deal with this issue, a pre-testing phase is de-
signed, Fig. 1(a), in which normal samples similar to
one another are categorized into a limited number of
groups with a lead image by using the pre-trained fea-
ture matcher. In the testing phase, each test sample is
compared to the lead images to find a group of normal
images that best matches the test sample. The most
important aspects of the pre-testing phase are choos-
ing the appropriate feature matcher, defining the num-
ber of groups of similar samples, and the number of
normal samples per group.
Although any deep local feature matcher can be
utilized to retrieve similar images, we select De-
DoDe (Edstedt et al., 2024), the latest state-of-the-
art deep local feature matching method, containing
a detector to identify key points of an image and a
matcher to find the corresponding matches. When se-
lecting the optimal number of groups and images per
group, there is a trade-off between inference speed
and method performance. Defining many groups with
few images can increase inference time, while having
fewer groups with a large number of images may re-
duce accuracy due to the potential inclusion of irrele-
vant images in some groups. We discover that normal
images can be organized into an effective number of
groups with a suitable quantity of images per group by
analyzing the number of matched key points between
images and applying a rough threshold on them. We
discuss our approach of selecting an efficient number
of groups in Section 4.
3.3 Testing Phase
In the test stage, Fig. 1(b), each test image, x
t
∈ X
T
, is
compared with non-anomalous lead images, x
nlead
∈
X
NL
, to find the best match of normal samples. X
T
is
the set of test samples while X
NL
is the set of normal
samples in the L
th
group. A pre-trained feature ex-
tractor is utilized to extract features from the samples,
φ(x
i
) ∈ R
W ×H×C
where x
i
∈ X
T
or x
i
∈ X
L
N
and W,H,C
represent the width, height, and channel size of the ex-
tracted features from the last stage of the model. It is
good to mention that although various combinations
of features from different intermediate layers can be
utilized as final features, we use only the last layer
of the extractor, which provides a rich presentation of
VISAPP 2025 - 20th International Conference on Computer Vision Theory and Applications
334
Key
P
oint Detector
Key Point Matcher
Deep Local Feature Matcher
…………
.
.
.
.
.
…………
(b)
Pre
-
testing phase
Groups of similar normal samples
:
:
Lead Image
s
(a)
Testing phase
Feature Extractor
–
ResNet50
Stage1
Stage2
Stage3
Stage4
Patch-
Wise
Adaptive
Average
Pooling
Feature Adaptor
(
𝜇
,
∑
,
)
for
patches of
normal samples
Test sample patches
Smooth
Filter
Mahalanobis
Distance
Anomaly
Map & Score
Test Image
Lead Images
.
.
Deep
Local
Feature
Matcher
Figure 1: Model architecture of the proposed anomaly detection method. (a) Pre-testing phase in which similar normal
samples from training dataset are grouped with the help of a deep local feature matching method. (b) Testing phase in which
an anomaly map is defined with the help of a patch-wise feature adaptor between test sample and groups of similar samples.
the data, allowing us to achieve good detection results
while decreasing the inference time as is discussed in
Section 4.
A patch-wise feature adaptor is applied on the ex-
tracted features, φ(x
i
). To do so, for each sample’s
feature at location (x,y) defined by φ
x,y
(x
i
) ∈ R
C
, the
neighborhood pixels within the patch with size p can
be defined as:
N
p
x,y
= {(x
′
,y
′
)|x
′
∈ [x − ⌊p/2⌋,...,x + ⌊p/2⌋],
y
′
∈ [y − ⌊p/2⌋,...,y +⌊p/2⌋]}
(1)
The adaptive average pooling, f
AdvPool
, is then applied
to aggregate the features within the neighborhood set
N
p
x,y
as:
ψ
x,y
(x
i
) = f
AdvPool
({φ
x
′
,y
′
(x
i
)|(x
′
,y
′
) ∈ N
p
x,y
}) (2)
Where ψ
x,y
(x
i
) ∈ R
W ×H×C
′
as C
′
is the channel size
after applying the adaptive average pooling.
As is shown in (Liu et al., 2023), patch-wise adap-
tive average pooling reduces the spatial dimensions of
feature maps to a manageable size, reducing the com-
putational costs while preserving the important infor-
mation of features across pixels inside a patch.
3.4 Anomaly Map and Score
To identify anomalous samples, an anomaly score
must be assigned to each data sample. Defective sam-
ples can then be detected by setting a threshold on
these scores. In a similar way, an anomaly map can be
created by assigning anomaly scores to each pixel in
an image, allowing irregularities to be located within
the anomalous samples.
To define the anomaly score and anomaly map, a
general approach developed by (Defard et al., 2021)
is followed for feature patches calculated in the previ-
ous section. Considering the representations from the
feature adaptor for all normal samples of a L
th
group
as ψ
L
(x
i
) where x
i
∈ X
L
N
, we calculate the average and
covariance at each location of ψ
L
x,y
(x
i
) for all avail-
able normal images of group L and call them as µ
L
x,y
and Σ
L
x,y
respectively. Then, for each test feature at
location x, y, the Mahalanobis (Mahalanobis, 2018)
distance between ψ
x,y
(x
t
) and the related mean and
covariance is calculated:
PS
x,y
=
q
(ψ
x,y
(x
t
) − µ
L
x,y
)
T
Σ
L
x,y
−1
(ψ
x,y
(x
t
) − µ
L
x,y
)
(3)
where PS
x,y
is the score assigned to each pixel.
By calculating the scores for all pixels and up-
sampling the created score map to the size of the orig-
inal image, the final anomaly map is prepared. The
anomaly score for each test sample is considered as
the maximum value of the related anomaly map on
which, by setting the appropriate threshold, defective
samples can be detected properly.
Deep Local Feature Matching Image Anomaly Detection with Patch Adaptive Average Pooling Technique
335
4 EXPERIMENT
4.1 Dataset and Metric
Following the conventional procedures in literature,
we have evaluated our method on the MVTec-AD
dataset (Bergmann et al., 2019), which consists of
fifteen sub-datasets of high-resolution textured-type
and object-type images collected from actual indus-
trial applications. Each sub-dataset includes a limited
number of normal images, ranging from 60 to 391,
for model training purposes, making it challenging to
develop deep models with a large number of trainable
parameters.
The detection performance of our method is as-
sessed and compared with the results of previous tech-
niques using the Area Under the Receiver Operating
Characteristic curve (AUROC). This is accomplished
by creating the anomaly detection ROC curve and ap-
plying various thresholds to the anomaly score calcu-
lated in Section 3.4.
4.2 Implementation Details
As is shown in Fig. 1, two deep pre-trained models
are utilized in our method, one as local feature match-
ing and one as a feature extractor. DeDoDe (Edstedt
et al., 2024) is used as the feature matcher since it
categorizes similar training samples considering both
semantic and local information, ensuring that sam-
ples within a group share the same orientation. The
number of groups and samples per group in the pre-
testing phase should be chosen in such a way that we
achieve high accuracy and short inference time dur-
ing the testing phase. By analyzing the number of
matched key points in the MVTec-AD dataset, we
find that, for textured images, similar samples share
over 1000 matched key points, while for object-type
images, they share over 700 points. By applying a
rough threshold on the number of matched key points,
similar samples can be grouped into a limited number
of clusters, with each group containing 20 to 30 sam-
ples. For simplicity, the first image is designated as
the lead image for each group. In the testing stage,
ResNet50 (Zagoruyko, 2016) is utilized as the feature
extractor, and the output of the fourth stage is consid-
ered for detecting anomalies.
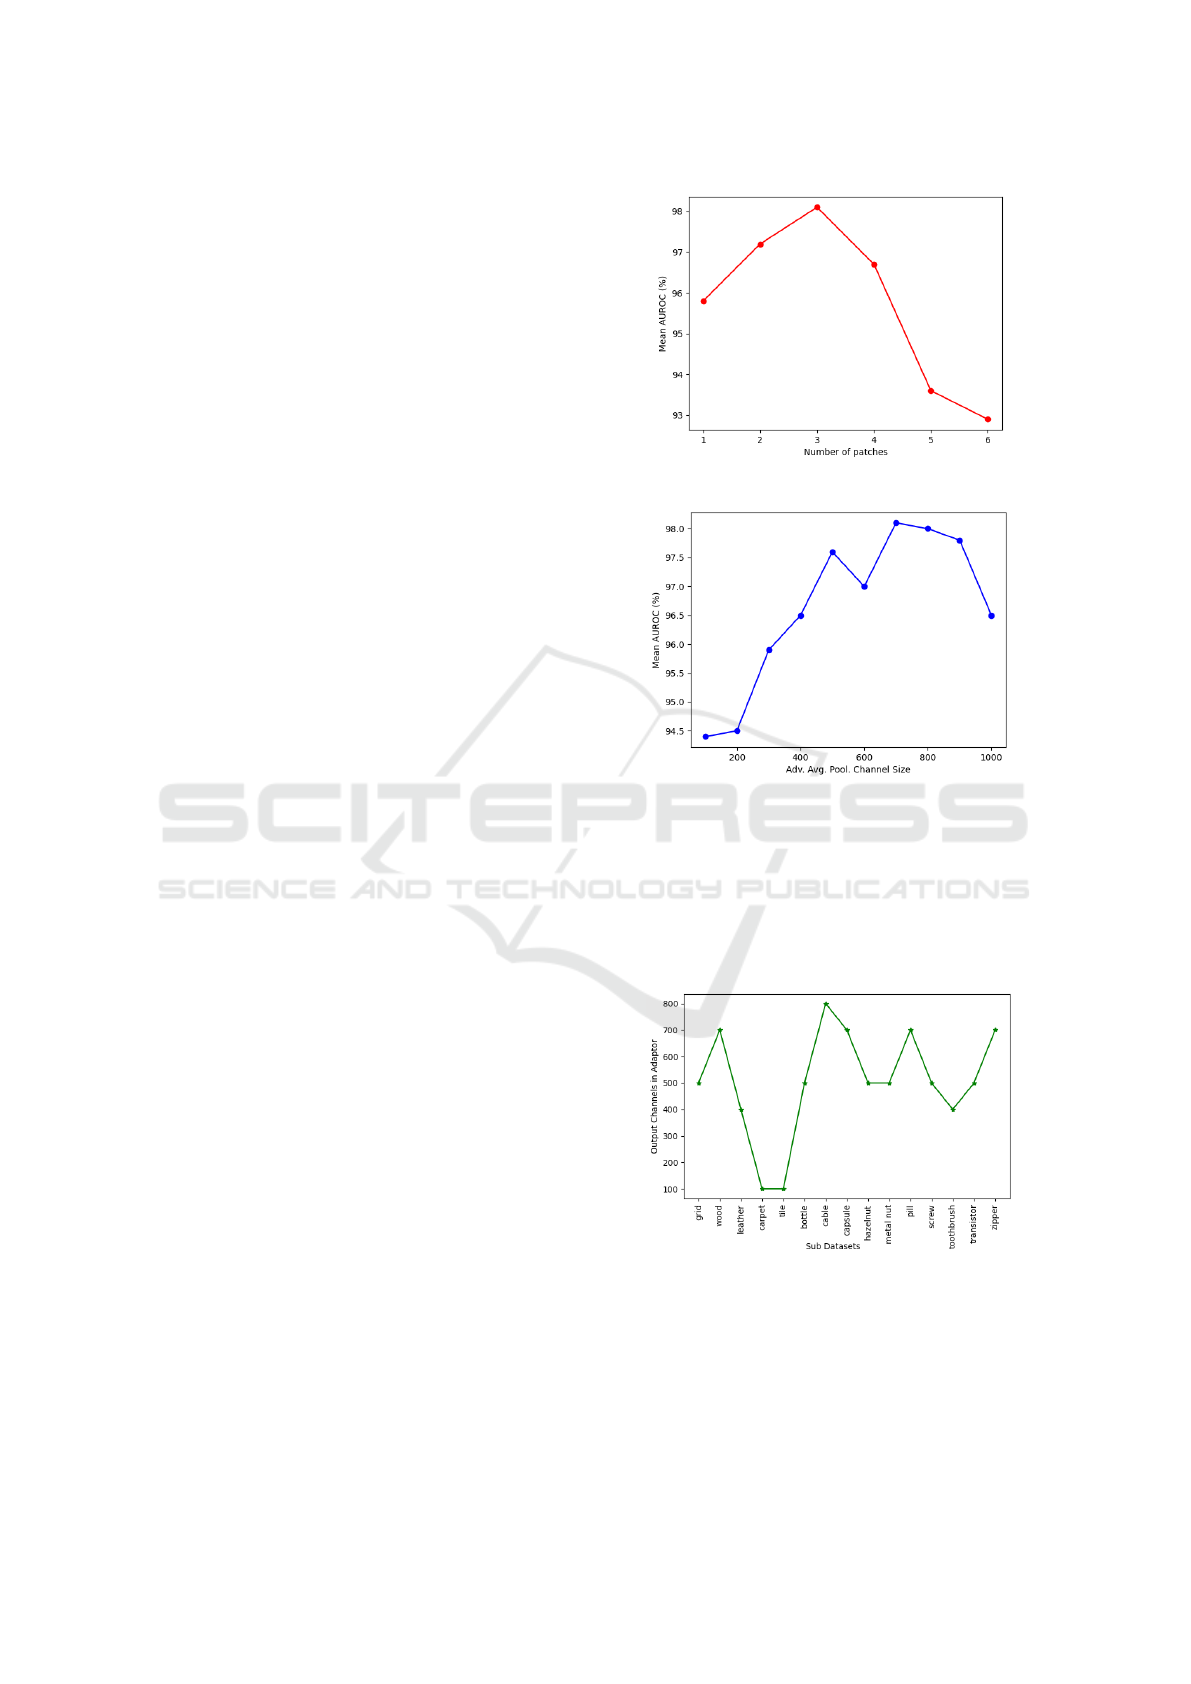
In the feature adaptor block, the patch size of
p = 3 is considered as the best option for combining
the neighbor pixels by testing the performance of the
proposed method with different patch sizes, Fig. 2.
Moreover, 700 is selected as the number of output
channels in the adaptive average pooling layer, Fig. 3.
It is shown in Fig. 4 that for some sub-datasets
Figure 2: Performance with different patch sizes.
Figure 3: Performance of the proposed method with differ-
ent number of channels in adaptive average pooling layer.
of the MVTec-AD dataset, even 100 channels are
enough to reach the best performance. However, 700
is selected as the number of output channels of the
feature adaptor, as it works in all cases. A Gaussian
filter with σ = 2 is also applied to smooth the adapted
features.
Figure 4: The smallest value for output channels of feature
adaptor that results in the best performance in each dataset.
4.3 Results
We present the results of evaluating our method on
the MVTec-AD dataset in Tab. 1 while comparing it
against previous methods with and without a train-
VISAPP 2025 - 20th International Conference on Computer Vision Theory and Applications
336
ing phase. It is clear that the proposed method out-
performs previous methods, with no training stage,
in both textured and object-type images. One can
conclude that employing a pre-trained deep feature
matcher that identifies both semantic and local key
points for grouping similar images enhances detec-
tion performance compared to using a basic K-nearest
neighbor approach to retrieve one image, as used
in the SPADE method. Moreover, comparing our
method with PaDiM and ConTNet shows that using a
patch-wise feature adaptor not only combines neigh-
boring pixel information for more accurate defect de-
tection but also reduces the number of feature chan-
nels, which significantly decreases testing time. In
addition, we believe that limiting the defect detection
to only the most similar samples to each test image
enhances the method’s performance, as dissimilarity,
such as rotation, may introduce inaccuracies.
By comparing the proposed method with methods
in the training phase, it is clear that our method per-
forms better than most of them while it has a close
AUROC to a few of them. It is good to mention that
our method’s primary advantage lies in its lack of a
training phase, allowing it to be applied across dif-
ferent datasets easily without the need for parameter
fine-tuning.
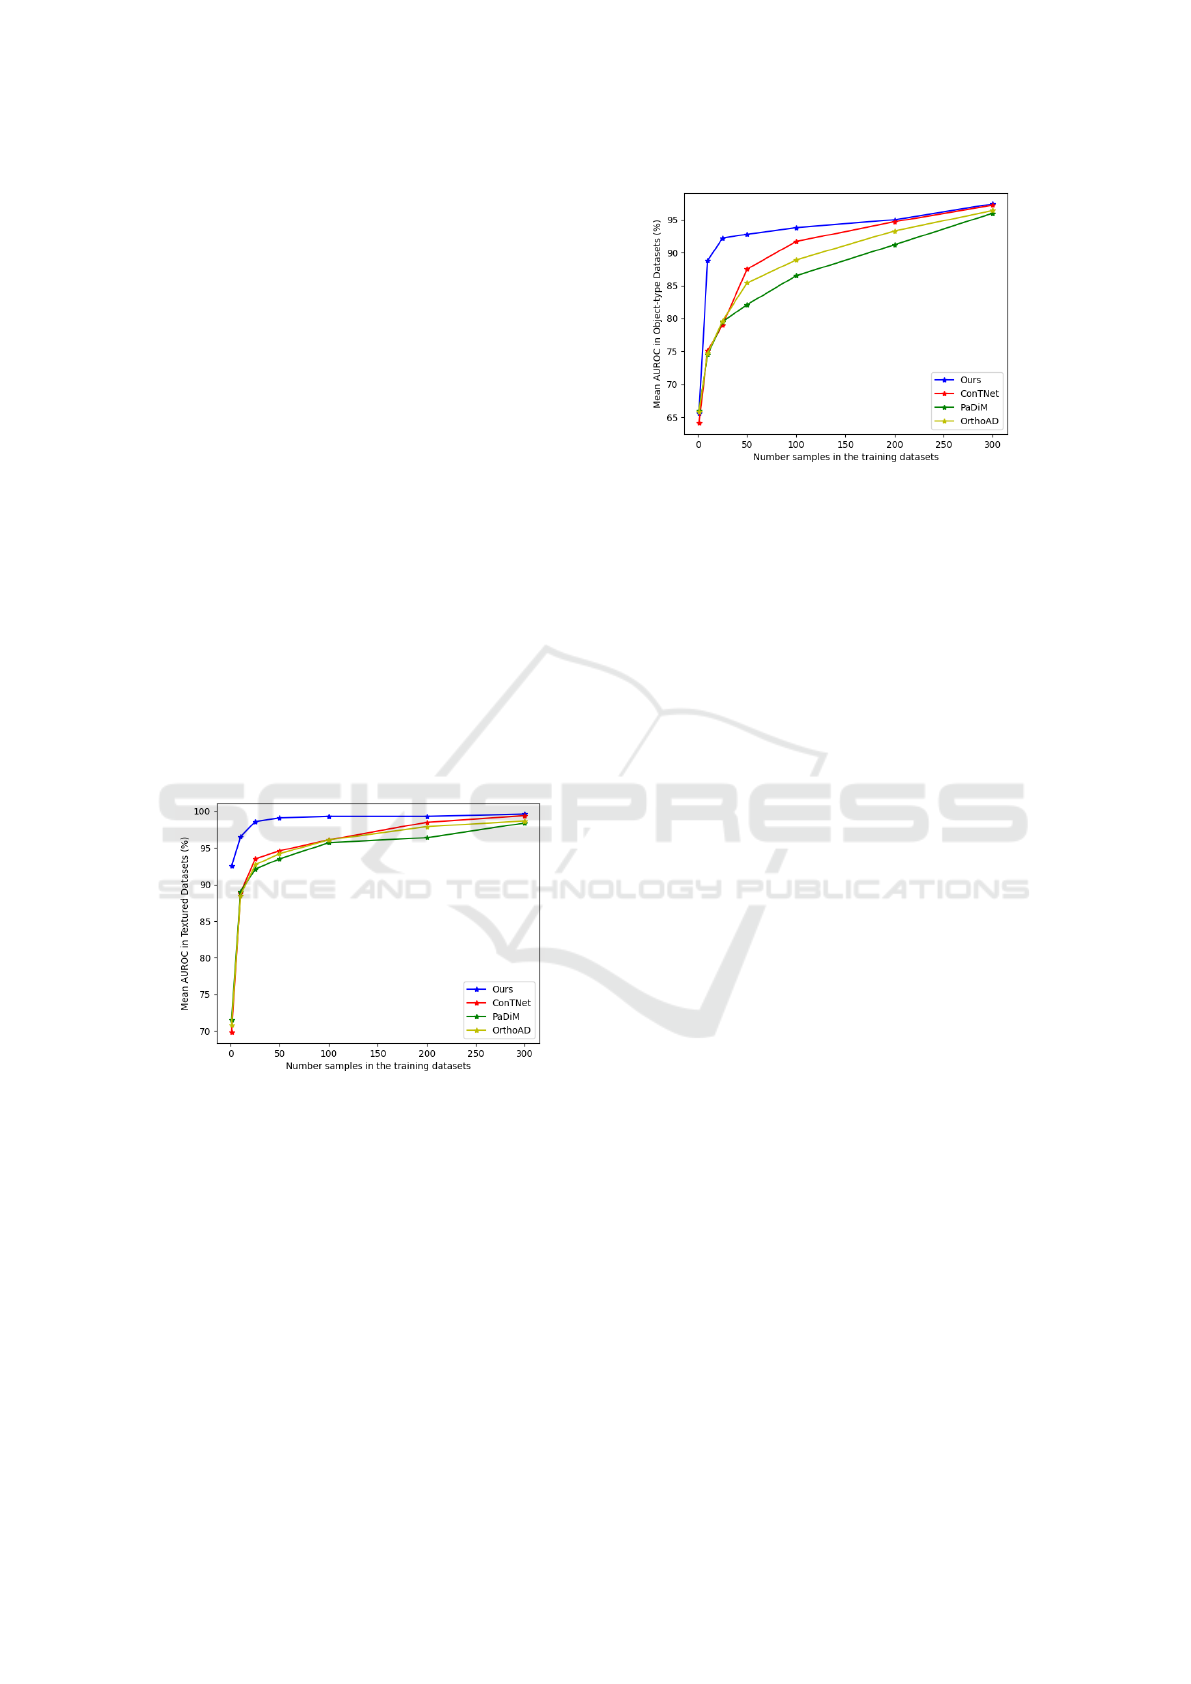
Figure 5: Performance of our method compared to other
ones with different training dataset sizes in textured images.
From another point of view, our method does not
rely on large training datasets as it requires only a
few normal samples that closely match each test sam-
ple to identify irregularities. This approach signifi-
cantly reduces the effort involved in gathering exten-
sive training datasets. To prove that our approach
outperforms similar methods in the case of smaller
training datasets, we randomly reduced the size of
the available normal samples in each sub-dataset and
compared the results of testing our method with other
methods that do not have any training phases. The
results are presented in Fig. 5 for textured images
and in Fig. 6 for object-type datasets. It is clear that
Figure 6: Performance of our method compared to other
ones with different training dataset sizes in object-type sub-
datasets.
our method reaches its high performance with only
25 and 50 normal samples in textured and object-type
datasets, respectively. It is worth mentioning that im-
ages in the object-type datasets have different orien-
tations and are more varied than the textured images,
as a result of which it is reasonable that the proposed
method reaches its performance with a larger amount
of normal samples compared to textured datasets.
5 CONCLUSION
We developed a novel approach for anomaly detec-
tion using a pre-trained local feature-matching model
alongside a patch-wise feature adaptor. This method
enables the identification of anomalous samples by
initially finding the most similar normal samples and
then applying the patch-wise feature adaptor to inte-
grate information from neighboring pixels within the
normal samples.
Evaluating our method on the MVTec dataset
demonstrates that the proposed method detects irreg-
ularities of various types and sizes properly. We show
that our method does not require any training phase,
which not only avoids the complex process of pa-
rameter fine-tuning but also can be used for differ-
ent datasets easily without any modification. More-
over, the proposed method requires only a minimal
set of normal samples for defect detection, which re-
duces the extensive effort of gathering a large training
dataset. Besides, when dealing with domain shifts in
the dataset, this method can automatically adapt with-
out compromising performance. Due to these rea-
sons, our method is an excellent candidate for detect-
ing defects in real-world applications.
Deep Local Feature Matching Image Anomaly Detection with Patch Adaptive Average Pooling Technique
337
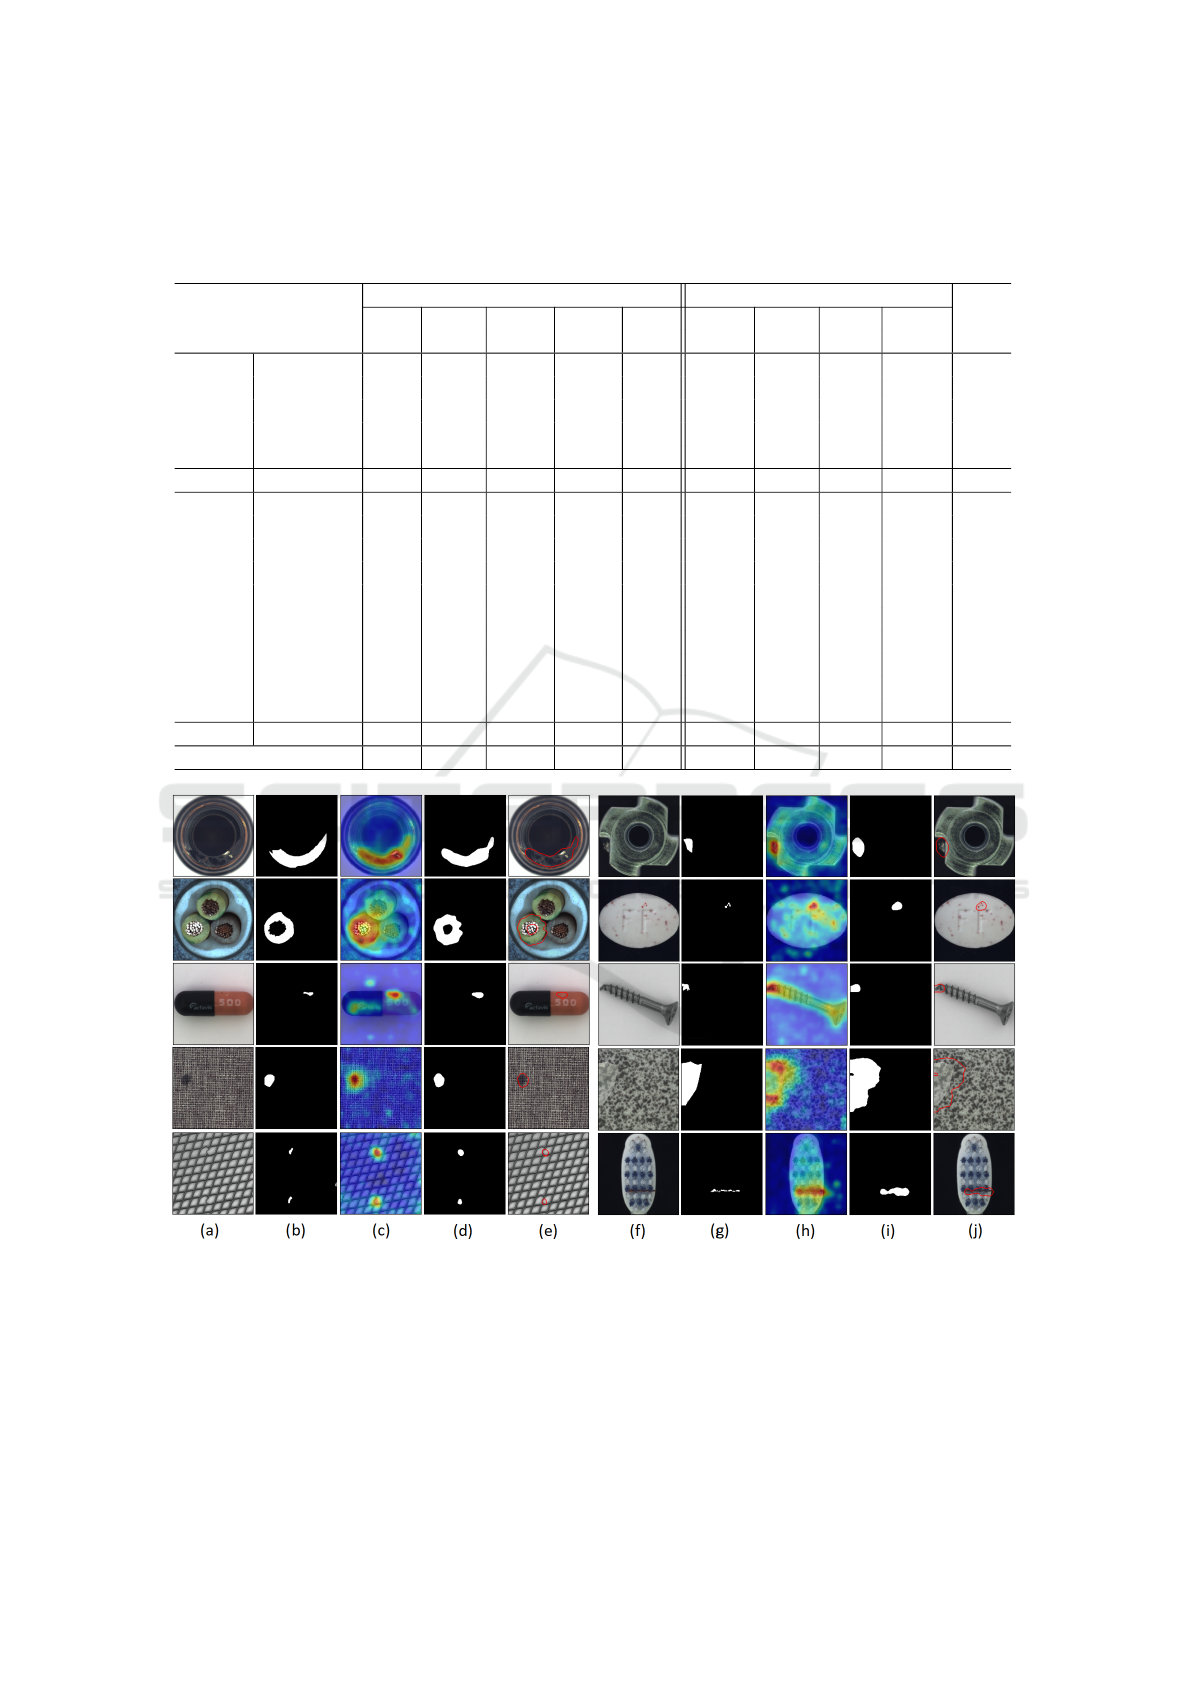
Table 1: Comparison of our approach with RIAD (Zavrtanik et al., 2021b), EdgeRec (Liu et al., 2022), DRAEM (Zavrtanik
et al., 2021a), Patchcore (Roth et al., 2022), and TPSAD (Dini and Rahtu, 2022) results, which contain training phase, and
ConTNet (Dini and Rahtu, 2023), SPADE (Cohen and Hoshen, 2020), PaDiM (Defard et al., 2021), OrthoAD (Kim et al.,
2021) results, which do not have any training phase, in image-level anomaly detection on MVTec-AD dataset, using AUROC.
Methods Needs Training Methods with No Training
Category RI Edge DR Patch TPS ConT SP PA Ortho Our
AD Rec AEM core AD Net ADE DIM AD
leather 100 100 100 100 100 100 97.6 100 100 100
wood 93.0 94.0 99.1 99.2 99.2 99.1 88.5 98.8 98.9 99.4
texture grid 99.6 99.7 99.9 98.2 99.8 98.3 93.7 95.7 96.8 98.8
carpet 84.2 97.4 97.0 98.7 95.8 100 97.5 99.9 99.9 100
tile 98.7 100 99.6 98.7 94.0 99.9 87.4 97.4 97.8 100
average 95.1 98.2 99.1 99.0 97.8 99.4 92.9 98.4 98.7 99.6
bottle 99.9 100 99.2 100 99.2 100 98.4 99.1 99.2 99.8
cable 81.9 97.9 91.8 99.5 93.3 99.4 97.2 97.1 97.0 98.9
capsule 88.4 95.5 98.5 98.1 96.4 95.9 99.0 87.5 89.5 94.1
hazelnut 83.3 98.4 100 100 96.8 100 99.1 99.4 99.6 100
object metal nut 88.5 97.3 98.7 100 98.1 99.8 98.1 96.2 96.5 99.7
pill 83.8 99.0 98.9 96.6 92.9 95.6 96.5 90.1 91.1 92.6
screw 84.5 89.9 93.9 98.1 93.5 92.2 98.9 97.5 97.7 93.9
toothbrush 100 100 100 100 99.4 91.7 97.9 100 100 98.6
transistor 90.9 99.8 93.1 100 97.4 99.8 96.5 94.4 94.3 99.8
zipper 98.1 98.3 100 99.4 100 97.4 94.1 98.6 98.9 96.6
average 89.9 97.6 97.4 99.2 96.7 97.2 97.6 96.0 96.4 97.4
Average of all 91.7 97.8 98.0 99.1 97.3 97.9 96.0 96.8 97.1 98.1
Figure 7: Visualization of defect localization and detection using the proposed method. (a),(f) Original images, (b),(g) Ground
truth maps, (c),(h) Predicted heat map images, (d),(i) Predicted maps, (e),(j) Localization results.
REFERENCES
Aytekin, C., Ni, X., Cricri, F., and Aksu, E. (2018). Cluster-
ing and unsupervised anomaly detection with l 2 nor-
malized deep auto-encoder representations. In 2018
International Joint Conference on Neural Networks
(IJCNN), pages 1–6. IEEE.
Bergmann, P., Fauser, M., Sattlegger, D., and Steger, C.
(2019). Mvtec ad–a comprehensive real-world dataset
for unsupervised anomaly detection. In Proceedings
VISAPP 2025 - 20th International Conference on Computer Vision Theory and Applications
338

of the IEEE/CVF conference on computer vision and
pattern recognition, pages 9592–9600.
Bogdoll, D., Nitsche, M., and Z
¨
ollner, J. M. (2022).
Anomaly detection in autonomous driving: A sur-
vey. In Proceedings of the IEEE/CVF conference on
computer vision and pattern recognition, pages 4488–
4499.
Cao, Y., Xu, X., Zhang, J., Cheng, Y., Huang, X., Pang,
G., and Shen, W. (2024). A survey on visual anomaly
detection: Challenge, approach, and prospect. arXiv
preprint arXiv:2401.16402.
Cohen, N. and Hoshen, Y. (2020). Sub-image anomaly
detection with deep pyramid correspondences. arXiv
preprint arXiv:2005.02357.
Defard, T., Setkov, A., Loesch, A., and Audigier, R. (2021).
Padim: a patch distribution modeling framework for
anomaly detection and localization. In International
Conference on Pattern Recognition, pages 475–489.
Dini., A., Mett
¨
anen., M., and Rahtu., E. (2024). Anomaly
detection and localization for images of running pa-
per web in paper manufacturing. In Proceedings of
the 19th International Joint Conference on Computer
Vision, Imaging and Computer Graphics Theory and
Applications - Volume 2: VISAPP, pages 678–685.
Dini, A. and Rahtu, E. (2022). Tpsad: Learning to detect
and localize anomalies with thin plate spline transfor-
mation. In 2022 26th International Conference on
Pattern Recognition (ICPR), pages 4744–4750. IEEE.
Dini, A. and Rahtu, E. (2023). Visual anomaly detec-
tion and localization with a patch-wise transformer
and convolutional model. In International Joint Con-
ference on Computer Vision, Imaging and Computer
Graphics Theory and Applications.
Dini, A. and Rahtu, E. (2024). Detecting anomalies in tex-
tured images using modified transformer masked au-
toencoder. In International Joint Conference on Com-
puter Vision, Imaging and Computer Graphics Theory
and Applications, pages 191–200. Science and Tech-
nology Publications (SciTePress).
Edstedt, J., B
¨
okman, G., Wadenb
¨
ack, M., and Felsberg, M.
(2024). Dedode: Detect, don’t describe—describe,
don’t detect for local feature matching. In 2024 In-
ternational Conference on 3D Vision, pages 148–157.
Hojjati, H., Ho, T. K. K., and Armanfard, N. (2024). Self-
supervised anomaly detection in computer vision and
beyond: A survey and outlook. Neural Networks, page
106106.
Kim, J.-H., Kim, D.-H., Yi, S., and Lee, T. (2021).
Semi-orthogonal embedding for efficient unsuper-
vised anomaly segmentation. arXiv preprint
arXiv:2105.14737.
Li, H. and Li, Y. (2023). Anomaly detection methods based
on gan: a survey. Applied Intelligence, 53(7):8209–
8231.
Liang, Y., Zhang, J., Zhao, S., Wu, R., Liu, Y., and Pan,
S. (2023). Omni-frequency channel-selection repre-
sentations for unsupervised anomaly detection. IEEE
Transactions on Image Processing.
Liu, J., Xie, G., Wang, J., Li, S., Wang, C., Zheng, F.,
and Jin, Y. (2024). Deep industrial image anomaly
detection: A survey. Machine Intelligence Research,
21(1):104–135.
Liu, T., Li, B., Zhao, Z., Du, X., Jiang, B., and Geng,
L. (2022). Reconstruction from edge image com-
bined with color and gradient difference for in-
dustrial surface anomaly detection. arXiv preprint
arXiv:2210.14485.
Liu, Z., Zhou, Y., Xu, Y., and Wang, Z. (2023). Simplenet:
A simple network for image anomaly detection and
localization. In Proceedings of the IEEE/CVF Con-
ference on Computer Vision and Pattern Recognition,
pages 20402–20411.
Mahalanobis, P. C. (2018). On the generalized distance in
statistics. Sankhy
¯
a: The Indian Journal of Statistics,
Series A (2008-), 80:S1–S7.
Mohammadi, B., Fathy, M., and Sabokrou, M. (2021). Im-
age/video deep anomaly detection: A survey. arXiv
preprint arXiv:2103.01739.
Palakurti, N. R. (2024). Challenges and future directions in
anomaly detection. In Practical Applications of Data
Processing, Algorithms, and Modeling, pages 269–
284. IGI Global.
Pirnay, J. and Chai, K. (2022). Inpainting transformer for
anomaly detection. In International Conference on
Image Analysis and Processing, pages 394–406.
Rippel, O. and Merhof, D. (2023). Anomaly detection for
automated visual inspection: A review. Bildverar-
beitung in der Automation: Ausgew
¨
ahlte Beitr
¨
age des
Jahreskolloquiums BVAu 2022, pages 1–13.
Roth, K., Pemula, L., Zepeda, J., Sch
¨
olkopf, B., Brox,
T., and Gehler, P. (2022). Towards total recall in
industrial anomaly detection. In Proceedings of the
IEEE/CVF conference on computer vision and pattern
recognition, pages 14318–14328.
Rudolph, M., Wehrbein, T., Rosenhahn, B., and Wandt,
B. (2023). Asymmetric student-teacher networks for
industrial anomaly detection. In Proceedings of the
IEEE/CVF winter conference on applications of com-
puter vision, pages 2592–2602.
Xie, G., Wang, J., Liu, J., Lyu, J., Liu, Y., Wang, C.,
Zheng, F., and Jin, Y. (2024). Im-iad: Industrial im-
age anomaly detection benchmark in manufacturing.
IEEE Transactions on Cybernetics.
Yang, J., Xu, R., Qi, Z., and Shi, Y. (2022). Visual anomaly
detection for images: A systematic survey. Procedia
computer science, 199:471–478.
Yi, J. and Yoon, S. (2020). Patch svdd: Patch-level svdd for
anomaly detection and segmentation. In Proceedings
of the Asian conference on computer vision.
Zagoruyko, S. (2016). Wide residual networks. arXiv
preprint arXiv:1605.07146.
Zavrtanik, V., Kristan, M., and Sko
ˇ
caj, D. (2021a). Draem-
a discriminatively trained reconstruction embedding
for surface anomaly detection. In Proceedings of the
IEEE/CVF international conference on computer vi-
sion, pages 8330–8339.
Zavrtanik, V., Kristan, M., and Sko
ˇ
caj, D. (2021b). Recon-
struction by inpainting for visual anomaly detection.
Pattern Recognition, 112:107706.
Zhang, Z. and Deng, X. (2021). Anomaly detection using
improved deep svdd model with data structure preser-
vation. Pattern Recognition Letters, 148:1–6.
Deep Local Feature Matching Image Anomaly Detection with Patch Adaptive Average Pooling Technique
339
