
Renewable Energy-Based Micro-Grid for Clean Electricity and Green
Hydrogen Production
Issa Zaiter
a
, Ahmad Mayyas
b
and Raed Jaradat
c
College of Engineering, Department of Management Science and Engineering, Khalifa University, Abu Dhabi, U.A.E.
Keywords:
Sustainability, Energy System Modeling, Linear Programming Optimization, Power Generation, Hydrogen
Production.
Abstract:
The expected rise in hydrogen use offers a chance to speed up the decarbonization of the power generation
sector. In this study, a linear programming optimization model is developed to determine the optimal technol-
ogy capacity for a power and hydrogen production system driven by 100% renewable energy serving 25,000
capita with a total annual power demand of 532 GWh and an annual hydrogen demand of 5255 tons. The
model aims to identify the optimal capacities of renewable energy sources and energy storage technologies to
minimize system costs while meeting the demand for electricity and hydrogen. The results show the optimal
system includes 59 MW of wind turbines, 630 MW of solar PV panels, 368 MW of polymer electrolyte mem-
brane electrolyzer, 126 MW of proton exchange membrane fuel cells, 163 MW of lithium-ion batteries, and
111,000 m
3
of hydrogen storage. The total annualized system cost is $182 million, with electricity priced at
$0.29 per kWh and green hydrogen at $5 per kg. By integrating hydrogen production with renewable energy-
based power generation, It is concluded that a 100% renewable energy-driven system can meet the power and
hydrogen demand for a sustainable community with the environmental benefit of zero carbon emissions, albeit
with a higher price for a unit of power.
1 INTRODUCTION
Climate change and resource depletion are significant
challenges to sustainable development, and renewable
energy offers potential solutions. However, the inter-
mittent nature of renewable energy sources empha-
sizes the need for reliable energy storage to ensure
a consistent power supply. Energy storage ensures
consistent power supply during demand fluctuations
and is essential for managing surpluses as renewable
energy is integrated into the grid (Rajeevkumar Urs
et al., 2024). Hydrogen is gaining potential in in-
dustrial decarbonization (Zaiter et al., 2024). In ad-
dition, hydrogen-based storage systems, along with
hybrid solutions combining hydrogen and batteries,
offer promising long-term storage options for renew-
able energy. These technologies can help address en-
ergy storage challenges and reduce power variability
in renewable systems (Zaiter et al., 2023), in addition
to reducing the energy storage cost (C¸ a
˘
gatay Iris and
a
https://orcid.org/0000-0001-7497-5773
b
https://orcid.org/0000-0002-0367-6503
c
https://orcid.org/0000-0002-1271-9202
Lam, 2021).
The purpose of this study is to assess the feasi-
bility of a 100% renewable energy-based system for
microgrids and hydrogen production to meet the en-
ergy needs of a 25,000-person community. The study
focuses on ensuring the community relies entirely on
clean energy to satisfy demand across all sectors. The
paper is structured as follows. Section 2 presents
the problem statement and mathematical formulation,
followed by Section 3 for results and discussion. Fi-
nally, Section 4 concludes the paper.
2 PROBLEM STATEMENT AND
MATHEMATICAL
FORMULATION
Two types of renewable power generation technolo-
gies: wind turbine power plants and solar photo-
voltaic power plants are assessed . It also incorporates
two energy storage technologies into the system. The
first is a lithium-ion battery (LIB) system. The second
is a hydrogen system consisting of a polymer elec-
Zaiter, I., Mayyas, A. and Jaradat, R.
Renewable Energy-Based Micro-Grid for Clean Electricity and Green Hydrogen Production.
DOI: 10.5220/0013138400003893
In Proceedings of the 14th International Conference on Operations Research and Enterprise Systems (ICORES 2025), pages 239-245
ISBN: 978-989-758-732-0; ISSN: 2184-4372
Copyright © 2025 by Paper published under CC license (CC BY-NC-ND 4.0)
239

trolyte membrane electrolyzer (PEMEC), a polymer
electrolyte membrane fuel cell (PEMFC), a hydrogen
compressor, and hydrogen storage.
Electricity demand is analyzed hourly based on a
year’s worth of historical data, showing peaks dur-
ing the day. In the absence of historical data, an as-
sumed hourly profile is used for hydrogen demand.
A linear programming optimization model is devel-
oped to identify the optimal power generation capac-
ity of each technology, allocate capacity for each en-
ergy storage technology, and outline the hourly en-
ergy storage dynamics, including charging and dis-
charging patterns and energy levels for each storage
technology.
The mathematical formulation, which includes the
parameters used, the decision variables, the objective
function, and the constraints of the model, is pre-
sented. For simplicity, an overview is also presented
(Fig. 1). Eight technologies are indexed by i where
i ∈ [1,8], representing wind, solar, hydrogen elec-
trolyzer, hydrogen storage, hydrogen fuel cell, battery
charging capacity, battery discharging capacity, and
battery storage capacity, respectively.
Parameters
N : Number of technologies (N = 8)
Z : Annualized system cost ($/year)
c
i
: Capital cost of i ($/kW) (i = 1,...,N)
f
i
: Fixed cost of i ($/kW/year) (i = 1,... , N)
v
i
: Variable cost of i ($/kWh) (i = 1,. ..,N)
w
i
: Capital recovery factor for i (i = 1,. .., N)
r : Project discount rate (%)
n
i
: Lifetime of technology i in years (i = 1, ... , N)
T : Total number of hours in the year (T = 8760)
h : Time step of one hour (h = 1)
Index
t : Number of hour in the year t ∈ {1,... ,T }
Decision Variables
The decision variables include each technology’s
installation capacity, hourly energy input/output, bat-
tery state of charge, and hydrogen storage level.
(i) Variables based on technology capacity:
X
i
: Installation capacity of i in (kW) ∀i = 1,.. . ,N
(ii) Variables based on hourly energy input and
output:
Y
it
: Energy flow (kWh) ∀i = 1,. .., N, ∀t = 1,... , T
B
t
: Battery charge at hour t (kWh) ∀t = 1, ... , T
H
t
: Hydrogen level at hour t (kWh) ∀t = 1,.. .,T
Objective Function
The objective function is to minimize the total annual-
ized costs of the system, as shown in Eq. (1), therefore
the total cost of the system and the levelized cost of
electricity. Total annualized system cost encompasses
three key components: capital cost, fixed operational
cost, and variable operational cost. The capital re-
covery factor ensures the system’s capital cost is dis-
tributed evenly over its lifetime. Eq. (2) shows the
capital recovery factor.
Minimize Z =
N
∑
i=1
(w
i
· c
i
+ f
i
) · X
i
+ v
i
·
T
∑
t=1
Y
it
!
(1)
where
w
i
=
r · (1 + r)
n
i
(1 + r)
n
i
− 1
∀i = 1,.. . ,N (2)
Constraints
Five distinct sets of constraints (C1 to C5) rep-
resent various elements: wind power, solar power,
hydrogen system (electrolyzer, storage, and fuel cell
system), battery operation, and power demand. Addi-
tionally, a non-negativity constraint (C6) is imposed.
C1: Wind Power
A model, given in Eq. (3), is used for the calculation
of wind power yield (Vargas et al., 2019).
Y
1t
=
(
1
2
·
ρ·A
w
P
w
· e
w
·V
3
t
· X
1
· h if Vi ≤ V
t
≤ Vo
0 otherwise
(3)
ρ : Air density (kg/m
3
)
A
w
: Swept area of the wind turbine blades (m
2
)
e
w
: Efficiency of the wind turbine (%)
P
w
: Rated power capacity of the wind turbine (W )
V
t
: Average wind speed at hour t (m/s)
h : Height of the wind turbine (m)
Vi : Cut-in speed of the wind turbine (m/s)
Vo : Cut-off speed of the wind turbine (m/s)
C2: Solar Power
Eq. (4) estimates solar energy production, account-
ing for key variables influencing the power output
(Pereira et al., 2024). It encompasses various factors,
ICORES 2025 - 14th International Conference on Operations Research and Enterprise Systems
240
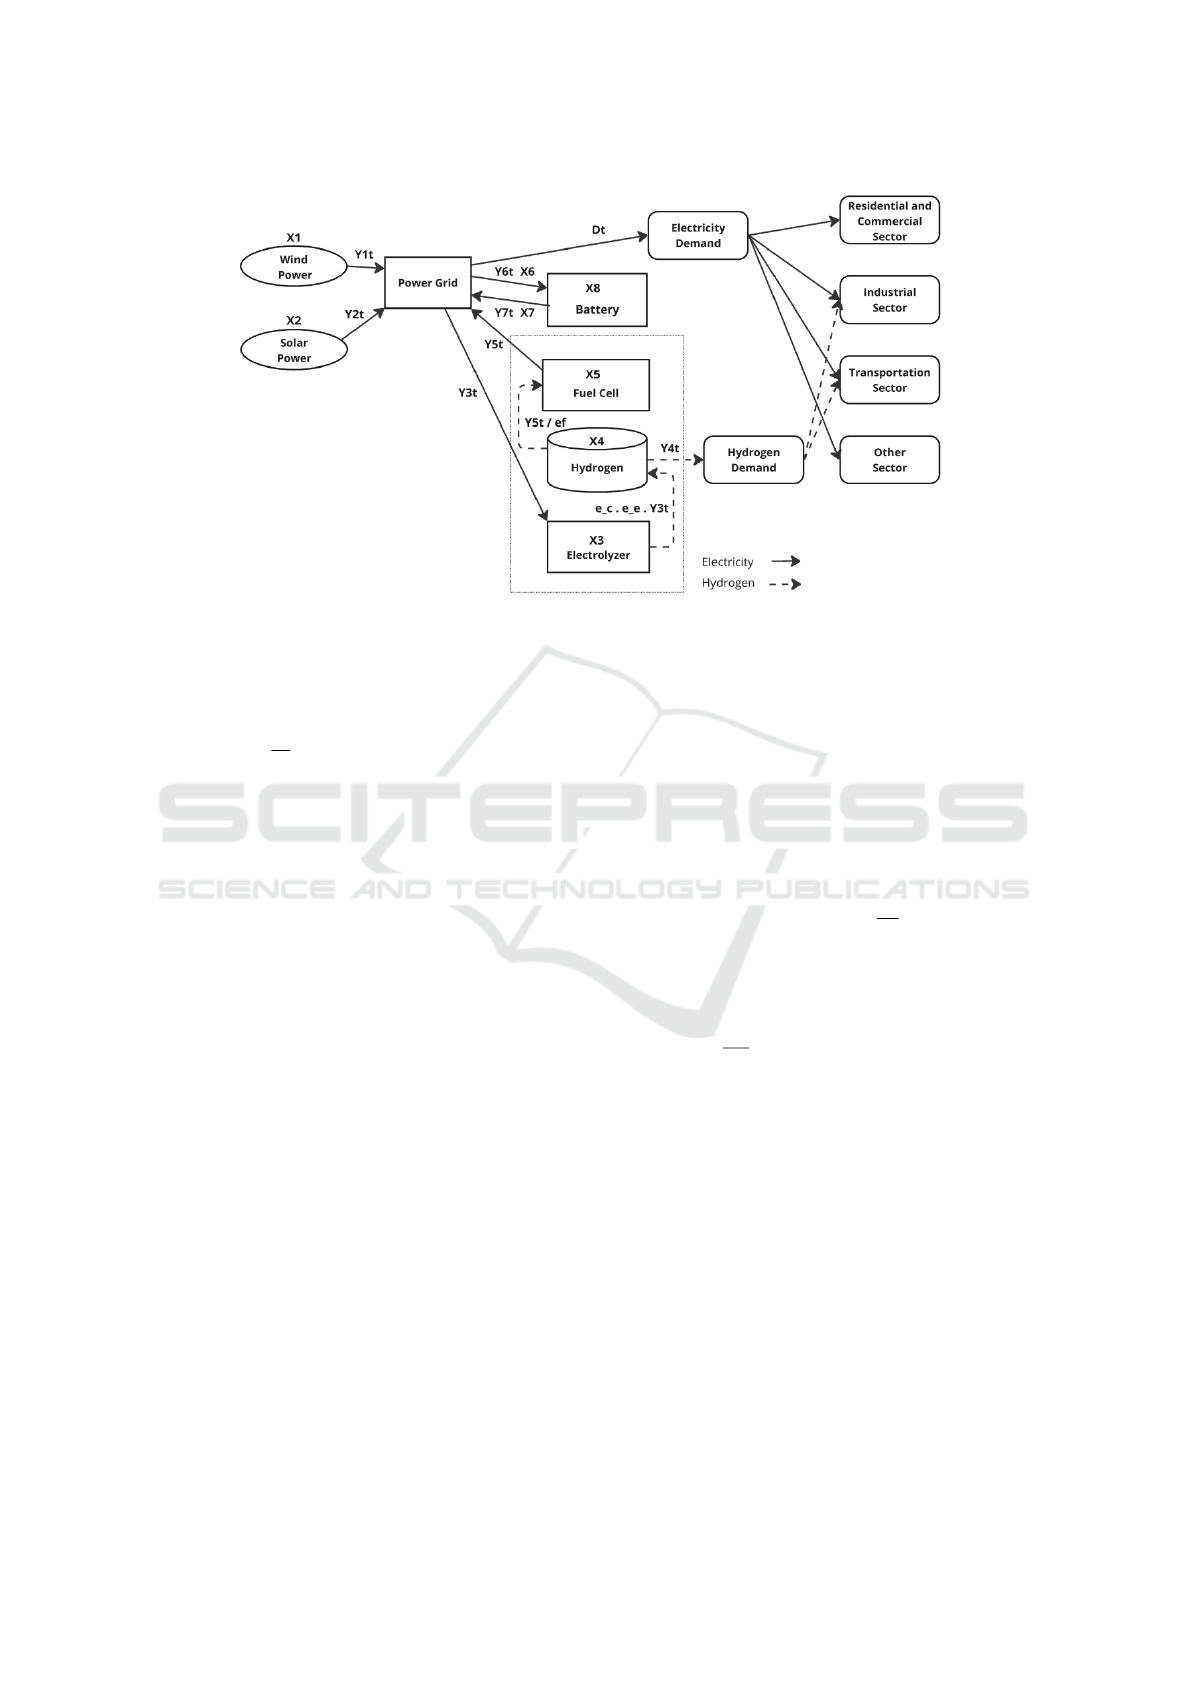
Figure 1: The model mathematical overview at a given time t.
such as solar panel area, nominal power rating, the ef-
ficiency of the photovoltaic panel, and the amount of
direct normal irradiance.
Y
2t
=
A
s
P
s
· e
s
· I
t
· X
2
∀t = 1,. ..,T (4)
A
s
: Area of the PV panel (m
2
)
P
s
: Rated power capacity of the PV panel (W )
e
s
: Efficiency of the PV panel (%)
I
t
: Average DNI at hour t (Wh/m
2
)
C3: Hydrogen Electrolyzer, Storage, and Fuel Cell
Equation (5) illustrates the hydrogen storage level
at the end of each hour (t). The electrolyzer and
fuel cell belong to the proton exchange membrane
(PEM) category. The hydrogen storage level at the
beginning of the first hour (t
0
) of the year is as-
sumed to be 10% of the hydrogen storage capacity
(H
0
= 0.10X
4
). The hydrogen storage level (kW h),
which can be converted to kg using the higher hydro-
gen heating value of 39.39-kilowatt hours per kilo-
gram, is determined by the sum of the accumulated
hydrogen level of the preceding hour (H
t−1
), and
the amount of hydrogen produced by the electrolyzer
—which is equal to the amount of energy that en-
ters the electrolyzer multiplied by the efficiency of the
electrolyzer and the efficiency of the hydrogen com-
pressor (e
c
· e
e
·Y
3t
)—minus the hydrogen feeding the
demand at a specific hour (Y
4t
), and minus the hydro-
gen energy used in the fuel cell—which equals the
power produced in the fuel cell divided by the effi-
ciency of the fuel cell (Y
5t
/e
f
).
Equation (6) presents the constraint that ensures
that the input power to the electrolyzer (Y
3t
) at any
hour (t) is less than or equal to the electrolyzer ca-
pacity (X
3
). Similarly, Eq. (7) demonstrates the con-
straint that ensures that the hydrogen storage level
(H
t
) does not exceed the hydrogen storage capacity
(X
4
) at any hour (t). Lastly, Eq. (8) presents the con-
straint that ensures the amount of hydrogen entering
the fuel cell (Y
5t
/e
f
) is always less than or equal to
the fuel cell capacity (X
5
).
H
t
= H
t−1
+ e
c
· e
e
·Y
3t
−Y
4t
−
Y
5t
e
f
, ∀t = 1,. ..,T
(5)
Y
3t
≤ X
3
· h ∀t = 1, ... ,T (6)
H
t
≤ X
4
· h ∀t = 1, ... ,T (7)
Y
5,t
e
f
≤ X
5
· h ∀t = 1, ... ,T (8)
e
e
: Efficiency of the electrolyzer (%)
e
c
: Efficiency of the hydrogen compressor (%)
e
f
: Efficiency of the fuel cell (%)
C4: Battery Operation
The model assumes LIBs for grid power storage.
LIBs are favored in power storage applications for
their high power and energy density (Kebede et al.,
2022).
Equation (9) presents the battery state of charge
(i.e., battery level) at the end of each hour (t). No
carryover storage level from the previous hour is as-
sumed, and therefore, the battery level at the begin-
ning of the first hour of the year is zero (B
0
= 0). The
Renewable Energy-Based Micro-Grid for Clean Electricity and Green Hydrogen Production
241

battery level is composed of the sum of the battery
level from a previous hour (B
t−1
), plus the amount of
energy entered the battery multiplied by the battery
efficiency (e
b
.Y
6t
), minus any energy feeding the grid
from the battery (Y
7t
). All are multiplied by a (1− f
d
)
factor to compensate for battery self-discharge.
Equation (10) presents the constraint that ensures
that the energy out from the power grid and charging
the battery (Y
6t
) does not exceed the battery charging
capacity (X
6
). Similarly, Eq. (11) demonstrates the
constraint that ensures the energy leaving the battery
and feeding the power grid (Y
7t
) does not exceed the
battery discharging capacity (X
7
).
Equation (12) correlates the battery charging ca-
pacity to the battery storage capacity using the bat-
tery C-rate factor, which measures how much the bat-
tery can charge/discharge relative to the battery’s full
capacity, expressed in C-number. For example, 2C
means that the battery needs half an hour to charge
fully, while 0.5C means that the battery needs two
hours to charge fully.
Similarly, Eq. (13) presents the battery discharge
capacity in terms of the battery storage capacity using
the battery C-rate factor. In addition, Eq. (14) pro-
vides a constraint to ensure the battery level at any
time t does not exceed the battery storage capacity
multiplied by the maximum state of charge the bat-
tery is allowed to reach. Similarly, Eq. (15) ensures
the battery level at any time will not drop below a
certain level and, therefore, allow the battery to reach
the maximum allowed depth of discharge only (Atieh
et al., 2018).
B
t
= (1 − f
b
) · (B
t−1
+ e
b
·Y
6t
−Y
7t
) ∀t = 1,. .., T
(9)
Y
6t
≤ X
6
· h ∀t = 1, ... ,T (10)
Y
7t
≤ X
7
· h ∀t = 1, ... ,T (11)
X
6
= f
c
· X
8
(12)
X
7
= f
c
· X
8
(13)
B
t
≤ f
soc
· X
8
· h ∀t = 1, ... ,T (14)
B
t
≥ (1 − f
dod
) · X
8
· h ∀t = 1, ... ,T (15)
f
b
: Battery self-discharge rate (% per hour)
e
b
: Battery efficiency (%)
f
c
: Battery C-rate
f
soc
: Maximum state of charge battery (%)
f
dod
: Maximum depth of discharge battery (%)
C5: Power Balance
The total power feeding the grid from various sources
at every hour t —wind (Y
1t
), solar (Y
2t
), fuel cells
(Y
5t
), and batteries (Y
7t
)—must balance with the
power to electricity demand (D
t
), hydrogen elec-
trolyzers (Y
3t
), and batteries (Y
6t
) as depicted in
Eq. (16).
Y
1t
+Y
2t
+Y
5t
+Y
7t
= D
t
+Y
3t
+Y
6t
∀t = 1,. ..,T
(16)
C6: Non-negativity
Constraints (17-20) refer to the non-negativity of the
decision variables.
X
i
≥ 0 ∀i = 1, . .., N (17)
Y
it
≥ 0 ∀i = 1, . .., N ∀t = 1,. ..,T (18)
H
t
≥ 0 ∀t = 1, . .., T (19)
B
t
≥ 0 ∀t = 1, . .., T (20)
3 RESULTS AND DISCUSSION
3.1 Implementation
The model is implemented in Python using Gurobi
Optimizer version 12.0.0. And compiled on a Dell
PC with 16.0 GB RAM and an 11th-gen Intel(R)
Core(TM) processor.
Table (1) summarizes the specific coefficients in-
tegrated into the objective function, and it serves as a
reference point, offering insights into the parameters
and values crucial to calculating the objective func-
tion and, consequently, the decision-making process
in the given context (Energy Inforamation Adminstra-
tion, 2022) (Cole et al., 2021).
Table 1: Coefficients employed in the objective function.
i 1 2 3 4 5 6 7 8
n
i
20 20 20 40 20 10 10 10
c
i
1718 1120 340 0.6 500 0 0 345
f
i
27.57 15.97 75.2 0.003 16 0 0 35
v
i
0 0 0.025 0 0.025 0 0 0.05
Vestas V150-4.2 MW wind turbine data is used
for the specification (Vestas, 2023). For data on wind
speed , and NASA/POWER CERES/MERRA2 na-
tive resolution hourly data is used from 01/01/2021
through 12/31/2021 for location in the United Arab
Emirates (UAE): latitude 24.5387 longitude 54.4223,
at 50 meters elevation (NASA Langley Research Cen-
ter, 2023).
In addition, the DNI data at a location in the UAE
is used: latitude 24.4682, longitude 54.3493 using an
online open access tool (Global Solar Atlas, 2023).
The solar panels’ specifications are based on the
Sharp PV panel ND-AH330 330 W poly-crystalline
silicon photovoltaic modules.
ICORES 2025 - 14th International Conference on Operations Research and Enterprise Systems
242

The UAE’s data hourly power consumption profile
is utilized, accounting for fluctuations in electricity
demand across various times of the day and through-
out the year (Bayanat, 2023) with a total annual power
demand of 532 GWh serving the 25,000 capita.
An annual demand for hydrogen of 5255 tons is
considered (275 tons annually for the transportation
sector to power 8,000 hydrogen fuel cell vehicles,
each driving around 6875 km per year based on 200
km mileage per 1 kg of hydrogen, and 4980 tons an-
nually for the industrial sector). While there is no spe-
cific hourly pattern for hydrogen consumption, a load
profile assuming a fixed hourly demand throughout
the year is generated.
The hydrogen storage is assumed to be pressur-
ized vessels, with the assumed capital cost of 0.6
$/kWh, equivalent to 20 $/kg (based on the higher
heating value of 39.39 kWh/kg of hydrogen) (Su-
san Schoenung, 2011). The hydrogen storage vol-
ume is determined based on the lower heating value
of hydrogen and a hydrogen density of 14.94 kg/m
3
,
under 200 bar pressure and 15
◦
C temperature. Ta-
ble (2) presents the various parameter values used in
the model.
Table 2: Coefficients employed in the constraints.
Parameter Value Unit
A
s
1.94 m
2
A
w
17671 m
2
e
b
90 %
e
c
85 %
e
e
73.5 %
e
f
55 %
e
s
17 %
e
w
35 %
f
b
0.0014 % per hour
f
c
1 -
f
soc
80 %
f
dod
80 %
J 5255 ton/year
K 532E6 kWh/year
p 5000 $/ton
P
s
330 W
P
w
4E6 W
r 7 %
m 1.225 kg/m
3
Vi 3 m/s
Vo 22.5 m/s
To enhance our understanding of the economic dy-
namics within the system, the levelized cost of elec-
tricity (LCOE) is calculated using the simple fixed
charge rate method. To determine the LCOE, the rev-
enue of selling the produced hydrogen is subtracted
from the total annualized system cost and divide it by
the total produced power in a year, as illustrated in
Eq. (21).
LCOE =
Z − p · J
K
(21)
where
p : Selling price of hydrogen ($/ton)
J : Total amount of hydrogen demand (ton/year)
K : Total amount of power demand (kWh/year)
3.2 Numerical Results
The results (Fig. 2) illustrate the hourly profiles of
power generation and storage technologies over a
weekly scale; it provides detailed insight into energy
supply and storage dynamics.
The solar power plant’s output aligns with the di-
rect normal irradiance profile. The results illustrate
how hydrogen production in the electrolyzer fluctu-
ates inversely to match daily and seasonal power de-
mand variations. During high-demand periods, such
as the summer season, hydrogen production decreases
due to increased electricity use for cooling. The out-
put of hydrogen feedstock remains consistent in ful-
filling hourly demand year-round.
The graphical representation illustrates the hourly
hydrogen storage level (Fig. 3) as a percentage of its
full capacity, showcasing the buffering capacity that
hydrogen can contribute to the overall system design.
The optimization problem results indicate that
meeting the annual power requirement of a commu-
nity of 25,000 people—totaling 532 GWh—and a
hydrogen demand of 5,255 tons can be achieved with
a fully renewable energy system. This system would
consist of 15 wind turbines, each with a 4 MW capac-
ity, and approximately 1.9 million solar PV panels,
each rated at 330 W. Additionally, it would require
368 MW polymer electrolyte membrane electrolyzer,
126 MW proton exchange membrane fuel cells, 163
MW lithium-ion batteries, and 111,000 m
3
hydrogen
storage. The projected annualized system cost for this
setup is $182 million, with a levelized cost of electric-
ity (LCOE) of $0.29 per kWh, based on a hydrogen
price of $5,000 per ton.
4 CONCLUSION
In conclusion, the integration of a hybrid Micro-Grid
system with hydrogen production, powered entirely
by renewable energy sources, presents a viable path-
way for advancing the decarbonization of the power
Renewable Energy-Based Micro-Grid for Clean Electricity and Green Hydrogen Production
243
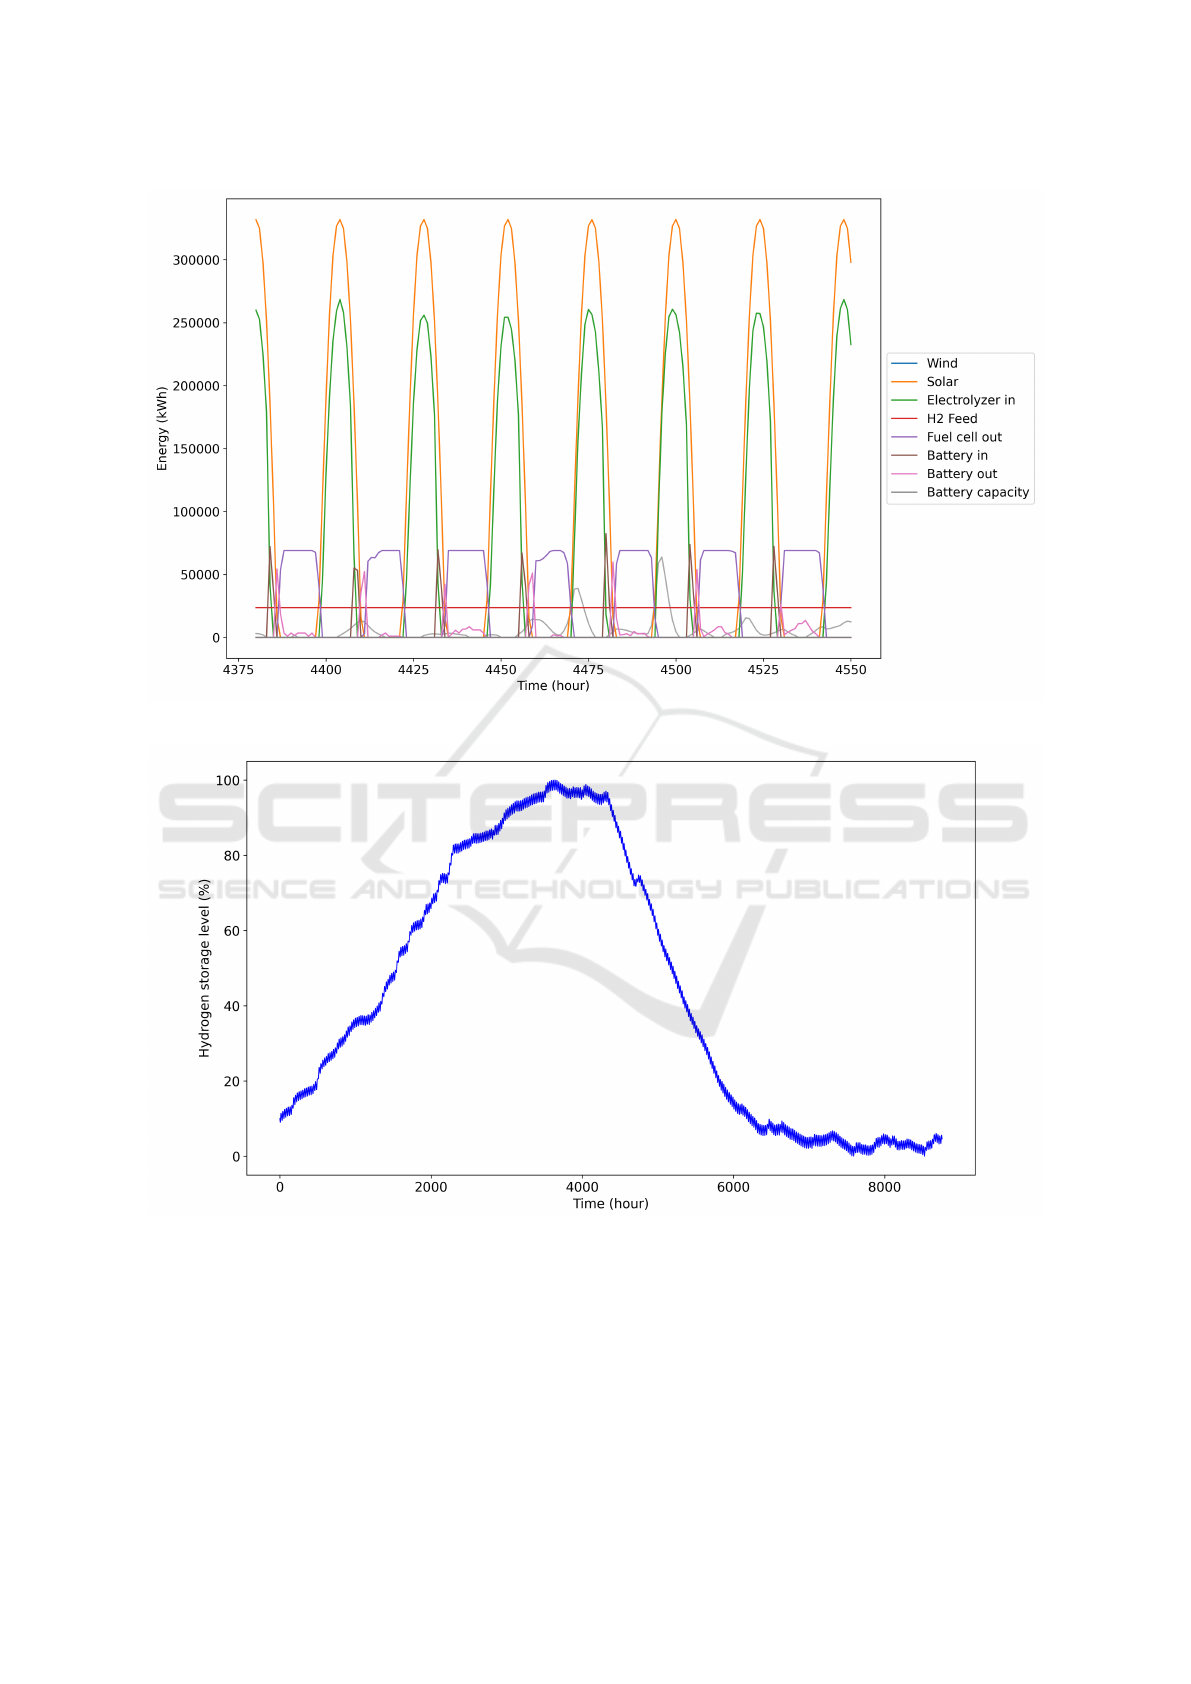
Figure 2: Hourly profile over the first week of July.
Figure 3: Hourly hydrogen storage level over a full year (% of full capacity).
generation sector. A linear programming optimiza-
tion model is used to identify the optimal capacities
for wind turbines, solar PV panels, electrolyzers, fuel
cells, batteries, and hydrogen storage necessary to
meet the energy and hydrogen demands of a commu-
nity of 25,000 people. The results demonstrate that a
system featuring 59 MW of wind turbines, 630 MW
of solar PV panels, 368 MW of polymer electrolyte
membrane electrolyzer, 126 MW of proton exchange
membrane fuel cells, 163 MW of lithium-ion batter-
ies, and 111,000 m
3
of hydrogen storage can fulfill
the annual requirements of 532 GWh of electricity
and 5,255 tons of hydrogen, with a total annualized
system cost of $182 million.
ICORES 2025 - 14th International Conference on Operations Research and Enterprise Systems
244

The findings underscore the benefits of such a sys-
tem, including the efficient use of surplus renewable
energy and minimized energy losses due to power cur-
tailment. The detailed hourly profiles of power gener-
ation, storage levels, and hydrogen production illus-
trate the system’s flexibility and its ability to adapt to
varying energy demands throughout the year. Dur-
ing periods of high electricity demand, particularly in
summer, the system effectively balances energy stor-
age and hydrogen production, maintaining a consis-
tent supply of hydrogen while managing electricity
needs.
Overall, this study confirms that a fully renew-
able energy system incorporating hydrogen produc-
tion and storage is not only feasible but also cost-
effective. By leveraging renewable resources and
advanced storage technologies, this system can sig-
nificantly contribute to the transition towards a low-
carbon energy future, providing a reliable and sustain-
able energy solution for communities.
REFERENCES
Atieh, A., Charfi, S., and Chaabene, M. (2018). Chap-
ter 8 - hybrid pv/batteries bank/diesel generator solar-
renewable energy system design, energy management,
and economics. In Yahyaoui, I., editor, Advances in
Renewable Energies and Power Technologies, pages
257–294. Elsevier.
Bayanat (2023). UAE Open Data Portal. https://bayanat.ae/
en. Accessed on February 21, 2024.
Cole, W., Frazier, A. W., and Augustine, C. (2021). Cost
projections for utility-scale battery storage: 2021 up-
date. Technical Report NREL/TP-6A20-79236, Na-
tional Renewable Energy Laboratory, Golden, CO.
Energy Inforamation Adminstration (2022). Annual en-
ergy outlook 2022 - assumptions. https://www.eia.
gov/outlooks/aeo/assumptions/pdf/table 8.2.pdf. Ac-
cessed on February 21, 2024.
Global Solar Atlas (2023). Interactive map for
solar and photovoltaic potential. https:
//globalsolaratlas.info/map?s=24.468231,54.349365,
10&c=23.870769,50.603027,7. Accessed on Febru-
ary 21, 2024.
Kebede, A. A., Kalogiannis, T., Van Mierlo, J., and
Berecibar, M. (2022). A comprehensive review of sta-
tionary energy storage devices for large scale renew-
able energy sources grid integration. Renewable and
Sustainable Energy Reviews, 159:112213.
NASA Langley Research Center (2023). Nasa power.
https://power.larc.nasa.gov/. Accessed on February
21, 2024.
Pereira, S., Canhoto, P., and Salgado, R. (2024). Develop-
ment and assessment of artificial neural network mod-
els for direct normal solar irradiance forecasting using
operational numerical weather prediction data. Energy
and AI, 15:100314.
Rajeevkumar Urs, R., Mussawar, O., Zaiter, I., Mezher, T.,
and Mayyas, A. (2024). Navigating the cost-efficiency
frontier: Exploring the viability of grid-connected en-
ergy storage systems in meeting district load demand.
Energy Conversion and Management, 299:117828.
Susan Schoenung, P. (2011). Economic analysis of large-
scale hydrogen storage for renewable utility appli-
cations. Unlimited Release SAND2011-4845, Lon-
gitude 122 West, Inc., Livermore, CA. 94551-0969.
Contract #1024882.
Vargas, S. A., Esteves, G. R. T., Mac¸aira, P. M., Bastos,
B. Q., Cyrino Oliveira, F. L., and Souza, R. C. (2019).
Wind power generation: A review and a research
agenda. Journal of Cleaner Production, 218:850–870.
Vestas (2023). Vestas v150-4.2 mw. https://www.vestas.
com/en/products/4-mw-platform/V150-4-2-MW.
Accessed on February 21, 2024.
Zaiter, I., Ramadan, M., Bouabid, A., El-Fadel, M., and
Mezher, T. (2023). Potential utilization of hydrogen
in the uae’s industrial sector. Energy, 280:128108.
Zaiter, I., Ramadan, M., Bouabid, A., Mayyas, A., El-Fadel,
M., and Mezher, T. (2024). Enabling industrial de-
carbonization: Framework for hydrogen integration in
the industrial energy systems. Renewable and Sustain-
able Energy Reviews, 203:114782.
C¸ a
˘
gatay Iris and Lam, J. S. L. (2021). Optimal energy
management and operations planning in seaports with
smart grid while harnessing renewable energy under
uncertainty. Omega, 103:102445.
Renewable Energy-Based Micro-Grid for Clean Electricity and Green Hydrogen Production
245
