
Exploring Extended Reality (XR) in Teaching AI:
A Comparative Study of XR and Desktop Environments
Miguel A. Feijoo-Garcia
1 a
, Yiqun Zhang
1 b
, Yiyin Gu
2 c
, Alejandra J. Magana
1 d
,
Bedrich Benes
2 e
and Voicu Popescu
2 f
1
Department of Computer and Information Technology, Purdue University,
401 N. Grant St., West Lafayette, IN 47907, U.S.A.
2
Department of Computer Science, Purdue University, 305 N. University St., West Lafayette, IN 47907, U.S.A.
{mfeijoog, zhan2897, gu251, admagana, bbenes, popescu}@purdue.edu
Keywords:
Extended Reality, Educational Technology, Immersive Learning, User Experience, Human-Computer
Interaction.
Abstract:
Artificial Intelligence (AI) concepts are abstract and difficult to understand. This paper explores how immer-
sive technologies, such as extended reality (XR), can offer interactive learning experiences that can signif-
icantly enhance the educational outcomes of teaching fundamental concepts in artificial intelligence. This
comparative study analyzes the effectiveness of an XR environment for introducing Neural Networks and
Handwritten Digit Recognition by comparing the engagement, user experience, and learning outcomes of stu-
dents using XR headsets (Meta Quest 3) to those relying on a traditional desktop setup. Engagement, usability,
and user satisfaction were measured using standardized metrics, including the System Usability Scale (SUS),
Immersion Presence Questionnaire (IPQ), User Satisfaction Questionnaire (USQ), and Net Promoter Score
(NPS), on a diverse group of 56 participants. The findings indicate that the participants in the XR group
reported higher levels of engagement and immersion than those in the desktop setting. Furthermore, they
reported higher levels of satisfaction. They were more likely to recommend the experience for educational
reasons compared to the users of the Desktop group, suggesting that XR technology increases motivation and
may thus improve learning. Nevertheless, XR users recognized restrictions like unease or lack of familiarity
with immersive technologies. In addition, this study highlights how XR can help transform science, technol-
ogy, engineering, and mathematics education.
1 INTRODUCTION
Artificial Intelligence (AI) can be abstract and diffi-
cult to understand for learners. Modern AI generally
involves deep neural networks and natural that have
distinct particular complexities, characteristics, lim-
itations, and principles (Pham and Sampson, 2022).
Consequently, users cannot easily see or compre-
hend the internal operations of the algorithms, caus-
ing a gap between the technology and its users (Kim,
2023), adding to the difficulty in facilitating teaching
and learning processes of systemic and critical think-
ing toward AI concepts from a holistic perspective
a
https://orcid.org/0000-0001-5648-9966
b
https://orcid.org/0009-0000-0958-0943
c
https://orcid.org/0009-0004-6612-0563
d
https://orcid.org/0000-0001-6117-7502
e
https://orcid.org/0000-0002-5293-2112
f
https://orcid.org/0000-0002-8767-8724
(Feij
´
oo-Garc
´
ıa et al., 2021). Due to the abstract na-
ture of AI, students may not feel prepared to interact
with it, leading to a lack of confidence (Chen et al.,
2020; Pedr
´
o, 2020). Considering all these educational
challenges when teaching and learning AI, it is neces-
sary to think of new innovative educational methods
to facilitate learners, demystifying the complexity of
AI and helping them engage with its concepts learner-
centered.
Technology is a driving force for better education
(Guo et al., 2021; Zwoli
´
nski et al., 2022). Emerg-
ing technologies such as extended reality (XR) have
helped create learner-centered environments in edu-
cation (Rangel-de L
´
azaro and Duart, 2023; Kuleto
et al., 2021). XR combines computer software with
wearable devices to produce interactive settings that
blend real and digital components (Gu et al., 2024).
Interactions can occur through immersive headsets,
augmented reality (AR) glasses, or mobile devices
472
Feijoo-Garcia, M. A., Zhang, Y., Gu, Y., Magana, A. J., Benes, B. and Popescu, V.
Exploring Extended Reality (XR) in Teaching AI: A Comparative Study of XR and Desktop Environments.
DOI: 10.5220/0013141000003912
Paper published under CC license (CC BY-NC-ND 4.0)
In Proceedings of the 20th International Joint Conference on Computer Vision, Imaging and Computer Graphics Theory and Applications (VISIGRAPP 2025) - Volume 1: GRAPP, HUCAPP
and IVAPP, pages 472-482
ISBN: 978-989-758-728-3; ISSN: 2184-4321
Proceedings Copyright © 2025 by SCITEPRESS – Science and Technology Publications, Lda.

(Kosko et al., 2021). XR includes AR, virtual re-
ality (VR), and mixed reality (MR) (Kharvari and
Kaiser, 2022; Jagatheesaperumal et al., 2024). AR
integrates real and digital objects, VR offers sim-
ulated environments, and MR facilitates interaction
between physical and digital elements (Ferreira and
Qureshi, 2020). The affordability and efficiency of
XR make it a practical and versatile tool for edu-
cation, further demonstrating its potential in educa-
tion (Kharvari and Kaiser, 2022). XR applications
span various fields in education, including STEM,
architecture, management, medicine, and art (Zhang
et al., 2024; Chiang and Liu, 2023; Kharvari and
Kaiser, 2022; Zwoli
´
nski et al., 2022; L
´
opez-Ojeda
and Hurley, 2021; Koukopoulos et al., 2022). As
a tool that promotes educational sustainability, XR
has gained worldwide interest in research and prac-
tice (Guo et al., 2021).
Using XR in education is beneficial as it can fos-
ter soft skills such as teamwork, problem-solving,
and technical skills (Gu et al., 2024; Guilbaud et al.,
2021a). More benefits include enhanced content
sharing and knowledge acquisition (Idrees et al.,
2022), personalized learning experiences (Fern
´
andez-
Batanero et al., 2024), and better support for students
with special needs (Meccawy, 2022). However, its
implementation has limitations, including the lack of
motivation or technical ability among instructors, cy-
bersickness, and the high costs of purchasing virtual
learning platforms (Zhang et al., 2024; Obeidallah
et al., 2023).
As XR technology evolves, educators are encour-
aged to adopt it to create engaging and effective learn-
ing experiences (Guilbaud et al., 2021a). Immer-
sive technologies like VR are increasingly utilized in
computer science education, which involves teach-
ing the fundamentals of abstract concepts in STEM
fields (Zhang et al., 2024). Nevertheless, the teaching
process must be incremental, integrating new topics
while reinforcing prior knowledge and involving new
technologies as instructional resources.
Different questionnaires are related to the effec-
tiveness and user experience of educational tools.
System Usability Scale (SUS) (Grier et al., 2013) is
often used to evaluate usability and satisfaction and to
identify the strengths and areas to improve (Romeike,
2019). Similarly, the User Satisfaction Question-
naire (USQ) emphasizes how usable it is and what
the user’s experience is. The Immersion Presence
Questionnaire (IPQ) (Schwind et al., 2019) is used to
determine the immersive quality of virtual environ-
ments, and the Net Promoter Score (NPS) (Baquero,
2022) provides us with evidence of student advocacy
and satisfaction. Overall, the results of these assess-
ments help optimize immersive technologies to en-
hance engagement and improve learning experiences
and outcomes in computer science education and re-
lated fields (Kara et al., 2021).
Immersive technologies and simulation-based ex-
periences can be incorporated to increase student en-
gagement and the understanding of complex con-
cepts. This stems further to interactive virtual expe-
rience encouraging active participation and practice,
resulting in better learning outcomes (Zhang et al.,
2024). That is, evidence-based decision-making is
important for improving design and addressing chal-
lenges (Brown et al., 2010), ensuring decisions are
grounded in facts rather than assumptions (Feijoo-
Garcia et al., 2024). Therefore, the following question
arises: What is the effectiveness of XR environments in
enhancing student engagement and user satisfaction
compared to traditional desktop learning setups?
2 METHODS
2.1 Context and Participants
This study is based on the survey responses collected
from N=56 participants on how they experienced an
educational approach that involved an XR environ-
ment or a traditional desktop setup to introduce Neu-
ral Networks (NN) and Handwritten Digit Recogni-
tion. The study was carried out between the spring
and summer of 2024, using a questionnaire to col-
lect demographic information and assess user experi-
ences in VR and XR, including measuring familiarity
with technologies such as NN and Handwritten Digit
Recognition. In addition, another questionnaire was
provided to participants that included different scales
to assess their experiences in the XR and desktop en-
vironments, which were chosen because of their ef-
fectiveness in measuring user experience from differ-
ent perspectives. These diverse lenses ensure that the
overall analysis captures comprehensive user insights.
Thus, the questionnaire included:
• System Usability Scale (SUS). Evaluates user
satisfaction with the XR experience, covering us-
age frequency, perceived complexity, ease of use,
need for technical support, function integration,
consistency, learning curve, and user confidence
and comfort. The questionnaire comprises ten el-
ements, rated on a scale [1, 5].
• Immersion Presence Questionnaire (IPQ). As-
sesses participants’ immersion and satisfaction in
the XR environment, focusing on visual qual-
ity, interaction, realism, disconnection from sur-
Exploring Extended Reality (XR) in Teaching AI: A Comparative Study of XR and Desktop Environments
473

roundings, presence, and overall engagement. It
includes twelve elements, rated on a scale [−3, 3].
• User Satisfaction Questionnaire (USQ). Mea-
sures user satisfaction in the XR environment, em-
phasizing usability, functionality, and overall ex-
perience through three elements, rated on a scale
[1, 5].
• Net Promoter Score (NPS). Assesses partici-
pants’ likelihood or willingness to recommend the
experience to others, reflecting the users’ over-
all satisfaction and user advocacy regarding their
experience with the system posed. This score is
rated on a scale from [0, 10].
The age of the participants ranged from 18 to 32
years (M = 22.2, SD = 3.9) and were 67.9% male and
38% female. Many reported limited VR headset us-
age, with 14 (25.0%) having never used one and 17
(30.4%) using it only once. Similarly, 32 participants
(57.1%) had never used XR, and 13 (23.2%) had used
it once. Most of the participants were Computer Sci-
ence majors (41, 73.2%), with the majority being un-
dergraduate students (30, 53.6%).
In the XR group (29, 51.8%), most were male
(18, 62.1%), undergraduate students (20, 68.9%), and
in Computer Science (18, 62.1%). Many had used
VR headsets only once (11, 37.9%), and many had
never used XR (15, 51.7%). While 17 participants
(58.6%) were familiar with Neural Networks (NN),
18 (62.1%) were unfamiliar with Handwritten Digit
Recognition. In the Desktop group (27, 48.2%), on
the other hand, there was also a male majority (20,
74.1%), with some being undergraduate students (10,
37.1%) and studying Computer Science (23, 85.2%).
Like the XR group, many had limited VR headset
experience, with 8 participants (29.6%) using them
fewer than five times and another 8 (29.6%) never
using them. Familiarity with NN and Handwritten
Digit Recognition was relatively balanced, with 13
participants (48.1%) familiar with Handwritten Digit
Recognition and 14 (51.9%) with NN (see Table 1).
2.2 Data Collection
Data collection sessions lasted up to one hour and in-
volved no more than two participants at a time. Upon
arrival, participants completed a consent form. De-
pending on the experimental condition, they were pro-
vided with either VR headsets (i.e., Meta Quest 3) or
a laptop (see Figure 1). All participants used tablets
to respond to demographic, pre-test and post-test
questionnaires, with confidentiality ensured through
unique numeric identifiers assigned to each partici-
pant.
Table 1: Participant Demographics and Characteristics.
Variable XR (n=29) Desktop (n=27) Total (N = 56)
Gender
Male 18 (62.1%) 20 (74.1%) 38 (67.9%)
Female 11 (37.9%) 7 (25.9%) 18 (32.1%)
Other 0 (0%) 0 (0%) 0 (0%)
VR Headset Usage
Frequently 2 (6.9%) 2 (7.4%) 4 (7.1%)
<5 times 7 (24.1%) 8 (29.6%) 15 (26.8%)
>5 times 3 (10.3%) 3 (11.1%) 6 (10.7%)
Never 6 (20.7%) 8 (29.6%) 14 (25%)
Once 11 (37.9%) 6 (22.2%) 17 (30.4%)
XR Usage
Frequently 1 (3.5%) 2 (7.4%) 3 (5.4%)
<5 times 4 (13.8%) 1 (3.7%) 5 (8.9%)
>5 times 1 (3.5%) 2 (7.4%) 3 (5.4%)
Never 15 (51.7%) 17 (62.9%) 32 (57.1%)
Once 8 (27.6%) 5 (18.5%) 13 (23.2%)
Major
Computer Sc. 18 (62.1%) 23 (85.2%) 41 (46.4%)
Data Science 3 (10.3%) 1 (3.7%) 4 (7.1%)
Computer Tech. 0 (0%) 1 (3.7%) 1 (1.8%)
Other 8 (27.6%) 2 (7.4%) 10 (17.9%)
Role
Undergraduate 20 (68.9%) 10 (37.1%) 30 (53.6%)
Graduate 9 (31.1%) 17 (62.9%) 26 (46.4%)
Familiarity with
Neural Networks
No 12 (41.4%) 13 (48.1%) 25 (44.6%)
Yes 17 (58.6%) 14 (51.9%) 31 (55.4%)
Familiarity with
Handwritten Digit
Recognition
No 18 (62.1%) 14 (51.9%) 32 (57.1%)
Yes 11 (37.9%) 13 (48.1%) 24 (42.9%)
Note: Any discrepancies in percentages are due to rounding.
Values represent frequencies with percentages in parentheses.
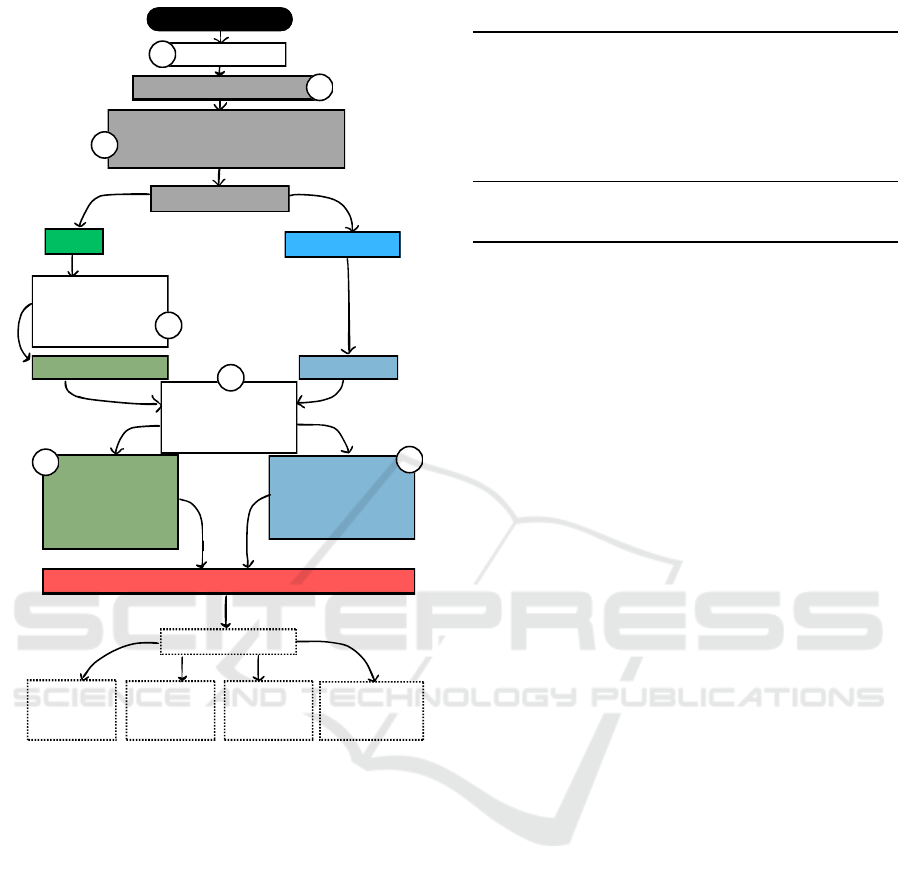
The steps in this study are as follows (see Fig-
ure 2): (1) Participants take time to review and sign
the consent form [S1]; (2) Participants use the tablets
to answer the demographic questionnaire [S2]; (3)
Participants use the provided tablets to answer the
pre-test questionnaire [S3]; (4) Six educational slides
were provided to teach participants how to use the
headset to complete the study [VR headset users only]
[S4]; Participants wear the headset to learn the topic.
[VR headset users only]; (5) Participants use the des-
ignated laptop to learn the topic [Desktop users only];
Participants respond during the intervention to 6 mul-
tiple choice questions [VR headset and Desktop users]
[S5]; (6) Participants use tablets to answer the post-
test questionnaire [S6].
The research team guided the participants through
each procedure, with the preparation phase lasting 15
minutes, the learning phase lasting roughly 15 min-
utes, and the final step lasting 5 to 10 minutes. The
team was available to attend and answer all inquiries
throughout the experimental session. The start times
for the learning phase were staggered by 10 min-
HUCAPP 2025 - 9th International Conference on Human Computer Interaction Theory and Applications
474
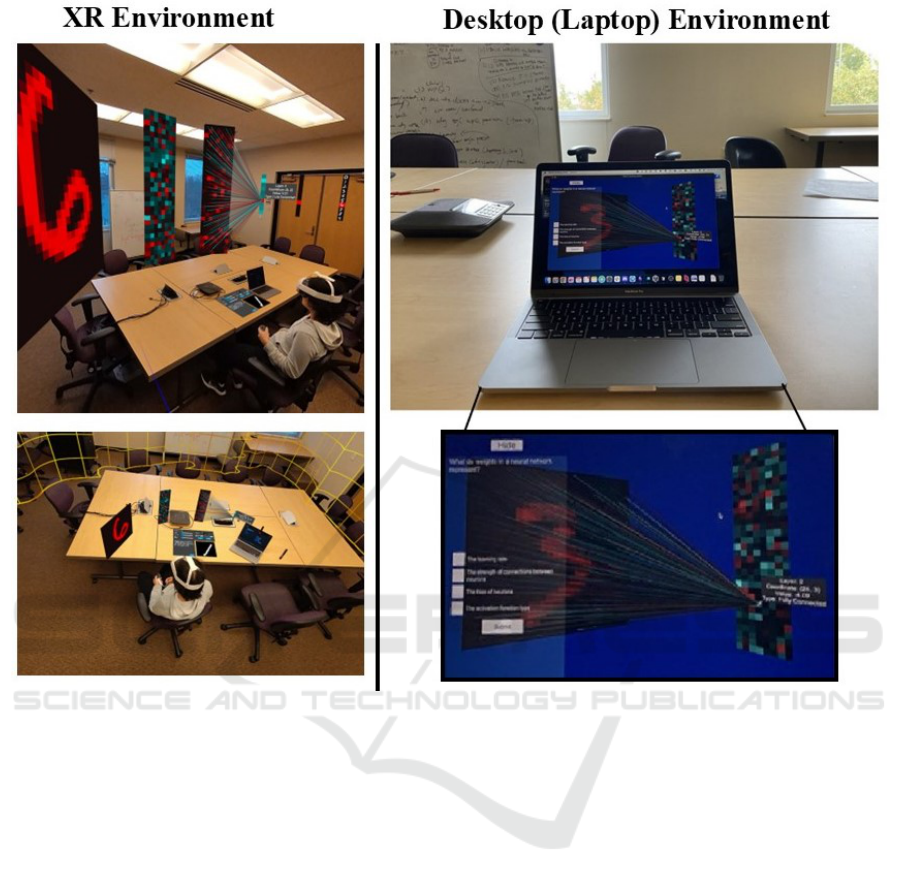
Figure 1: XR and Desktop/Laptop Environments used for the experimental approach.
utes for the two participants using VR headsets in
the same session to minimize distractions during ver-
bal response questions. The participants then com-
pleted a post-questionnaire with 26 items from the
four metrics mentioned —the XR group responded to
all the items of the four metrics; the desktop group
responded to 14 questions, with three out of the four
metrics, excluding the IPQ. Figure 2 depicts the out-
line of the lesson design for this comparative study.
2.3 Ethical Considerations
This study has been approved by Purdue University’s
Institutional Review Board under IRB-2024-57. A
four-page consent form was designed to inform par-
ticipants about the purpose, duration, confidentiality,
benefits, risks, and other pertinent information of the
study. If they chose to participate, the participants
signed and dated the consent form first. Participants
could also withdraw at any time.
3 RESULTS
3.1 Lesson Design
In this study, a lesson was designed on the founda-
tional concepts of Neural Networks and Handwritten
Digit Recognition. This study compared the perfor-
mance of two groups of participants exposed to the
same lesson in two settings (i.e., XR and Desktop en-
vironments), using the MNIST data set trained on a
fully connected network (Deng, 2012). Participants
began by answering five out of 14 multiple choice
questions assessing their prior knowledge of Neural
Networks.
These questions covered introductory concepts
such as the definition of a Neural Network, the roles
and functions of nodes and layers, and data processing
sequences. Participants also demonstrated an under-
standing of concepts/practices like supervised and un-
supervised learning, the impact of network architec-
ture on energy consumption, and the significance of
Exploring Extended Reality (XR) in Teaching AI: A Comparative Study of XR and Desktop Environments
475
Participant Arrival
Consent Form
Demographic Questionnaire
Pre-test Questionnaire / Prior Knowledge
- 5 conceptual introductory multiple
choice questions
Experimental Condition
XR Group
Desktop Group
Educational Slides on
Tablets - 6 slides about
features of the XR
headset
XR Headset Learning
Laptop Learning
Interaction with the System
and Respond to Multiple
Choice Questions
[6 questions]
XR Post-test
Questionnaire / Surveys
on System Usability, User
Satisfaction, Immersive
Presence, and Likelihood
of Recommendation
Desktop Post-test
Questionnaire / Surveys on
System Usability, User
Satisfaction, and Likelihood
of Recommendation
Study Completion
Additional Details
Preparation: 15
minutes on
average
Learning: 15
minutes
Post-test: 5-10
minutes
For VR users:
staggered start times
of 10 minutes
between participants
S1
S2
S3
S4
S6
S6
S5
Figure 2: Outline of the Lesson Design for the Comparative
Study between XR and Desktop Environments.
hardware components like CPUs, GPUs, and TPUs.
For example, participants faced questions like What
is a layer in a neural network? and How are GPUs,
CPUs, and TPUs important for neural networks or
CNNs? All questions were closed-ended, either mul-
tiple choice or True / False, to gauge the foundational
knowledge of neural network theory.
Further analysis of the 14 multiple choice ques-
tions showed a generally high level of understanding
by the participants, with an average of 80.7% cor-
rect. Most of the questions were correctly answered,
but some had rates below 60%, indicating knowledge
gaps-topics that need more explanation to help under-
stand.
Moreover, an independent samples t-test com-
pared mean differences between the XR and Desk-
top groups regarding “correctness” and “time spent
responding to questions” (in seconds). Welch’s test
was employed due to the lack of equal variances, as
Table 2: Independent Samples T-Test.
t df p
Mean Difference
SE Difference
Cohen’s d
SE Cohen’s d
Correctness -.6 54 .7 .1 .3 .2 .3
Duration -4.4 34.7 .0 -47.1 10.8 -1.2 .3
Note. For all tests, the alternative hypothesis specifies that group
Desktop is less than group XR.
Note. Welch’s t-test.
indicated by Levene’s test for “correctness” (refer to
Table 2).
Regarding correctness, both groups had similar
mean scores (4.2 for XR and 4.1 for Desktop) with
no significant difference (p = .7), indicating compa-
rable prior knowledge of Neural Networks. Never-
theless, the period taken by the XR group to com-
plete the pre-questionnaire was significantly longer
than the Desktop group (33.4 seconds versus 68.7 sec-
onds; p < .001). This extended duration might result
from XR participants’ lack of familiarity with Neural
Networks —the need for much more cognitive effort.
On the other hand, during the intervention, the
lesson asked six multiple-choice questions assessing
learning outcomes. These questions focused on foun-
dational concepts related to Neural Networks and
Handwritten Digit Recognition, for example, about
How many input neurons are there in network han-
dling MNIST images, and What do weights in the neu-
ral network represent. Some of the topics addressed
in other questions were What ReLU does when given
a negative input and What ReLU is used to break in?,
and Which of the predefined test cases (0, 1, 3, and 8)
has the least confidence in prediction?. These ques-
tions assessed student understanding and interest in
the material presented in the lesson.
Table 3 depicts the scores for the multiple choice
questions during the intervention. The XR group
scored a mean of 4.2 (SE Mean = .2, SD = 1.2), in-
dicating high score variability, with skewness of -1.2,
suggesting more participants scored above the mean.
The scores varied from 1.0 to 6.0. In contrast, the
Desktop group got a mean score of 4.4 (SE Mean
=.1, SD =.8), indicating less variability and more con-
sistent performance. The skewness of zero indicates
a near-normal distribution, which means the scores
are uniformly distributed around the mean. In addi-
tion, the kurtosis of -.4 indicates fewer extreme val-
ues, which means fewer high or low scores, result-
ing in more consistent performance. Their scores
ranged from 3.0 to 6.0. Although the Desktop group
HUCAPP 2025 - 9th International Conference on Human Computer Interaction Theory and Applications
476

Table 3: Multiple Choice Questions Scores.
Statistic XR (n=29) Desktop (n=27)
Mean 4.2 4.4
SE Mean .2 .1
Std. Deviation 1.2 .8
Skewness -1.2 0
SE Skewness .4 .4
Kurtosis 1.2 -.4
SE Kurtosis 1.9 1.9
showed higher average performance and less variabil-
ity, the XR group’s lower mean score and more sig-
nificant variability may stem from their unfamiliarity
with XR technology. As participants become more
accustomed to XR, their performance may improve,
potentially narrowing the gap with the Desktop group.
Furthermore, user engagement was assessed in
both the XR and desktop contexts, with the session
time metric considered an important factor in analyz-
ing user engagement and persistence. Extended peri-
ods demonstrate a deeper engagement with the topic
matter.
In addition, Table 4 depicts the results on Ses-
sion Time. Using the XR headset, the XR group had
a mean session time of 723.7 seconds (SE Mean =
33.4, SD = 179.8), indicating considerable variability.
The skewness of -.2 suggests a near-normal distribu-
tion, meaning that session times are mostly balanced
around the average. Most of the participants had ses-
sion times close to the mean, reflecting a balanced ex-
perience. Furthermore, a kurtosis of -.9 suggests that
the distribution is slightly flatter, with fewer extreme
values and more consistent session times. That is, this
kurtosis suggests that there was a more uniform ex-
perience among the XR group than among the other
group. The session lasted 359.0-1009.0 seconds.
However, the mean session duration for desktop
users was 578.5 seconds (SE mean = 40.1), show-
ing greater variability due to a standard deviation of
212.2 seconds, suggesting that the duration of the ses-
sions varied significantly within the desktop group,
with certain participants spending more or less time
Table 4: Session Time (in seconds).
Statistic XR (n=29) Desktop (n=27)
Mean 723.7 578.5
SE Mean 33.4 40.1
Std. Deviation 179.8 212.2
Skewness -.2 .8
SE Skewness .4 .4
Kurtosis -.9 1.5
SE Kurtosis 1.9 1.9
compared to others. This indicates that most of the
participants finished their sessions on time, while a
small number took significantly longer, resulting in
a skewed distribution to the right. The skewness
of .8 indicates a right-skewed distribution, meaning
most session times were shorter, with a few much
longer outliers. Most desktop users had shorter ses-
sion times, but a few participants took much longer
than the average. Furthermore, a kurtosis of 1.5 in-
dicates more noticeable tails, implying more extreme
session times, both shorter and longer, resulting in in-
creased variability during the intervention. The ses-
sion times ranged from 239.0 to 1237.0 seconds.
3.2 Evaluation: Usability and
Satisfaction
The results show that participants using the XR set-
ting reported higher levels of usability, satisfaction,
and likelihood to recommend the system than those
using the Desktop version. The XR group (n = 29)
experienced consistently positive interactions, while
Desktop users (n = 27) faced more usability chal-
lenges and lower satisfaction levels. Detailed find-
ings for each scale assessing user experiences in both
environments focused on Neural Networks and Hand-
written Digit Recognition are provided.
The results of the System Usability Scale (SUS)
(Grier et al., 2013) indicate that users found the XR
system more engaging and easier to navigate. For
instance, the statement “I think that I would like to
use this system frequently” (SUS1) received a mean
score of 3.3 in the XR group versus 3.2 in the Desk-
top group, showing a stronger inclination to use the
XR system. Although both groups rated the statement
“I thought the system was easy to use” (SUS3) simi-
larly, the Desktop group exhibited greater variability,
reflecting inconsistent experiences.
Moreover, as indicated in Table 5, the XR group
achieved an average SUS score of 60.1, which aligned
closely with the standard norm of 68. This shows that
the perceived usability was acceptable, yet it suggests
that there is still room for enhancement. Nonethe-
less, the average SUS score for the Desktop group of
57.9 indicated increased challenges. This also indi-
cates that while both systems require enhancements,
the XR system is showing superior performance in
terms of overall usability compared to the Desktop
system.
The User Satisfaction Questionnaire (USQ) re-
sults indicate high overall satisfaction, particularly
among XR participants, who reported greater satis-
faction than Desktop users. The XR group achieved
a mean score of 4.1 for “satisfaction with the XR ex-
Exploring Extended Reality (XR) in Teaching AI: A Comparative Study of XR and Desktop Environments
477

Table 5: System Usability Scale.
SUS1
SUS2
SUS3
SUS4
SUS5
SUS6
SUS7
SUS8
SUS9
SUS10
Descriptive Statistics: XR (n=29)
Mean 3.3 2.4 3.6 2.5 3.8 2.0 2.2 2.9 2.8 2.2
SE Mean .1 .1 .1 .2 .1 .1 .1 .2 .2 .2
Std. Dev. 1.0 1.0 1.0 1.3 .9 .9 1.0 1.1 1.2 1.3
Skewness .1 .4 -.7 .6 -.5 .9 .4 .2 -.4 .8
SE Skew. .3 .3 .3 .3 .3 .3 .3 .3 .3 .3
Kurtosis -.7 -1.0 .1 -.7 -.4 .2 -.8 -.6 -1.1 -.6
SE Kurt. .6 .6 .6 .6 .6 .6 .6 .6 .6 .6
Descriptive Statistics: Desktop (n=27)
Mean 3.2 2.2 3.6 2.3 3.7 2.2 2.6 3.3 2.3 2.3
SE Mean .2 .2 .2 .2 .2 .2 .2 .2 .3 .3
Std.Dev. 1.0 1.0 1.0 1.1 .9 1.1 1.0 1.0 1.3 1.3
Skewness .3 .5 -.4 .6 -.5 .7 -.2 -.3 .4 .5
SE Skew. .5 .5 .5 .5 .5 .5 .5 .5 .5 .5
Kurtosis -.8 -.7 -.8 -.4 -.3 -.6 -1.3 -.4 -1.3 -1.2
SE Kurt. .9 .9 .9 .9 .9 .9 .9 .9 .9 .9
perience” (USQ1), with a standard deviation of .8.
In contrast, the Desktop group reported a mean sat-
isfaction score of 3.6 and a higher standard devia-
tion of .9, indicating more variability. For satisfac-
tion with visual quality (USQ3), the XR group scored
higher at 3.9, compared to the Desktop group’s score
at 3.6. This suggests a better perceived visual qual-
ity and a more consistent positive perception in the
XR environment, indicating an effective user expec-
tation management, compared to the lower scores of
the Desktop group, indicating some areas needing im-
provement (see Table 6).
In general, the participants who used the XR sys-
tem were very satisfied, with an overall average rating
of 4.1 out of 5. Despite this, desktop users had an av-
erage rating of 3.6, suggesting that there is room for
improvement in visual appeal and user-friendliness,
although users in this group were generally satisfied.
On the other hand, findings from the Immersive
Presence Questionnaire (IPQ) (Schwind et al., 2019)
show that participants in the XR group experienced
a higher sense of presence than desktop group par-
ticipants. For instance, the item How aware were
you of the real-world surrounding while navigating
in the virtual world? (IPQ1), had a mean of 1.8, stan-
dard deviation of .9, indicating high immersion and
reduced awareness of the real world. In contrast, the
item “How real did the virtual world seem to you?”
(IPQ4) had a mean score of .6 and a standard de-
viation of 1.6, indicating varied perceptions of real-
ism. This variation may stem from individual sensi-
tivities to immersive experiences. The moderate im-
mersion measured by the overall IPQ score of 3.48 on
Table 6: User Satisfaction Questionnaire.
USQ1 USQ2 USQ3
Descriptive Statistics: XR (n=29)
Mean 4.1 4.0 3.9
SE Mean .1 .2 .2
Std. Dev. .8 1.1 .9
Skewness -.1 -1.0 -.3
SE Skewness .4 .4 .4
Kurtosis -1.2 .6 -.7
SE Kurtosis .9 .9 .9
Descriptive Statistics: Desktop (n=27)
Mean 3.6 3.6 3.6
SE Mean .2 .2 .2
Std. Dev. .8 1.2 1.1
Skewness -1.2 -.3 -.7
SE Skewness .5 .5 .5
Kurtosis .6 -.7 -.0
SE Kurtosis .9 .9 .9
56 participants demonstrates the strong experience of
presence when users are engaged in the virtual world.
However, these results also indicate room to improve
the consistency in engagement and realism for all the
users.
Furthermore, the average likelihood of 56 people
recommending their experience was 7.2, indicating
that their opinions differed. XR users displayed more
excitement, with an average NPS score of 7.9, show-
ing their increased likelihood of recommending the
experience. In contrast, the Desktop users scored 6.5,
indicating the need for improvement to match the rec-
ommendability of the XR version.
Another independent sample t-test was conducted
to investigate the effects of the XR environment com-
pared to the Desktop version on instructional de-
sign. This study looked at the System Usability Scale
(SUS), User Satisfaction Questionnaire (USQ), and
Net Promoter Score (NPS) in both the XR and Desk-
top groups. The goal was to demonstrate that par-
ticipants in the XR environment would report higher
scores in perceived presence, system usability, and
overall satisfaction than those using the Desktop ver-
sion (refer to Table 7).
This data analysis indicates that users of the XR
system reported significantly higher user satisfaction
(measured by the User Satisfaction Questionnaire,
USQ) and a greater likelihood of recommending the
system (indicated by the Net Promoter Score, NPS)
compared to Desktop users. This suggests that XR
participants were more satisfied and inclined to rec-
ommend their experience with the system. However,
HUCAPP 2025 - 9th International Conference on Human Computer Interaction Theory and Applications
478

Table 7: Independent Samples T-Test.
t df p
Mean Difference
SE Difference
Cohen’s d
SE Cohen’s d
System Usability Scale
SUS1 -.7 54 .2 -.2 .3 -.2 .3
SUS2 -.9 54 .2 -.3 .3 -.3 .3
SUS3 .4 53.8 .7 .1 .3 .1 .3
SUS4 -1.2 53.7 .1 -.4 .3 -.3 .3
SUS5 -.1 54 .5 -.0 .3 -.0 .3
SUS6 1.0 48.8 .8 .3 .3 .3 .3
SUS7 2.9 43.5 1.0 .7 .3 .8 .3
SUS8 3.0 53.6 1.0 .8 .3 .8 .3
SUS9 -3.3 45.1 .0 -1.0 .3 -.9 .3
SUS10.3 52.5 .6 .1 .3 .1 .3
User Satisfaction Questionnaire
USQ1 -2.1 53.2 .0 -.4 .2 -.6 .3
USQ2 -1.4 53 .1 -.4 .3 -.4 .3
USQ3 -1.2 51.8 .1 -.3 .3 -.3 .3
Net Promoter Score
NPS -2.4 47.7 .0 -1.4 .6 -.7 .3
Note. For all tests, the alternative hypothesis specifies that group
Desktop is less than group XR.
Note. Welch’s t-test.
the two groups did not have significant differences in
system usability (as assessed by the System Usability
Scale, SUS), indicating similar usability ratings.
For this independent samples t-test, Welch’s test
approach was used due to unequal variances indicated
by Levene’s test for items SUS7 and SUS9, particu-
larly regarding ease of learning and confidence. Al-
though normality tests showed significant deviations
(p < .05), the Central Limit Theorem supports the
idea that the distribution of sample means approxi-
mates normality as sample sizes grow larger (Lakens,
2022).
The system usability scale (SUS) analysis did
not show significant differences between the XR and
Desktop groups for most items. However, XR users
felt more confident using the system. This was
clear in their responses about user confidence (SUS9),
where XR users had higher scores (t = −3.3, p < .01)
and a strong effect size (Cohen’s d = −.9).
In the User Satisfaction Questionnaire (USQ), ap-
parent differences were observed in the first item
(USQ1), with a p value below .05. However, effect
sizes of -.6 and -.4, for USQ1 and USQ2 show that
XR users had a better overall experience and rated the
visual quality higher than Desktop users. There was
also a slight difference in how easy users found the
system to use and visual quality (USQ2 and USQ3),
with p-values of .1, suggesting that XR users found
it easier to use and were more satisfied regarding the
visual quality of the environment.
Finally, for the Net Promoter Score (NPS), a sig-
nificant difference (p < .01) with a medium effect size
(Cohen’s d = −.7) was found, meaning that XR users
were more likely to recommend the system. Over-
all, XR users reported higher satisfaction, confidence,
and a greater willingness or likelihood to recommend
their experience with the system.
4 DISCUSSION
Involving immersion technologies in education, such
as XR, to introduce complex concepts like AI-related
topics (e.g., neural networks or handwritten digit
recognition) requires a mix of sensory engagement,
interactivity, and relevance. The literature has indi-
cated that high-quality visuals, realistic simulations,
and interactive features help learners actively explore
complex topics (e.g., AI concepts), making them eas-
ier to understand and remember (Marougkas et al.,
2023). However, it is important to avoid overwhelm-
ing students with too much information at once, so
technology should support learning without causing
distractions (Skulmowski, 2024). Thus, gradually in-
troducing XR technologies and providing guidance
can help students focus on their learning outcomes.
The findings indicate that XR environments boost
engagement, promoting deeper cognitive processing
via meaningful interactions with the content, as vi-
sualizations are particularly useful in comprehending
complex ideas, such as Neural Networks, as they aid
in understanding (Zhang et al., 2024). In general,
users found the XR system to be easier to navigate and
allowing them to focus on learning rather than strug-
gling with technology. This is supported by the Sys-
tem Usability Scale (SUS) scores, where the partici-
pants in the XR group had an average score of 60.1,
compared to 57.9 for the participants in the desktop
group, suggesting that the XR users had a more pos-
itive experience and increased participation in their
learning tasks.
Moreover, desktop interfaces often lack the im-
mersive elements found in XR, leading to a broader
range of user experiences that may hinder the edu-
cational progress of some students. However, based
on the findings presented in this paper, the interac-
tive quality of XR enables students to interact with
Exploring Extended Reality (XR) in Teaching AI: A Comparative Study of XR and Desktop Environments
479

3D models, improving comprehension and memory
of complex ideas and grasping deeper complex con-
cepts, giving this technology a notable edge over con-
ventional approaches.
However, despite XR participants reporting more
engagement, as evidenced by longer session lengths
and higher user satisfaction, this did not transfer into
better learning outcomes, as both the XR and Desk-
top groups provided similar correct responses. The
variability in XR user performance suggests that not
all benefited equally from the immersive experience,
with some struggling with the technology. Factors,
such as the novelty of the XR technology, can distract
participants from educational content, and the learn-
ing curve associated with XR could hinder material
absorption (Alnagrat et al., 2022). Then, to overcome
these challenges, students may need specific training
(i.e., scaffolding ) and support to use technology and
stay focused on learning objectives properly. More-
over, it is also important to reflect on the training that
educators need when involving immersive technolo-
gies, such as XR. Educators need to understand how
to use these technologies effectively in their lessons,
leading them to understand how to create engaging
activities and support students in using these tech-
nologies.
Despite these challenges, technologies like XR
have the potential to greatly increase student engage-
ment. They help students learn and retain complex
concepts more easily by making them more acces-
sible, improving motivation, and sparking interest
(Guilbaud et al., 2021b). Integrating XR into educa-
tion could create a more dynamic and effective learn-
ing environment (Zhang et al., 2024). However, fur-
ther research is needed, using larger sample sizes and
more diverse STEM topics, to compare XR with tra-
ditional learning methods and their impact on learn-
ing outcomes. Additionally, it is important to explore
how immersive technologies like XR can support dif-
ferent learning styles, particularly for students who
may need extra time or specific support to adapt to
this technology. Future studies should focus on how
XR can be used to personalize learning experiences,
tailoring them to individual needs. Therefore, when
used effectively, immersive technologies, such as XR,
have great potential to enhance learning experiences
and improve educational outcomes.
5 CONCLUSIONS, LIMITATIONS,
AND RECOMMENDATIONS
The results of this study show the differences in learn-
ing between XR environments and traditional desk-
top settings, highlighting their distinct advantages and
disadvantages in teaching complex AI concepts. The
students’ experiences and outcomes differed, while
both technological approaches intended to introduce
complex topics by employing interactive tasks, such
as Neural Networks and Handwritten Digit Recogni-
tion. XR technology has made learning more engag-
ing and easier to use, but some challenges need to be
considered.
The outcomes of this research reveal that the vari-
ability in performance among XR users may arise
from their unfamiliarity with the technology (Bautista
et al., 2023). Although performance may increase
with more exposure, this leads to concerns about the
initial learning process and differences in adaptabil-
ity among students, particularly those who are not as
familiar with technology (Parong and Mayer, 2021).
Thus, training and scaffolding are needed to support
the adaptability of new immersive technologies in ed-
ucation.
Moreover, desktop environments are generally
considered more intuitive, as they do not need special
equipment as XR environments, making it possible
for students without XR access to participate (Zhang
et al., 2024). There is also a higher price for the XR
equipment, which makes it difficult to acquire. For-
tunately, the performance/price ratio of XR headsets
continues to increase. For example, our XR environ-
ment can now be deployed on a $300 Meta Quest 3S.
The authors acknowledge that this research only
investigated the quantitative perspective. Therefore,
further research will be conducted to analyze the ef-
fectiveness of immersive technologies, such as XR,
in a deeper way using different lenses. For this, mul-
tiple methods will be used to identify and reflect on
the interplay between overall performance and ratio-
nales in measuring students’ learning outcomes. That
is, further research aims to provide a more complete
understanding of how these immersive technologies
impact learning outcomes, reflecting on the variabil-
ity in students’ experiences and on how they can be
used more effectively in education.
ACKNOWLEDGMENTS
The authors thank all participants who voluntarily and
actively contributed to the study with their partici-
pation. This material is based upon work supported
by the National Science Foundation under Grants
2417510, 2212200, 2219842, 2309564, and 2318657.
HUCAPP 2025 - 9th International Conference on Human Computer Interaction Theory and Applications
480

REFERENCES
Alnagrat, A., Ismail, R. C., Idrus, S. Z. S., and Alfaqi, R.
M. A. (2022). A review of extended reality (xr) tech-
nologies in the future of human education: Current
trend and future opportunity. Journal of Human Cen-
tered Technology, 1(2):81–96.
Baquero, A. (2022). Net promoter score (nps) and customer
satisfaction: relationship and efficient management.
Sustainability, 14(4):2011.
Bautista, L., Maradei, F., and Pedraza, G. (2023). Strate-
gies to reduce visual attention changes while learning
and training in extended reality environments. Inter-
national Journal on Interactive Design and Manufac-
turing (IJIDeM), 17(1):17–43.
Brown, N. J., Furtak, E. M., Timms, M., Nagashima, S. O.,
and Wilson, M. (2010). The evidence-based reason-
ing framework: Assessing scientific reasoning. Edu-
cational Assessment, 15(3-4):123–141.
Chen, L., Chen, P., and Lin, Z. (2020). Artificial intelli-
gence in education: A review. Ieee Access, 8:75264–
75278.
Chiang, Y.-C. and Liu, S.-C. (2023). The effects of ex-
tended reality technologies in stem education on stu-
dents’ learning response and performance. Journal of
Baltic Science Education, 22(4):568–578.
Deng, L. (2012). The mnist database of handwritten digit
images for machine learning research [best of the
web]. IEEE signal processing magazine, 29(6):141–
142.
Feijoo-Garcia, M. A., Holstrom, M. S., Magana, A. J., and
Newell, B. A. (2024). Simulation-based learning and
argumentation to promote informed design decision-
making processes within a first-year engineering tech-
nology course. Sustainability, 16(7).
Feij
´
oo-Garc
´
ıa, M. A., Ram
´
ırez-Ar
´
evalo, H. H., and Feij
´
oo-
Garc
´
ıa, P. G. (2021). Collaborative strategy for soft-
ware engineering courses at a south american univer-
sity. In Proceedings of the 13th International Confer-
ence on Computer Supported Education - Volume 1:
CSEDU, pages 266–273. INSTICC, SciTePress.
Fern
´
andez-Batanero, J. M., Montenegro-Rueda, M.,
Fern
´
andez-Cerero, J., and L
´
opez-Meneses, E. (2024).
Extended reality as an educational resource in the pri-
mary school classroom: An interview of drawbacks
and opportunities. Computers, 13(2).
Ferreira, J. M. M. and Qureshi, Z. I. (2020). Use of xr tech-
nologies to bridge the gap between higher education
and continuing education. In 2020 IEEE Global En-
gineering Education Conference, pages 913–918.
Grier, R. A., Bangor, A., Kortum, P., and Peres, S. C.
(2013). The system usability scale: Beyond stan-
dard usability testing. In Proceedings of the human
factors and ergonomics society annual meeting, vol-
ume 57, pages 187–191. SAGE Publications Sage CA:
Los Angeles, CA.
Gu, Y., Feijoo-Garcia, M. A., Zhang, Y., Magana, A. J.,
Benes, B., and Popescu, V. (2024). An xr environ-
ment for ai education: Design and first implementa-
tion. In 2024 IEEE Conference on Virtual Reality and
3D User Interfaces Abstracts and Workshops (VRW),
pages 157–162. IEEE.
Guilbaud, P., Guilbaud, T. C., and Jennings, D. (2021a). Ex-
tended reality, pedagogy, and career readiness: A re-
view of literature. In Chen, J. Y. C. and Fragomeni, G.,
editors, Virtual, Augmented and Mixed Reality, pages
595–613.
Guilbaud, P., Guilbaud, T. C., and Jennings, D. (2021b).
Extended reality, pedagogy, and career readiness:
A review of literature. In International Confer-
ence on Human-Computer Interaction, pages 595–
613. Springer.
Guo, X., Guo, Y., and Liu, Y. (2021). The development
of extended reality in education: Inspiration from the
research literature. Sustainability, 13(24).
Idrees, A., Morton, M., and Dabrowski, G. (2022). Advanc-
ing extended reality teaching and learning opportuni-
ties across the disciplines in higher education. In 2022
8th International Conference of the Immersive Learn-
ing Research Network, pages 1–8.
Jagatheesaperumal, S. K., Ahmad, K., Al-Fuqaha, A.,
and Qadir, J. (2024). Advancing education through
extended reality and internet of everything enabled
metaverses: Applications, challenges, and open is-
sues. IEEE Transactions on Learning Technologies,
17:1120–1139.
Kara, A., Mintu-Wimsatt, A., and Spillan, J. E. (2021). An
application of the net promoter score in higher edu-
cation. Journal of Marketing for Higher Education,
pages 1–24.
Kharvari, F. and Kaiser, L. E. (2022). Impact of extended
reality on architectural education and the design pro-
cess. Automation in Construction, 141.
Kim, S.-W. (2023). Change in attitude toward artificial
intelligence through experiential learning in artificial
intelligence education. International Journal on Ad-
vanced Science, Engineering & Information Technol-
ogy, 13(5).
Kosko, K. W., Ferdig, R. E., and Roche, L. (2021). Concep-
tualizing a shared definition and future directions for
extended reality (xr) in teacher education. Journal of
Technology and Teacher Education, 29(3):257–277.
Koukopoulos, D., Dafiotis, P., Sylaiou, S., Koukoulis, K.,
and Fidas, C. (2022). Xr technologies for self-
regulated student exhibitions in art education: Survey
and first design considerations. In 2022 International
Conference on Interactive Media, Smart Systems and
Emerging Technologies, pages 1–8.
Kuleto, V., P., M. I., Stanescu, M., Rankovi
´
c, M.,
ˇ
Sevi
´
c,
N. P., P
˘
aun, D., and Teodorescu, S. (2021). Extended
reality in higher education, a responsible innovation
approach for generation y and generation z. Sustain-
ability, 13(21).
Lakens, D. (2022). Sample size justification. Collabra:
psychology, 8(1):33267.
L
´
opez-Ojeda, W. and Hurley, R. A. (2021). Extended-
reality technologies: An overview of emerging ap-
plications in medical education and clinical care.
The Journal of Neuropsychiatry and Clinical Neuro-
sciences, 33(3):A4–177.
Exploring Extended Reality (XR) in Teaching AI: A Comparative Study of XR and Desktop Environments
481

Marougkas, A., Troussas, C., Krouska, A., and
Sgouropoulou, C. (2023). Virtual reality in edu-
cation: a review of learning theories, approaches
and methodologies for the last decade. Electronics,
12(13):2832.
Meccawy, M. (2022). Creating an immersive xr learning
experience: A roadmap for educators. Electronics,
11(21).
Obeidallah, R., Ahmad, A. A., and Qutishat, D. (2023).
Challenges of extended reality technology in higher
education: A review. International Journal of Emerg-
ing Technologies in Learning, 18(14).
Parong, J. and Mayer, R. E. (2021). Cognitive and affec-
tive processes for learning science in immersive vir-
tual reality. Journal of Computer Assisted Learning,
37(1):226–241.
Pedr
´
o, F. (2020). Applications of artificial intelligence to
higher education: possibilities, evidence, and chal-
lenges. IUL Research, 1(1):61–76.
Pham, S. T. and Sampson, P. M. (2022). The develop-
ment of artificial intelligence in education: A review
in context. Journal of Computer Assisted Learning,
38(5):1408–1421.
Rangel-de L
´
azaro, G. and Duart, J. M. (2023). You can
handle, you can teach it: Systematic review on the use
of extended reality and artificial intelligence technolo-
gies for online higher education. Sustainability, 15(4).
Romeike, R. (2019). The role of computer science edu-
cation for understanding and shaping the digital so-
ciety. In Sustainable ICT, Education and Learning:
IFIP WG 3.4 International Conference, SUZA 2019,
Zanzibar, Tanzania, April 25–27, 2019, Revised Se-
lected Papers 1, pages 167–176. Springer.
Schwind, V., Knierim, P., Haas, N., and Henze, N. (2019).
Using presence questionnaires in virtual reality. In
Proceedings of the 2019 CHI conference on human
factors in computing systems, pages 1–12.
Skulmowski, A. (2024). Learning by doing or doing
without learning? the potentials and challenges of
activity-based learning. Educational Psychology Re-
view, 36(1):28.
Zhang, Y., Feijoo-Garcia, M. A., Gu, Y., Popescu, V.,
Benes, B., and Magana, A. J. (2024). Virtual and
augmented reality in science, technology, engineer-
ing, and mathematics (stem) education: An umbrella
review. Information, 15(9).
Zwoli
´
nski, G., Kami
´
nska, D., Laska-Le
´
sniewicz, A.,
Haamer, R. E., Vairinhos, M., Raposo, R., Urem, F.,
and Reisinho, P. (2022). Extended reality in education
and training: Case studies in management education.
Electronics, 11(3).
HUCAPP 2025 - 9th International Conference on Human Computer Interaction Theory and Applications
482
