
OCTA Image-Based Machine Learning Models for Discriminating
Alzheimer’s Disease from Neurodegenerative and Ocular Conditions
Cunyi Xu
Leicester Grammar School, London Road, Great Glen, Leicester, LE8 9FL, U.K.
Keywords:
Alzheimer’s Disease, Optical Coherence Tomography Angiography, Machine Learning, Early Diagnosis.
Abstract:
Alzheimer’s disease (AD) is a progressive neurodegenerative disorder that poses a significant challenge, par-
ticularly as the global population ages. Timely diagnosis is crucial for managing AD, and this study aims to
contribute to early detection by analyzing Optical Coherence Tomography Angiography (OCTA) images us-
ing machine learning models. In this work, we leverage the structural and functional connections between the
eye and brain to enhance the discrimination of AD from other neurodegenerative and ocular conditions. We
also compiled a comprehensive dataset of OCTA images from various imaging devices, representing a range
of diseases. Using a pre-trained nnU-Net, we segmented vascular structures and calculated vascular density
metrics, while also extracting histogram and Gray-Level Co-occurrence Matrix (GLCM) features for texture
analysis. Various machine learning models were trained and evaluated through five-fold cross-validation, with
the Random Forest model achieving 78.15% accuracy in classifying multi-disease OCTA images. The model
exhibited high recall for stroke, diabetes, and age-related macular degeneration, but lower recall for AD, con-
genital heart disease, and hypertension, indicating potential misclassification. Our findings emphasize the
utility of OCTA imaging and machine learning for early AD diagnosis, paving the way for future research to
refine image processing and classification methods.
1 INTRODUCTION
The burgeoning global elderly population has led to
a proportional rise in the prevalence of Alzheimer’s
disease (AD), a progressive neurodegenerative disor-
der that poses significant healthcare challenges. With
current estimates suggesting that over 130 million in-
dividuals will be affected by 2050, the urgency to de-
velop effective diagnostic and therapeutic strategies
is paramount(Nichols et al., 2022). The economic
and social burden of AD is further exacerbated by
its increasing incidence among younger demograph-
ics, highlighting the necessity for early and accu-
rate detection methods to mitigate disease progres-
sion(Hassen et al., 2024). The quest for early diag-
nostic markers has led researchers to explore the intri-
cate relationship between the eye and the brain(Diogo
et al., 2022; Hassen et al., 2024). The retina’s struc-
tural and functional connections to the central nervous
system make it a viable window into brain health,
with preliminary abnormalities often manifesting in
the retina prior to the onset of neurological symp-
toms(O’Bryhim et al., 2018). This insight has spurred
1
Author of this article is the corresponding author.
interest in non-invasive ocular imaging techniques as
potential diagnostic tools for early AD detection.
Optical Coherence Tomography Angiography
(OCTA) has emerged as a pivotal technology in
this domain, offering high-resolution, non-invasive
imaging of the retinal and choroidal microvascula-
ture(Naseripour et al., 2020; Liu et al., 2024; Turkan
and Tek, 2023). OCTA’s ability to track red blood cell
movement within the vasculature provides a unique
perspective on the microvascular changes that may
precede AD-related neurological symptoms.
Despite the promising results of OCTA, exist-
ing diagnostic methods still face limitations, par-
ticularly in large-scale screenings and among el-
derly populations where coexisting eye conditions can
confound interpretations of OCTA images(Turkan
and Tek, 2022). Differentiating early signs of AD
from other retinal pathologies requires sophisticated
analytical techniques to improve diagnostic accu-
racy(Katsimpris et al., 2022).
Recent advancements in OCTA have facilitated a
deeper understanding of retinal vascular changes as-
sociated with AD. Studies have reported reduced reti-
nal vascular density in AD patients, suggesting a cor-
324
Xu, C.
OCTA Image-Based Machine Learning Models for Discriminating Alzheimer’s Disease from Neurodegenerative and Ocular Conditions.
DOI: 10.5220/0013141300003911
Paper published under CC license (CC BY-NC-ND 4.0)
In Proceedings of the 18th International Joint Conference on Biomedical Engineering Systems and Technologies (BIOSTEC 2025) - Volume 1, pages 324-331
ISBN: 978-989-758-731-3; ISSN: 2184-4305
Proceedings Copyright © 2025 by SCITEPRESS – Science and Technology Publications, Lda.

relation with cerebral vascular alterations(Yoon et al.,
2024). Additionally, OCTA has shown potential in
distinguishing AD from other neurodegenerative dis-
eases and common eye conditions such as diabetic
retinopathy (DR) and age-related macular degenera-
tion (Li et al., 2023).
The academic community has increasingly recog-
nized the importance of retinal biomarkers in demen-
tia diagnosis, with OCTA playing a significant role.
Systematic reviews and high-resolution imaging stud-
ies have begun to elucidate the morphological charac-
teristics of the retinal microvasculature in relation to
various diseases.
This paper aims to build on these foundations by
exploring the utility of OCTA in differentiating AD
from other eye diseases and neurodegenerative con-
ditions. We focus on quantitatively assessing the dis-
tinguishability of OCTA features associated with AD
and other diseases to enhance early diagnostic accu-
racy. Through the application of machine learning
algorithms to a comprehensive dataset of OCTA im-
ages, we seek to provide new insights and methods for
early AD detection, potentially alleviating the societal
impact of this pervasive disease.
2 RELATED WORKS
2.1 Vascular Density and Vessel
Segmentation
Optical Coherence Tomography Angiography
(OCTA) often uses Blood Vessel Density (BVD) as a
key metric because it is simple to calculate and useful
for assessing the severity of eye diseases like Diabetic
Retinopathy (DR) and Glaucoma. The process of
deriving BVD from OCTA images is considered a
segmentation task, making deep learning techniques
such as U-Net particularly suitable. For instance,
Convolutional Neural Network (CNN) models have
been successfully applied to segment choroidal blood
vessels, which is more challenging than retinal seg-
mentation due to the higher density of larger vessels
in the choroid and greater signal loss in deeper
tissues. Liu et al. has shown that BVD measurements
obtained through this method are comparable to those
from manual segmentation(Liu et al., 2019).
Furthermore, various U-Net models have helped
standardize BVD measurements across different de-
vices and improve resistance to projection artifacts.
Vessel segmentation can also be improved with im-
age enhancement techniques, as better image quality
increases the contrast between blood flow and back-
ground pixels. Like most OCTA measurement tech-
niques, these methods can be applied to en-face im-
ages, which are essential for accurate anatomical slice
segmentation. Another approach, the Image Projec-
tion Network (IPN), utilizes CNNs to extract fea-
tures and perform projections simultaneously. It has
been tested on two key areas of retinal image seg-
mentation—retinal vessel segmentation and Foveal
Avascular Zone (FAZ) segmentation. Results indicate
that the IPN is an effective implementation of 3D to
2D segmentation networks, outperforming standard
methods(Li et al., 2020).
2.2 Biomarkers and Features for
Developing Computer-Aided
Diagnostic Systems
The combination of biomarkers and unique features
is crucial for creating CAD systems. Traditional
methods like logistic regression have proven effec-
tive, and machine learning models are also viable op-
tions. CAD systems that utilize OCTA data have been
designed to DR at various severity levels (Krittana-
wong et al., 2020). Research has shown that using
a Random Forest model with inputs such as struc-
tural OCT reflectivity, curvature and thickness, OCTA
vascular density, the number of vascular bifurcations
and crossings, and the size of the Foveal Avascular
Zone (FAZ) has resulted in an area under the receiver
operating characteristic curve exceeding 95%. This
performance was key in differentiating eyes with DR
from those without and in classifying the conditions
of patients with non-proliferative DR.
Additionally, studies that combined clinical in-
dicators with OCTA features, using a hybrid ap-
proach of a balanced optimizer and Support Vec-
tor Machine for feature selection and classification,
have produced promising results for Vogt-Koyanagi-
Harada syndrome (Dhodapkar et al., 2022). Concur-
rently, research has explored deep learning systems
that integrate macular Blood Vessel Density (BVD)
with the thickness of the ganglion cell layer/inner
plexiform layer. The combination of these metrics,
learned through AI, has outperformed individual mea-
surements.
Deep learning has also been applied to the diag-
nosis of Age-Related Macular Degeneration (AMD),
with studies indicating that CNN can accurately pre-
dict the progression of AMD from intermediate to ad-
vanced stages (Peng et al., 2020). Moreover, as pre-
viously mentioned, CNNs’ ability to detect Choroidal
Neovascularization (CNV) makes deep learning a vi-
able option for classifying neovascular patterns in
AMD. The effectiveness of these CAD systems re-
lies on the quality of input feature measurements;
OCTA Image-Based Machine Learning Models for Discriminating Alzheimer’s Disease from Neurodegenerative and Ocular Conditions
325

therefore, continuous improvements in feature quan-
tification will support the development of CAD sys-
tems. However, their overall performance remains
constrained by predefined functionalities.
2.3 AI-Enhanced Analysis of OCTA
Images and Disease Diagnosis
AI-based diagnostic systems utilizing OCTA imag-
ing are widely employed for assessing retinal diseases
and identifying various eye conditions. However,
these AI diagnostic tools, despite being validated, en-
counter numerous challenges. Firstly, the resolution
and details of retinal blood vessels captured by fun-
dus images are limited, which hampers the ability to
accurately measure the curvature of microvessels near
the fovea and across different retinal layers (Dhodap-
kar et al., 2022).
Additionally, the quality of OCTA images can
vary due to factors like eye movement, eyelid ob-
struction, and artifacts from optical coherence tomog-
raphy, which significantly affects manual annotations
and leads to inconsistencies in subjective assessments
(Lauermann et al., 2019). Consequently, diagnostic
systems that rely on supervised machine learning al-
gorithms struggle with poor performance in quantita-
tive feature analysis and lack of diagnostic accuracy.
Furthermore, understanding the reasoning behind
AI model decisions is crucial for clinical disease di-
agnosis, and providing clear interpretability of al-
gorithms will be essential for the clinical integra-
tion of AI-assisted OCTA disease diagnosis. More-
over, deep learning systems require large and verifi-
able databases, ranging from 100,000 to several mil-
lion images, for effective training and optimization
(Le et al., 2024). Even after successfully training AI
systems, differences among databases from various
imaging centers make it extremely difficult to provide
reliable accuracy metrics (Yang et al., 2023). At the
same time, creating large multicenter databases for
the effective use of AI diagnostic tools presents a sig-
nificant challenge, especially for new retinal imaging
techniques like OCTA. Nevertheless, AI is expected
to help realize the full potential of OCTA imaging.
2.4 Retinal Neurodegeneration and
Vascular Alterations in AD
Studies using OCT have shown considerable retinal
neurodegeneration in individuals with AD. A sys-
tematic review conducted in 2018 found that patients
with AD exhibited thinning in several retinal layers,
including the peripapillary retinal nerve fiber layer
(pRNFL), macular ganglion cell inner plexiform layer
(mGCIPL), ganglion cell complex, and choroidal lay-
ers, as well as a decrease in overall macular volume
and thinning in both inner and outer macular regions
(Chan et al., 2019).
The thinning of the mGCIPL has been linked to
the severity of the disease (Ferrari et al., 2017). Var-
ious fluorescence-based fundus imaging techniques
have been used to visualize and measure retinal
pathology associated with AD. For instance, adminis-
tering curcumin, a beta-amyloid binding fluorophore,
intravenously resulted in a twofold increase in reti-
nal β-amyloid levels in AD patients. These retinal
β-amyloid levels have been associated with cortical
β-amyloid levels and reductions in hippocampal vol-
ume (Koronyo et al., 2017). Moreover, blue autoflu-
orescence has been employed to measure the surface
area of retinal inclusions related to preclinical cortical
β-amyloid burden (Snyder et al., 2016). Lastly, fluo-
rescence lifetime imaging ophthalmoscopy has shown
differences between AD patients and matched con-
trols.
Retinal vascular alterations have also been ob-
served in fundus images of AD patients. The fractal
dimension (FD), which quantitatively represents the
complexity of vascular branching, can be assessed us-
ing commercial software or expert evaluation. A sys-
tematic review from 2019 reported a decrease in vas-
cular FD among AD patients across four case-control
studies involving fundus imaging (Lemmens et al.,
2020). Additionally, one study noted increased vas-
cular tortuosity and narrowed venous diameters in AD
patients, although another study presented conflicting
results (Cheung et al., 2014). It can be seen that in-
dividuals with AD have an enlarged central arterio-
lar avascular zone and reduced overall superficial and
deep retinal vascular density.
3 FRAMEWORK FOR EARLY
DIAGNOSIS OF ALZHEIMER’S
DISEASE
3.1 Overview
The overarching goal of this study is to harness the
potential of OCTA for early diagnosis of AD by
differentiating it from other eye diseases and neu-
rodegenerative conditions. Our methodology encom-
passes the following key steps: First, we assembled
a diverse dataset of OCTA images to ensure repre-
sentation of various imaging devices, disease states,
and image resolutions. Second, we employ a pre-
trained neural network, nnU-Net, we segmented vas-
BIOIMAGING 2025 - 12th International Conference on Bioimaging
326

cular structures from OCTA images to facilitate the
extraction of vascular density metrics. Next, we ex-
tracted both vascular and image features from the
segmented OCTA images, including overall vascu-
lar density and regional vascular density based on
the Early Treatment Diabetic Retinopathy Study (ET-
DRS) grid. Finally, A suite of machine learning algo-
rithms was trained on the extracted features to classify
images into AD and control groups, employing a five-
fold cross-validation approach to ensure robustness
of the models. The workflow of our methodology,
encapsulating dataset compilation, image segmenta-
tion, feature extraction, and machine learning model
training and validation, is schematically represented
in Figure 1.
3.2 Dataset
Our dataset is a curated collection of 2000 OCTA im-
ages sourced from multiple open datasets: OCTA-
500 (Li et al., 2024), OCTAGON (D
´
ıaz et al., 2019),
Foveal Avascular Zone Image Database (FAZID)
(Agarwal et al., 2020), Soul (Xue et al., 2024) and
DRAC2022 (Qian et al., 2024), providing a wide
spectrum of disease representations. The dataset in-
cludes images from patients with varying conditions,
such as stroke, diabetes, age-related macular degen-
eration (AMD), and AD, as well as a control group.
The image resolutions vary, including 3x3 mm², 6x6
mm², 8x8 mm², and 12x12 mm², to simulate real-
world clinical scenarios.
3.3 Image Segmentation
nnU-Net is an adaptive neural network architecture
that automatically adjusts its structure based on the
specific task. In this research, a version of the U-
Net architecture tailored for OCTA image segmenta-
tion was chosen. Utilizing nnU-Net to segment OCTA
images from various devices, sizes, and disease types
allows for further feature extraction and pathological
analysis. The segmentation network discussed in this
chapter uses the OCTA-500 dataset, which consists of
500 OCTA images. Loss Function: A combination of
cross-entropy and Dice loss functions was used to ad-
dress class imbalance and improve segmentation ac-
curacy.
The cross-entropy loss function focuses on pixel-
level classification, while the Dice loss function em-
phasizes overall shape matching. Optimizer and
Learning Rate: The Adam optimizer was utilized for
model training, starting with a learning rate of 0.001,
along with a learning rate decay strategy to adjust
the learning rate dynamically during training. This
method helps the model converge towards the global
optimum. Training Strategy: The model was trained
using a five-fold cross-validation approach to evaluate
its stability and generalizability. In each fold, 80% of
the data was used for training, and 20% was set aside
for validation.
3.4 Feature Extraction
The objective of this study is to harness the diagnos-
tic potential of OCTA images for early detection of
AD by differentiating it from other eye diseases. A
critical step in achieving this objective is the extrac-
tion of meaningful features from OCTA images that
can serve as inputs for machine learning algorithms.
This section outlines our approach to feature extrac-
tion, focusing on vascular density measurements and
texture analysis.
3.4.1 Vascular Density Calculation
Following the segmentation of OCTA images, vascu-
lar density is calculated to quantify the vascular pat-
terns associated with different disease states. This
process involves two main steps, which are Overall
Image Vascular Density and ETDRS Regional Vascu-
lar Density. Overall Image Vascular Density is deter-
mined by calculating the ratio of vascular pixels to the
total number of pixels in the OCTA image, providing
a global measure of vascularization. Meanwhile, The
ETDRS grid is used to divide the retina into nine dis-
tinct areas. Vascular density is calculated separately
for each of these regions, enabling a detailed analy-
sis of local vascular patterns. This regional analysis
is crucial for early disease detection and accurate di-
agnosis, as it allows for the identification of localized
vascular changes that may not be apparent in overall
density measurements.
3.4.2 Image Feature Extraction
In addition to vascular density, texture analysis plays
a vital role in characterizing OCTA images. We focus
on two types of image features: histogram features
and Gray-Level Co-occurrence Matrix (GLCM) fea-
tures. For histogram feature extraction, Image his-
tograms provide a statistical representation of gray
level distribution, offering insights into brightness and
contrast. In this study, 16 histogram features are de-
rived by quantizing image gray levels into 16 bins and
counting the pixel occurrences within each bin. These
features are indicative of the brightness distribution
and contrast information in OCTA images, which are
essential for disease analysis.
OCTA Image-Based Machine Learning Models for Discriminating Alzheimer’s Disease from Neurodegenerative and Ocular Conditions
327
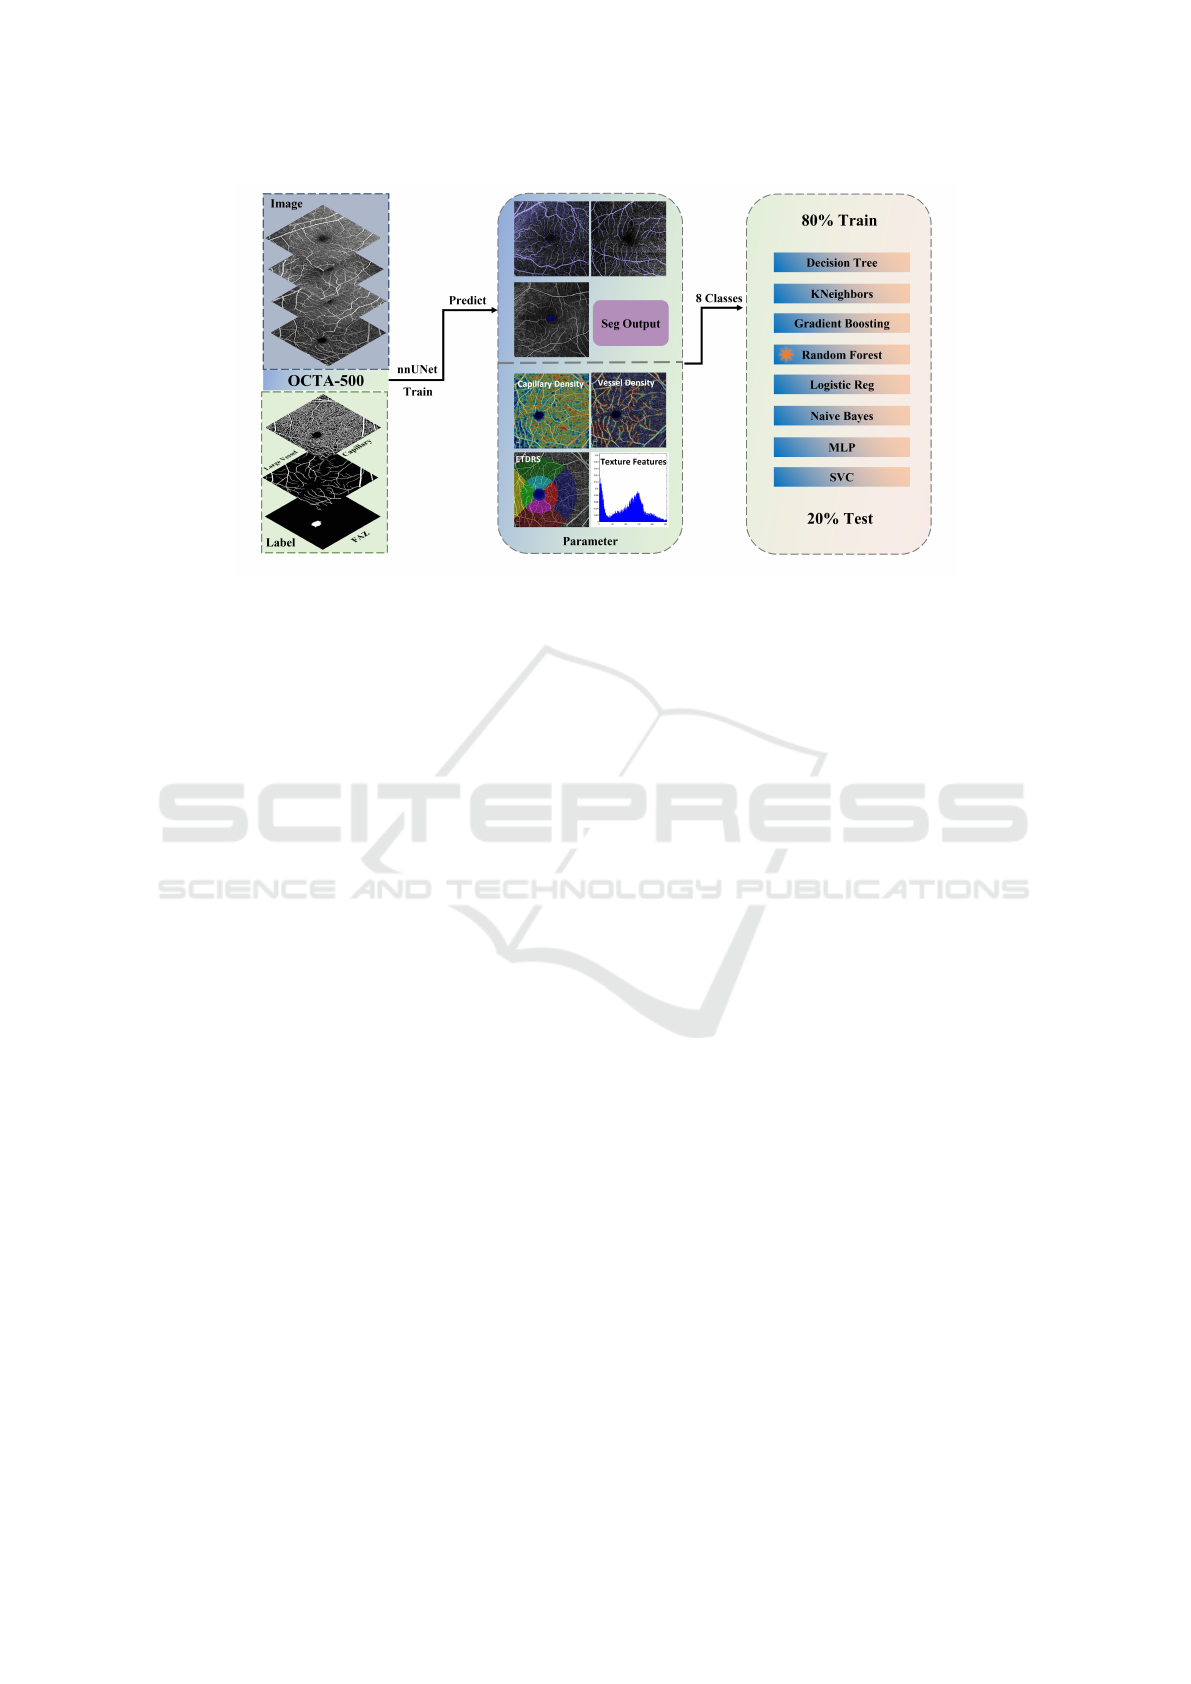
Figure 1: Schematic representation of the methodology for early diagnosis of Alzheimer’s disease using OCTA images. The
process includes dataset compilation, image preprocessing, segmentation using nnU-Net, feature extraction, model training,
validation, and performance evaluation.
On the other hand, The GLCM is a texture anal-
ysis technique that captures spatial relationships be-
tween gray levels in an image. We extract five GLCM
features—contrast, similarity, homogeneity, energy,
and correlation—to characterize the texture structure
of OCTA images. These features provide a quantita-
tive description of vascular structures, which is vital
for subsequent machine learning classification tasks.
3.4.3 Machine Learning Model
The extracted vascular and image features provide a
rich set of information for machine learning models,
aiding in achieving better performance in classifica-
tion tasks. This study involved training and eval-
uating various machine learning models for multi-
disease classification. To ensure optimal model per-
formance, a range of common machine learning mod-
els were selected, and hyperparameter tuning was
performed for each. The models included Random
Forest, Support Vector Machine (SVM), K-Nearest
Neighbors (KNeighbors), Naive Bayes, Logistic Re-
gression, Decision Tree, Gradient Boosting, and Mul-
tilayer Perceptron (MLP). Hyperparameter tuning for
each model was conducted using GridSearchCV.
4 EVALUATION
Each model was trained, and a five-fold cross-
validation strategy was employed to evaluate model
performance. Metrics such as accuracy, macro pre-
cision, macro recall, macro F1 score, weighted pre-
cision, weighted recall, and weighted F1 score were
used for assessment.
The results indicate that the Random Forest model
outperformed all other models, achieving an accu-
racy rate of 78.37%. To understand these results,
it is essential to analyze the performance of each
model in conjunction with the OCTA modality and
the selected features. The Random Forest algorithm,
which integrates multiple decision trees, effectively
handles high-dimensional data and mitigates the risk
of overfitting. The rich vascular and image features
from OCTA images allow the Random Forest to cap-
ture complex relationships between features, thus ex-
celling in classification tasks.
The Gradient Boosting model, which optimizes
incrementally, also performs admirably by captur-
ing intricate feature relationships. This model ex-
cels in processing nonlinear features, and when com-
bined with the diverse features from OCTA images, it
achieves commendable classification results. In con-
trast, Logistic Regression, which is adept at handling
linear features, exhibits limitations when dealing with
complex nonlinear characteristics. Although the Mul-
tilayer Perceptron possesses strong nonlinear model-
ing capabilities, its performance in this study may be
suboptimal due to the influence of feature selection
and model complexity on the given feature data.
In this study, we aimed to explore the distin-
guishability between AD and other common oph-
thalmic and chronic diseases. Based on the assess-
ment using the Random Forest model, we provided
a detailed analysis of metrics and a confusion ma-
trix. Analysis of the results, as shown in Table II,
revealed that AD, congenital heart disease, and hy-
pertension are more likely to be confused with other
BIOIMAGING 2025 - 12th International Conference on Bioimaging
328
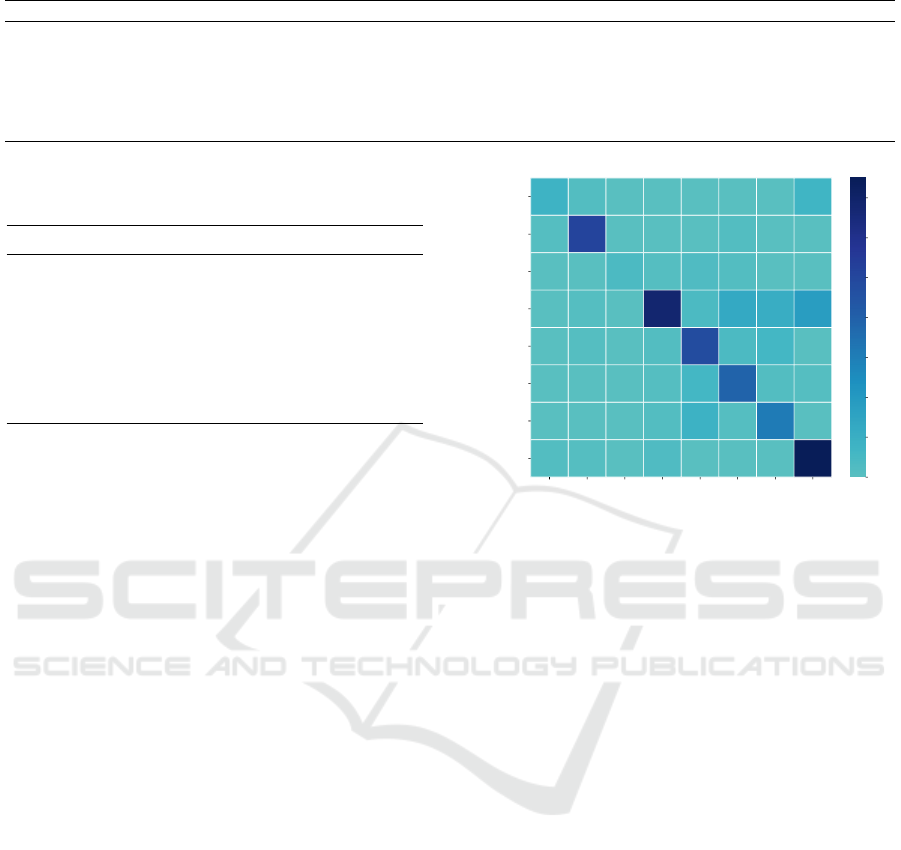
Table 1: Classification results of various machine learning models for OCTA image classification.
Model Accuracy (%) Macro Precision (%) Macro Recall (%) Macro F1 (%) Weighted Precision (%) Weighted Recall (%) Weighted F1 (%)
Decision Tree 65.89 58.32 51.34 52.19 61.16 65.89 61.42
KNeighbors 72.57 59.11 55.55 55.29 71.05 72.57 70.97
Gradient Boosting 76.02 69.52 62.13 63.54 74.50 76.02 74.38
Random Forest 78.37 73.97 70.07 69.08 80.17 76.07 76.81
Logistic Reg 67.82 61.14 52.15 49.87 65.74 67.82 63.16
Naive Bayes 59.20 37.04 53.29 40.31 51.23 59.20 53.06
MLP 63.54 43.58 42.95 40.67 55.40 63.54 55.92
SVC 64.51 43.51 39.72 37.53 55.24 64.51 55.53
Table 2: Performance metrics of the Random Forest model
in classifying various diseases from OCTA images.
Disease Precision (%) Recall (%) F1-score (%)
AD 72.73 47.06 57.14
AMD 91.07 94.44 92.73
CHD 100.00 40.00 57.14
Control 93.92 74.73 83.23
DM 68.57 78.69 73.28
DR 63.93 79.59 70.91
HP 62.00 72.09 66.67
Stroke 39.53 73.91 51.52
diseases during classification, attributed to their lower
recall rates, suggesting a higher likelihood of these
class samples being misclassified. Meanwhile, stroke,
diabetes, and AMD demonstrated higher recall rates,
indicating that these diseases are more readily and ac-
curately identified by the model, with less confusion
with other categories. Notably, the high recall rate for
stroke highlights the model’s superior performance in
identifying this disease, with minimal confusion with
other diseases.
Figure 2 presents the confusion matrix, visually
revealing the relationships between the model’s pre-
dicted categories and the actual categories. An in-
depth analysis of the confusion matrix not only un-
covers the model’s performance variances in identify-
ing various diseases but also exposes potential short-
comings, providing a basis for further model opti-
mization. The confusion matrix also aids in under-
standing the similarities and differences in features
between different diseases, thereby assisting in the
precision of clinical diagnoses. Additionally, we paid
particular attention to the classification of the control
group, finding its recall rate to be relatively low, with
samples from the control group tending to be mis-
classified into categories such as diabetes, diabetic
retinopathy, hypertension, and stroke.
5 DISCUSSION
AD is a long-term neurodegenerative disorder that of-
ten results in dementia among older adults. How-
ever, diagnosing AD early is difficult due to the lack
AD
AMD
CHD
Control
DM
DR
HP
Stroke
AD
AMD
CHD
Control
DM
DR
HP
Stroke
8 2 0 0 0 0 0 7
1 51 0 0 0 2 0 0
0 0 4 1 3 2 0 0
0 1 0 68 4 13 11 18
0 1 0 2 48 4 6 0
0 0 0 1 6 39 2 1
0 0 0 2 9 1 31 0
2 1 0 3 0 0 0 75
0
10
20
30
40
50
60
70
Figure 2: The confusion matrix displays the performance
of the Random Forest model in distinguishing between
Alzheimer’s disease (AD), age-related macular degenera-
tion (AMD), congenital heart disease (CHD), control group,
diabetes mellitus (DM), diabetic retinopathy (DR), hyper-
tension (HP), and stroke.
of definitive diagnostic tools. The retina, sharing de-
velopmental and structural similarities with the brain,
offers a unique perspective on brain pathology, as
changes in the retina may occur before clinical symp-
toms of AD appear. Thus, creating a model that links
ocular and brain structural characteristics to the dis-
ease could help identify early retinal changes, paving
the way for improved early screening and diagnosis
of AD.
OCTA is vital for examining retinal microvascu-
lature, but the variability of existing image analysis
tools hinders its wider use in research and clinical set-
tings. To address this issue, this study utilized ma-
chine learning algorithms for multi-disease classifica-
tion of OCTA images. The results showed that the
Random Forest model achieved the highest perfor-
mance, with an accuracy of 78.37%. This highlights
the effectiveness of ensemble learning in managing
high-dimensional medical imaging data and minimiz-
ing overfitting risks.
Despite these advancements, differentiating be-
tween diseases remains a challenge. Specifically, AD,
OCTA Image-Based Machine Learning Models for Discriminating Alzheimer’s Disease from Neurodegenerative and Ocular Conditions
329

congenital heart disease, and hypertension showed
lower recall rates, indicating a tendency for mis-
classification, possibly due to less distinct features
in OCTA images or similarities with other diseases.
Conversely, stroke, diabetes, and AMD had higher
recall rates, suggesting that these conditions exhibit
more distinct features in OCTA images, resulting in
better model accuracy for their identification.
The results of this study not only aid clinicians in
gaining a clearer understanding of disease character-
istics in OCTA images but also open new avenues for
future research. This includes investigating innova-
tive image processing methods to extract more repre-
sentative features and exploring different algorithmic
combinations to further improve classification accu-
racy and reliability. These initiatives will establish a
stronger basis for early diagnosis and treatment, ulti-
mately enhancing patient outcomes.
6 THREATS TO VALIDITY
This study faced several challenges while using
OCTA for diagnosing ocular diseases, neurodegener-
ative disorders, and systemic conditions. One major
limitation is the intricate relationship between the su-
perficial and deep retinal blood vessels, which ham-
pers the thorough detection of vascular changes asso-
ciated with various diseases. Additionally, the quality
of OCTA images can vary due to factors like differ-
ences in equipment, patient cooperation, eye move-
ments, and eyelid interference, making accurate im-
age analysis difficult. The presence of similar vascu-
lar changes in OCTA images across different diseases
complicates the ability to distinguish between them.
The effects of neurodegenerative and systemic
diseases extend beyond what OCTA can reveal about
vascular structure. The varying stages of disease pro-
gression may also mean that OCTA does not capture
early or subtle vascular changes. The absence of lon-
gitudinal data restricts the monitoring of disease pro-
gression. The technology for automated quantitative
analysis of vascular changes is still being refined, with
improvements needed in accuracy and reproducibil-
ity. Machine learning models also struggle with gen-
eralizability across different populations or devices.
There is an urgent need for more validation studies
and standardized diagnostic criteria for the clinical
use of OCTA. The high cost of the equipment lim-
its its accessibility in resource-constrained environ-
ments.
When creating multicenter databases, challenges
related to data sharing and patient privacy must be ad-
dressed. Finally, the interpretability of AI-assisted di-
agnostic results and the reliability of clinical decision-
making require further validation by healthcare pro-
fessionals. These limitations indicate that while
OCTA technology is a valuable asset for disease re-
search and diagnosis, additional research and tech-
nological advancements are necessary to address the
current challenges in its practical application.
7 CONCLUSION
In this pilot study, we have explored the early di-
agnostic potential of Optical Coherence Tomography
Angiography (OCTA) imaging enhanced by machine
learning for Alzheimer’s Disease (AD) and its dif-
ferentiation from other neurodegenerative and ocular
disorders. Our analysis of a diverse OCTA dataset us-
ing a pre-trained nnU-Net for segmentation and fea-
ture extraction revealed that the Random Forest model
achieved a commendable classification accuracy of
78.15%. While acknowledging the possibility of mis-
classification among AD, congenital heart disease,
and hypertension, our results highlight the promising
role of OCTA and machine learning in early AD di-
agnosis.
As future works, we plan to focus on refining im-
age processing techniques to extract more discrimina-
tive features and exploring advanced machine learn-
ing algorithms to enhance classification accuracy.
Additionally, addressing the challenges of varying
image resolutions and database inconsistencies across
different imaging centers will be crucial for fully har-
nessing the diagnostic potential of OCTA imaging.
REFERENCES
Agarwal, A., Raman, R., Lakshminarayanan, V., et al.
(2020). The foveal avascular zone image database
(fazid). In Applications of Digital Image Processing
XLIII, volume 11510, pages 507–512. SPIE.
Chan, V. T., Sun, Z., Tang, S., Chen, L. J., Wong, A., Tham,
C. C., Wong, T. Y., Chen, C., Ikram, M. K., Whit-
son, H. E., et al. (2019). Spectral-domain oct mea-
surements in alzheimer’s disease: a systematic review
and meta-analysis. Ophthalmology, 126(4):497–510.
Cheung, C. Y.-l., Ong, Y. T., Ikram, M. K., Ong, S. Y.,
Li, X., Hilal, S., Catindig, J.-A. S., Venketasubra-
manian, N., Yap, P., Seow, D., et al. (2014). Mi-
crovascular network alterations in the retina of pa-
tients with alzheimer’s disease. Alzheimer’s & De-
mentia, 10(2):135–142.
Dhodapkar, R. M., Li, E., Nwanyanwu, K., Adelman, R.,
Krishnaswamy, S., and Wang, J. C. (2022). Deep
learning for quality assessment of optical coherence
tomography angiography images. Scientific reports,
12(1):13775.
BIOIMAGING 2025 - 12th International Conference on Bioimaging
330

D
´
ıaz, M., Novo, J., Cutr
´
ın, P., G
´
omez-Ulla, F., Penedo,
M. G., and Ortega, M. (2019). Automatic segmenta-
tion of the foveal avascular zone in ophthalmological
oct-a images. PloS one, 14(2):e0212364.
Diogo, V. S., Ferreira, H. A., Prata, D., and Initiative, A.
D. N. (2022). Early diagnosis of alzheimer’s disease
using machine learning: a multi-diagnostic, general-
izable approach. Alzheimer’s Research & Therapy,
14(1):107.
Ferrari, L., Huang, S.-C., Magnani, G., Ambrosi, A., Comi,
G., and Leocani, L. (2017). Optical coherence tomog-
raphy reveals retinal neuroaxonal thinning in fron-
totemporal dementia as in alzheimer’s disease. Jour-
nal of Alzheimer’s Disease, 56(3):1101–1107.
Hassen, S. B., Neji, M., Hussain, Z., Hussain, A., Alimi,
A. M., and Frikha, M. (2024). Deep learning meth-
ods for early detection of alzheimer’s disease using
structural mr images: A survey. Neurocomputing,
576:127325.
Katsimpris, A., Karamaounas, A., Sideri, A. M., Katsim-
pris, J., Georgalas, I., and Petrou, P. (2022). Opti-
cal coherence tomography angiography in alzheimer’s
disease: A systematic review and meta-analysis. Eye,
36(7):1419–1426.
Koronyo, Y., Biggs, D., Barron, E., Boyer, D. S., Pearlman,
J. A., Au, W. J., Kile, S. J., Blanco, A., Fuchs, D.-T.,
Ashfaq, A., et al. (2017). Retinal amyloid pathology
and proof-of-concept imaging trial in alzheimer’s dis-
ease. JCI insight, 2(16).
Krittanawong, C., Virk, H. U. H., Bangalore, S., Wang,
Z., Johnson, K. W., Pinotti, R., Zhang, H., Kaplin,
S., Narasimhan, B., Kitai, T., et al. (2020). Machine
learning prediction in cardiovascular diseases: a meta-
analysis. Scientific reports, 10(1):16057.
Lauermann, J., Treder, M., Alnawaiseh, M., Clemens, C.,
Eter, N., and Alten, F. (2019). Automated oct angiog-
raphy image quality assessment using a deep learning
algorithm. Graefe’s Archive for Clinical and Experi-
mental Ophthalmology, 257:1641–1648.
Le, D., Son, T., Kim, T.-H., Adejumo, T., Abtahi, M.,
Ahmed, S., Rossi, A., Ebrahimi, B., Dadzie, A., Ma,
G., et al. (2024). Deep learning-based optical coher-
ence tomography angiography image construction us-
ing spatial vascular connectivity network. Communi-
cations Engineering, 3(1):28.
Lemmens, S., Devulder, A., Van Keer, K., Bierkens, J.,
De Boever, P., and Stalmans, I. (2020). Systematic
review on fractal dimension of the retinal vasculature
in neurodegeneration and stroke: assessment of a po-
tential biomarker. Frontiers in neuroscience, 14:16.
Li, M., Chen, Y., Ji, Z., Xie, K., Yuan, S., Chen, Q., and Li,
S. (2020). Image projection network: 3d to 2d image
segmentation in octa images. IEEE Transactions on
Medical Imaging, 39(11):3343–3354.
Li, M., Huang, K., Xu, Q., Yang, J., Zhang, Y., Ji, Z., Xie,
K., Yuan, S., Liu, Q., and Chen, Q. (2024). Octa-500:
a retinal dataset for optical coherence tomography an-
giography study. Medical image analysis, 93:103092.
Li, Y., El Habib Daho, M., Conze, P.-H., Zeghlache, R.,
Le Boit
´
e, H., Bonnin, S., Cosette, D., Magazzeni, S.,
Lay, B., Le Guilcher, A., et al. (2023). Hybrid fusion
of high-resolution and ultra-widefield octa acquisi-
tions for the automatic diagnosis of diabetic retinopa-
thy. Diagnostics, 13(17):2770.
Liu, X., Bi, L., Xu, Y., Feng, D., Kim, J., and Xu, X.
(2019). Robust deep learning method for choroidal
vessel segmentation on swept source optical coher-
ence tomography images. Biomedical Optics Express,
10(4):1601–1612.
Liu, X., Zhu, H., Zhang, H., and Xia, S. (2024). The frame-
work of quantifying biomarkers of oct and octa im-
ages in retinal diseases. Sensors, 24(16):5227.
Naseripour, M., Ghasemi Falavarjani, K., Mirshahi, R., and
Sedaghat, A. (2020). Optical coherence tomography
angiography (octa) applications in ocular oncology.
Eye, 34(9):1535–1545.
Nichols, E., Steinmetz, J. D., Vollset, S. E., Fukutaki, K.,
Chalek, J., Abd-Allah, F., Abdoli, A., Abualhasan, A.,
Abu-Gharbieh, E., Akram, T. T., et al. (2022). Esti-
mation of the global prevalence of dementia in 2019
and forecasted prevalence in 2050: an analysis for the
global burden of disease study 2019. The Lancet Pub-
lic Health, 7(2):e105–e125.
O’Bryhim, B. E., Apte, R. S., Kung, N., Coble, D., and
Van Stavern, G. P. (2018). Association of preclin-
ical alzheimer disease with optical coherence tomo-
graphic angiography findings. JAMA ophthalmology,
136(11):1242–1248.
Peng, Y., Keenan, T. D., Chen, Q., Agr
´
on, E., Allot, A.,
Wong, W. T., Chew, E. Y., and Lu, Z. (2020). Predict-
ing risk of late age-related macular degeneration using
deep learning. NPJ digital medicine, 3(1):111.
Qian, B., Chen, H., Wang, X., Guan, Z., Li, T., Jin, Y., Wu,
Y., Wen, Y., Che, H., Kwon, G., et al. (2024). Drac
2022: A public benchmark for diabetic retinopathy
analysis on ultra-wide optical coherence tomography
angiography images. Patterns, 5(3).
Snyder, P. J., Johnson, L. N., Lim, Y. Y., Santos, C. Y.,
Alber, J., Maruff, P., and Fern
´
andez, B. (2016).
Nonvascular retinal imaging markers of preclinical
alzheimer’s disease. Alzheimer’s & Dementia: Diag-
nosis, Assessment & Disease Monitoring, 4:169–178.
Turkan, Y. and Tek, F. B. (2022). A survey on automated
diagnosis of alzheimer’s disease using optical coher-
ence tomography and angiography. arXiv preprint
arXiv:2209.03354.
Turkan, Y. and Tek, F. B. (2023). Automated diagnosis of
ad using oct and octa: A systematic review. Authorea
Preprints.
Xue, J., Feng, Z., Zeng, L., Wang, S., Zhou, X., Xia, J.,
and Deng, A. (2024). Soul: An octa dataset based on
human machine collaborative annotation framework.
Scientific Data, 11(1):838.
Yang, D., Ran, A. R., Nguyen, T. X., Lin, T. P., Chen, H.,
Lai, T. Y., Tham, C. C., and Cheung, C. Y. (2023).
Deep learning in optical coherence tomography an-
giography: Current progress, challenges, and future
directions. Diagnostics, 13(2):326.
Yoon, J. M., Lim, C. Y., Noh, H., Nam, S. W., Jun, S. Y.,
Kim, M. J., Song, M. Y., Jang, H., Kim, H. J., Seo,
S. W., et al. (2024). Enhancing foveal avascular zone
analysis for alzheimer’s diagnosis with ai segmenta-
tion and machine learning using multiple radiomic
features. Scientific Reports, 14(1):1841.
OCTA Image-Based Machine Learning Models for Discriminating Alzheimer’s Disease from Neurodegenerative and Ocular Conditions
331
