
Optimization of a Deep-Learning-Based Cough Detector Using
eXplainable Artificial Intelligence for Implementation on Mobile Devices
P. Amado-Caballero
1 a
, I. Varona-Pe
˜
na
1
, B. Guti
´
errez-Garc
´
ıa
1
,
J. M. Aguiar-P
´
erez
1
, M. Rodriguez-Cayetano
1
, J. G
´
omez-Gil
1
, J. R. Garmendia-Leiza
2 b
and P. Casaseca-De-la-higuera
1 c
1
Departamento de Teor
´
ıa de la Se
˜
nal y Comunicaciones e Ingenier
´
ıa Telem
´
atica, E.T.S. Ingenieros de Telecomunicaci
´
on,
Universidad de Valladolid, Valladolid, Spain
2
Centro de Salud Los Jardinillos, SACYL, Palencia, Spain
Keywords:
Respiratory Diseases, Cough, Audio Analysis, CNN, XAI, Occlusion Maps, Optimization.
Abstract:
Respiratory diseases, including COPD and cancer, are among the leading causes of mortality worldwide, of-
ten resulting in prolonged dependency and impairment. Telemedicine offers immense potential for managing
respiratory diseases, but its effectiveness is hindered by the lack of reliable objective measures for symptoms.
Recent advances in deep learning have significantly enhanced the detection and analysis of coughing episodes,
a key symptom of respiratory conditions, by leveraging audio signals and pattern recognition techniques. This
paper introduces an efficient cough detection system tailored for real-time monitoring on low-end compu-
tational devices, such as smartphones. By integrating Explainable Artificial Intelligence (XAI), we identify
salient regions in audio spectrograms that are crucial for cough detection, enabling the design of an optimized
Convolutional Neural Network (CNN). The optimized CNN maintains high detection performance while sig-
nificantly reducing computation time and memory usage.
1 INTRODUCTION
Respiratory diseases, such as COPD and cancer, rank
among the leading causes of death worldwide (World
Health Organisation, 2017). These chronic illnesses
frequently result in long-term dependence and impair-
ment. Recent research (Belli et al., 2020) emphasize
the necessity for monitoring and support at home post
COVID-19 regardless of whether the individual was
hospitalized. The interaction between COVID-19 and
chronic respiratory diseases like COPD and cancer
significantly increases the likelihood of hospitaliza-
tion and mortality (World Health Organisation, 2021).
Therefore, continuous monitoring of respiratory con-
ditions is essential for detecting and managing exac-
erbations in these individuals.
The European Commission’s study on
telemedicine (European Commission, 2018) con-
cluded on its high potential in managing respiratory
diseases, yet underscored a significant gap in research
a
https://orcid.org/0000-0002-8773-3156
b
https://orcid.org/0000-0002-9573-4263
c
https://orcid.org/0000-0003-1565-0842
in this domain. Although telemedicine has shown
to be promising for cost-effective monitoring of
respiratory conditions (Audit Scotland, 2011), it
has not lived up to expectations due to the absence
of reliable objective measures for symptoms. The
effectiveness of remote consultations strongly relies
on being able to acquire such metrics, facilitating
early diagnoses and real-time monitoring for patients
with respiratory conditions (H. Pinnock et al., 2013).
Automatic detection of coughing episodes has
been investigated before, and there are proposals of
systems with acceptable sensitivity and specificity
values. The very initial systems (Birring et al., 2008;
Vizel et al., 2010; Drugman et al., 2013; Amrul-
loh et al., 2015) were based on classical machine
learning. Thus, they implemented a pattern recogni-
tion module to classify a set of time and/or spectral
domain features extracted from audio signals. Re-
cently, there has been a notable increase in employ-
ing deep learning techniques to address the challenges
of cough detection and analysis for diagnostic pur-
poses. Methods such as those detailed in (Laguarta
et al., 2020; Mingyu You et al., 2022; Tena et al.,
2022) showed promising advancements in both detec-
Amado-Caballero, P., Varona-Peña, I., Gutiérrez-García, B., Aguiar-Pérez, J. M., Rodriguez-Cayetano, M., Gomez-Gil, J., Garmendia-Leiza, J. R. and Casaseca-De-la-higuera, P.
Optimization of a Deep-Learning-Based Cough Detector Using eXplainable Artificial Intelligence for Implementation on Mobile Devices.
DOI: 10.5220/0013141500003911
Paper published under CC license (CC BY-NC-ND 4.0)
In Proceedings of the 18th International Joint Conference on Biomedical Engineering Systems and Technologies (BIOSTEC 2025) - Volume 2: HEALTHINF, pages 491-498
ISBN: 978-989-758-731-3; ISSN: 2184-4305
Proceedings Copyright © 2025 by SCITEPRESS – Science and Technology Publications, Lda.
491

tion and diagnosis, outperforming conventional ma-
chine learning approaches.
Real-time monitoring of respiratory diseases can
be easily achievable with the above-mentioned meth-
ods at a time when telehealth has moved towards
generic readily available sensors, available for dif-
ferent applications, and wearables. Recent advances
in smartphone and smartwatch technology allow the
use of these everyday devices as smart systems for
cough monitoring. These devices can easily acquire
the audio signal for analysis as well as incorporate
other sensors to capture movement associated with
a cough episode. However, in order to use a smart-
phone as a cough monitor, all the other features of
the device need to be kept functional without being
compromised by the monitoring application. No user
would want to use an application that reduces battery
life to 2 or 3 hours. The complexity of the opera-
tions required for cough detection and analysis must
therefore be taken into account, especially when deep
learning is involved. Existing mobile solutions to date
have not focused on efficient implementations to re-
duce battery consumption and do not guarantee con-
tinuous real-time monitoring.
This paper proposes an efficient cough detector
designed for real-time monitoring on low-end compu-
tational devices, including smartphones. Explainable
Artificial Intelligence (XAI) is initially employed to
identify salient regions in audio spectrograms that a
convolutional neural network (CNN) considers mean-
ingful for cough detection. After that, an optimized
CNN is designed based on these salient regions as
inputs. Results show that the detection performance
achieved by the optimized models is comparable to
that of the non-optimized ones, while computation
times and memory footprint are significantly reduced.
The structure of the paper is organized as fol-
lows: Section 2 presents the materials employed in
the study. section 3 explains the methodology applied
for cough identification and the different optimiza-
tions applied Results are presented and discussed in
section 4. Finally, section 5 summarizes the conclu-
sions extracted from the study.
2 MATERIALS
Our group of subjects consists of 20 patients aged be-
tween 23 and 87 years (9 women, 11 men) with the
following respiratory pathologies: Acute respiratory
disease (ARD, 3), pneumonia (4), chronic obstruc-
tive pulmonary disease (COPD,6), lung cancer (3),
and others such as asthma, bronchiectasis or sarcoido-
sis (remaining patients). An observational study of
cough evolution during 24 hours of a patient’s nor-
mal life was carried out. Twenty-four hours of audio
from ambulatory patients in the Palencia Health Area
(Spain) were prospectively recorded. The database
consists of approximately 15,000 cough events cor-
responding to the subjects mentioned above. A Sony
Xperia Z2 Android smartphone was used to collect
the data using 16-bit WAV format at 44.1 kHz. Each
patient was instructed to store the device as they
would normally do to capture samples in a real en-
vironment where noise may be encountered. These
noisy signals were used as non-cough events for com-
parison with the recorded coughs, getting two sepa-
rate sets. The study was carried out in accordance
with the Declaration of Helsinki and was approved by
the
´
Area de Salud de Palencia Research Ethics Com-
mittee (REC number: 2023/027). Subjects provided
their informed consent before the recordings
3 METHODS
Cough detection was initially carried out using a non-
optimized CNN in two steps:
1. Audio Signal Preprocessing: The 44.1 kHz au-
dio signal collected by the smartphone was
transformed into spectrograms to obtain a time-
frequency representation of the signal. The fol-
lowing process was carried out for this purpose:
• The audio signal is first 5x downsampled to
8.82 kHz. Then, the power spectral den-
sity (PSD) is calculated, using 10 ms non-
overlapping windows with Hanning weighting.
• Once these PSDs are obtained, they are con-
catenated over 1s intervals, forming a set of
45x100 spectrograms.
• Finally, these time-frequency representations
undergo logarithmic normalization.
2. Cough Window Identification: To distinguish
spectrograms corresponding to cough events, we
devised a custom CNN from scratch. This net-
work begins with a convolutional layer contain-
ing 32 filters, each with 2 × 2 kernels, and uti-
lizes a ReLU activation function. Following this
is a 2 × 2 Max-Pool layer to reduce dimension-
ality, accompanied by a dropout layer to mitigate
overfitting. This architecture is then repeated with
the number of filters doubled. The final sequence
of layers before the output consists of a convo-
lutional layer with 128 filters, a dropout layer,
another convolutional layer with 256 filters, and
a concluding Max-Pool layer. The output from
this setup is resized to fit the output architecture,
HEALTHINF 2025 - 18th International Conference on Health Informatics
492
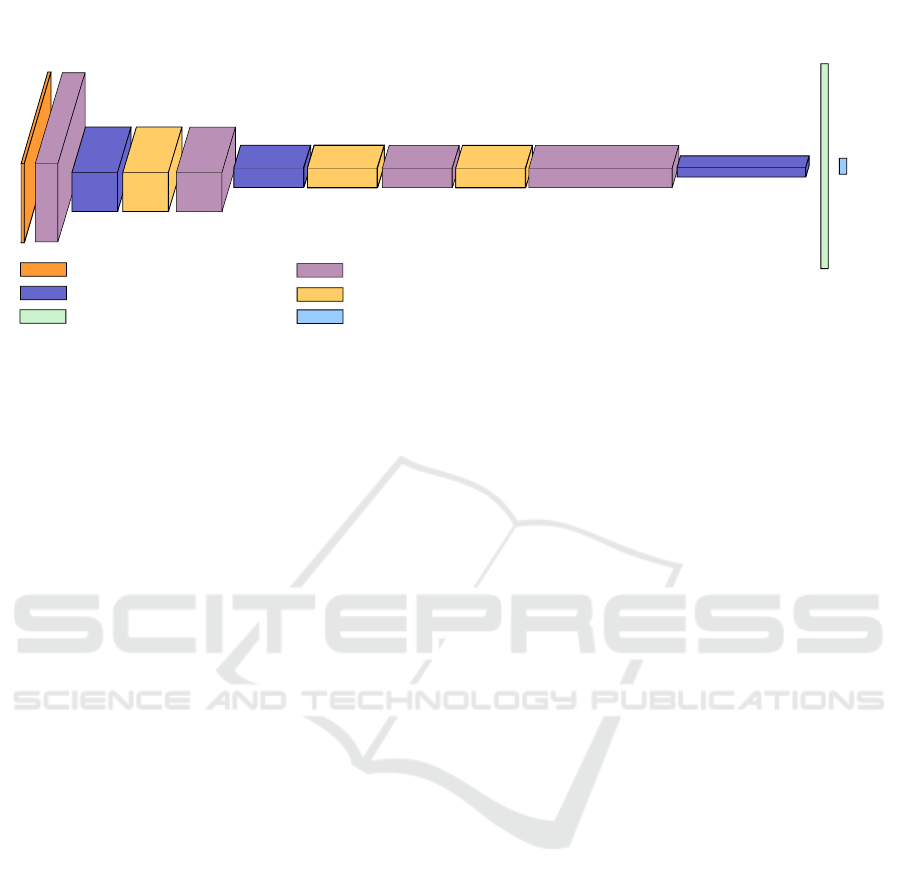
45x100x1
45x100x32
11x25x128
22x50x64
11x25x256
5x12x256
512x1
2x1
CONVOLUTIONAL LAYER. ACTIVATION:RELU FILTER SIZE: 2X2
MAX-POOL 2X2
DROPOUT 10%
FULLY CONNECTED LAYER.
ACTIVATION: RELU
SOFTMAX LAYER
INPUT SPECTROGRAM
Figure 1: CNN architecture for cough detection.
which comprises two Fully-Connected layers: the
first with 512 neurons followed by a ReLU activa-
tion, and the second with two neurons and a soft-
max activation. Training was carried out using the
AdaMax optimizer (α = 0.002) (Kingma and Ba,
2015), batch size= 128 and 50 epochs. To avoid
overfitting, we employed a validation set compris-
ing 20% of the training dataset, which itself con-
stituted 80% of the entire audio clips collection.
This procedure is repeated on 5 cross-validation
folds. Figure 1 illustrates a block diagram of the
employed CNN.
To enable the CNN detector to function directly on
smartphones, we utilized TensorFlow Lite (TFLite), a
framework that converts TensorFlow models trained
in desktop or cloud environments into a smaller, op-
timized format suitable for mobile and embedded de-
vices. This conversion process reduces the model’s
size but often results in decreased performance in
terms of accuracy, sensitivity, and specificity. To mit-
igate this loss, we implemented the following opti-
mizations:
1. Using Explainable AI (XAI) to adjust the network
input.
2. Fine-tune the network’s hyperparameters.
3. Applying TFLite’s own optimization techniques
after the initial optimizations were completed.
3.1 Optimizing the CNN Input Using
XAI
Once the initial CNN was trained, we analyzed the
network’s behavior to identify significant regions for
cough detection in the spectrograms. For this pur-
pose, we employed the methodology proposed in
(Amado-Caballero et al., 2023) for ADHD diagnosis.
We selected those spectrograms in the validation set
for which the original network output identified cough
with confidence levels (soft output, posterior proba-
bility) higher than 90%.For each spectrogram meeting
this criterion, we computed its occlusion map.(Zeiler
and Fergus, 2014). The process of generating the oc-
clusion map involves defining a mask which is placed
over the input spectrogram hiding part of their infor-
mation to the CNN. The class probability of the CNN
fed by this input allows estimating the importance of
the hidden area for classification (higher probability
means lower importance). The process is repeated
until the whole spectrogram is covered. The output
values are stored in a matrix that is resized to have the
same dimensions as the original input. Once we have
these oclussion maps, we used them to adapt the input
set to improve the performance of the network. This
process of adaptation was defined as follows :
• First, each spectrogram is weighted with its cor-
responding occlusion map. Those areas in the
weighted spectrogram whose values were higher
than 0.7, defined a mask with the relevant spec-
trogram information. Some examples of these
weighted spectrograms are shown in figure 3.
• Once we have all the masks, we pixel-averaged
them to obtain a final mask highlighting the rel-
evant spectrogram information for all patients.
This average mask, highlights where the highest
concentration of useful information for cough de-
tection is located.
The obtained average mask can be applied to re-
duce the dimensionality of the input spectrogram and
consequently simplify the network. The masks in fig-
ures 2 and 3 show relevant areas with meaningful en-
ergy at different time stamps. We defined two regions
with different energy content. In order to do that, we
Optimization of a Deep-Learning-Based Cough Detector Using eXplainable Artificial Intelligence for Implementation on Mobile Devices
493
90%
Frequency
(KHz)
Time (s)
70%
Figure 2: Illustration of the process to obtain weighted spectrograms.
Figure 3: Examples of weighted spectrograms.
set two thresholds for the weighted spectrogram val-
ues, which respectively defined two timestamps af-
ter which, all the values were below those thresholds.
Specifically, after t = 0.6s, no energy above 0.3937
was present. After t = 0.8s, all the values were be-
low 0.1087. This process led to two sets of spectro-
grams with respective sizes 45x76 (trim1) and 45x59
(trim2). This process is explained in figure 4.
3.2 Fine-Tuning of Hyperparameters
This is a well-known technique in deep and machine
learning that consists of optimizing the hyperparam-
eter values of a model to improve its performance on
a specific task. Unlike model parameters, which are
learned from training data, hyperparameters are pre-
defined settings that influence the overall behavior of
the model.
In this scenario, we aim at improving the perfor-
mance of the network in terms of accuracy and pro-
cessing time, in view of the implementation of Ten-
sorFlow Lite. For this purpose, we have focused on
optimizing the dropout rate, the number of filters of
the convolutional layers, the learning rate, and the
number of dense units.
To achieve this, a grid search strategy was em-
ployed to explore a predefined range of hyperparam-
eters systematically. Specifically, for the first convo-
lutional layer, the number of filters was tested with
values of 32 and 64, and the kernel size was evalu-
ated with dimensions of (3, 3) and (5, 5), alongside
dropout rates of 0.1 and 0.2. For the second convolu-
tional layer, filters ranged from 64 to 128, kernel sizes
were (3, 3) and (5, 5), and dropout rates were 0.1 and
0.2. Similarly, the third convolutional layer tested fil-
ter values of 128 and 256, kernel sizes of (3, 3) and
(5, 5), and dropout rates of 0.1 and 0.3. Fully con-
nected layers were fine-tuned with units of 128 and
256, and the optimizers ’adam’ and ’rmsprop’ were
considered with learning rates of 0.001 and 0.01. The
optimal combination of hyperparameters was deter-
mined based on the best validation accuracy, ensuring
that the network could generalize effectively while
maintaining efficient processing for deployment.
3.3 TFLite
TFLite, short for TensorFlow Lite, is a lightweight
version of TensorFlow (Abadi et al., 2015) designed
specifically for mobile and embedded devices. It is
used to deploy machine learning models on devices
with limited computational resources, such as smart-
phones, IoT devices, and microcontrollers. TFLite
models are optimized for efficiency, allowing them to
HEALTHINF 2025 - 18th International Conference on Health Informatics
494
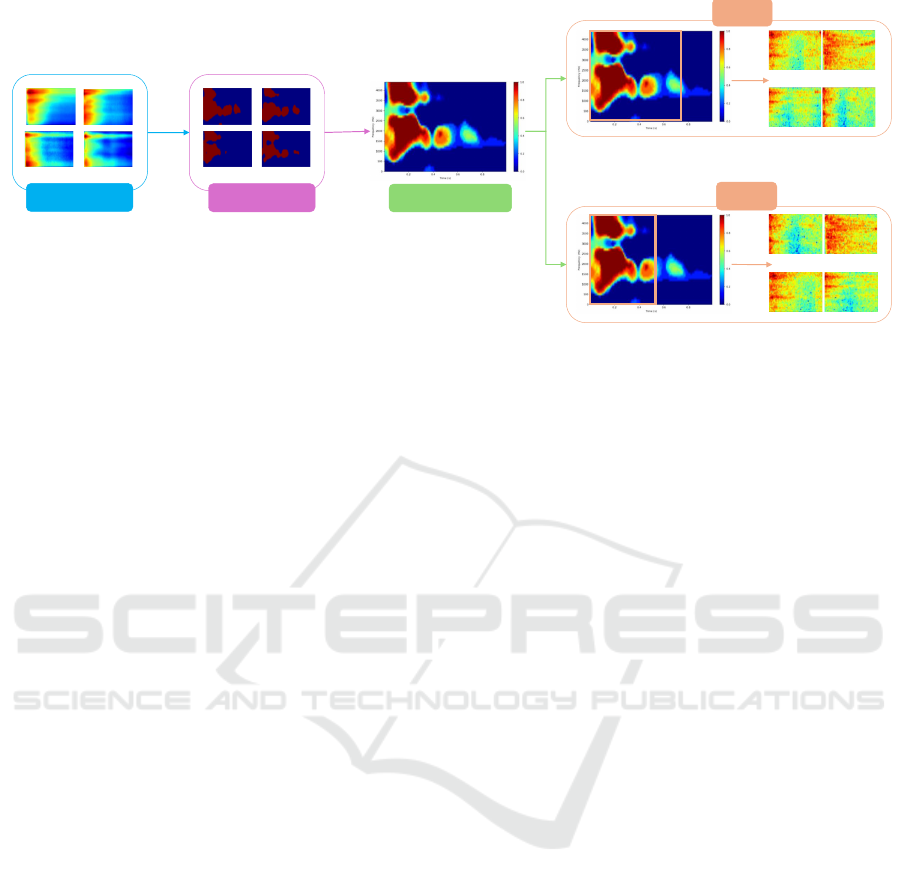
Masks
Averaged Mask
Trim 1
Trim 2
Pixel-Averaged
Oclusion Map
Figure 4: Diagram of the procedure to obtain trimmed data.
run inference tasks quickly and with minimal memory
footprint.
TFLite offers several optimization options to
achieve efficient model deployment. One common
optimization is quantization, which reduces the preci-
sion of model weights and activations from floating-
point numbers to integers, thereby reducing memory
usage and improving inference speed. Another opti-
mization technique is model pruning, which involves
removing unnecessary weights and connections from
the model to reduce its size while preserving accu-
racy. Additionally, TFLite provides optimizations for
default performance metrics, minimizing model size,
and reducing inference latency, further enhancing the
efficiency of model deployment.
Before optimizing a model with TFLite, it is typi-
cally optimized in its original format. Once the model
is optimized and trained, it can be converted to the
TFLite format using tools provided by TensorFlow.
During the conversion process, various optimizations
can be applied to further improve the model’s effi-
ciency such as default, size, and latency optimiza-
tions. Default optimizations aim to balance accu-
racy and efficiency, providing a good compromise be-
tween model size and inference speed. Size optimiza-
tions focus on reducing the model’s memory footprint
by applying techniques like quantization and prun-
ing. Latency optimizations prioritize reducing infer-
ence time, often at the expense of model accuracy,
by employing techniques such as model architecture
modifications and hardware acceleration utilization.
4 RESULTS AND DISCUSSION
In this section, we present the findings in tabular
format, corresponding to the optimized models,
their hyperparameters, and their performance in
terms of sensitivity, specificity, accuracy, processing
time, model size -useful for mobile application
deployment-, and area under the receiver operating
characteristic curve (AUC). These tables provide a
comprehensive overview of the models’ effectiveness
and efficiency, highlighting the key metrics that
indicate their suitability for mobile solutions without
losing quality properties.
In table 1, the initial CNN model described in Sec-
tion 3 is compared with two optimized models for
which, only the XAI-enabled optimization was per-
formed. The model format remains consistent; only
the input data change. The non-optimized option em-
ploys the original dataset, whereas Trim1 and Trim2
models respectively use 45 × 76 and 45 × 59 spectro-
grams. The models’ training and inference calcula-
tions were conducted using 5-fold cross-validation on
a NVIDIA RTX A5000 GPU with 24 GB of RAM.
As observed, accuracy values remain quite
consistent, while the memory footprint decreases
considerably. Furthermore, the processing time is
significantly reduced (to less than a half for trim1.
This reduction in processing time is particularly
valuable as the aim is to integrate the model into
a mobile application. However, it is worth noting
that when converting the model to TFLite for mobile
deployment, the processing time tends to increase.
Therefore, the primary objective is to minimize
processing time to ensure that the overall system
processing time remains manageable once the model
is converted to TFLite and integrated into the mobile
application. Additionally, while there is a slight
decrease in sensitivity, both specificity and AUC
remain stable.
Optimization of a Deep-Learning-Based Cough Detector Using eXplainable Artificial Intelligence for Implementation on Mobile Devices
495

Table 1: Results after XAI optimization.
Model Accuracy MBytes Processing
time(ms)
Sensitivity Specificity AUC
Not optimized 0.899881 9.030396 0.385252803 0.901223 0.898539 0.963786
Trim 1 0.8907 6.780409 0.1172742286 0.8876 0.893853 0.9580
Trim 2 0.8967 5.280396 0.210223381 0.889677 0.9038 0.9610
Table 2: Results for optimized models after XAI and hyperparameter optimization.
Model Accuracy MBytes Processing time(ms) Sensitivity Specificity AUC
T1G 0.888663077 1.120727539 0.043483994 0.87236741 0.904958761 0.954158359
T2G 0.89151423 1.062339783 0.032692982 0.876838733 0.906189746 0.957366015
Table 2, presents results for hyperparameter op-
timization using 5-fold cross-validation on the same
RTX A5000 GPU. The table’s construction involved
utilizing Keras Tuner to fine-tune hyperparameters.
The 5 models underwent training across 5 data folds,
followed by performance evaluation, leading to the
calculation of mean performance metrics for different
hyperparameter sets. Models were trained using
data from Trim1 (coded as T1G in table) and Trim2
(coded as T2G ). In this optimization process, nearly
all the performance figures remain constant except
for the model’s memory footprint and processing
time, which have both decreased drastically, yielding
highly favorable results. Among the two trims, Trim2
appears to be the better option. Given these findings,
it is logical to leverage data trims for model optimiza-
tion, with Trim2, being smaller and yielding superior
results, chosen for further optimization efforts. Table
3 summarizes the finally selected hyperparameters
for the best performing models.
Table 4 shows performance metrics after TFLite
optimization of the best Trim2 model. Metrics were
obtained using a desktop computer with Intel(R)
Core(TM) i7-7700 CPU @ 3.60GHz and 16 GB
RAM. It can be seen that the most effective approach
for optimizing the TFLite model appears to be the
one without any TFLite-specific optimizations. This
method involves optimizing the model in HDF5
format first and then converting it to TFLite. The op-
timized models (default, size, and latency) do achieve
substantial reductions in model size, decreasing from
about 0.51 MB to approximately 0.13 MB. Although
there is a slight decrease in accuracy, which is barely
noticeable, it significantly improves processing time
compared to other optimization methods. Specif-
ically, the “none” approach results in the fastest
processing time (0.14 ms), which is notably quicker
than the optimized models that take around 0.25
seconds. This faster processing time is critical in
applications where speed is a priority, even if it
means maintaining a larger model size. Additionally,
it is noteworthy that all optimization approaches yield
very similar values for specificity, sensitivity and
AUC. This minimal impact on accuracy and other
performance metrics across different optimizations
implies that the intrinsic quality of the model remains
robust regardless of the TFLite-specific optimizations
applied.
As discussed above, optimizing hyperparame-
ters in convolutional neural networks (CNNs) can
significantly impact their performance. Comparing
the default configuration with the optimized one
reveals key changes that enhance the network’s
efficiency and adaptability. The default setup uses
the Adam optimizer with a dropout rate of 0.1, no
regularization, and a higher number of filters in
the convolutional layers, ranging from 32 to 128.
In contrast, the optimized configuration employs
RMSprop, which dynamically adjusts the learning
rate, and reduces the dropout rate to 0.001, allowing
more information to be retained during training.
Additionally, this setup reduces the number of filters
to 16 in the initial layers and slightly increases
them in the final layer, decreasing computational
complexity while maintaining the ability to capture
essential features. The kernel size is consistently kept
at 2x2 in the optimized setup, aiding in capturing fine
local details. These adjustments make the network
more efficient, faster to converge, and less prone to
overfitting compared to the default configuration,
making it better suited for our specific application.
Table 5, shows the performance of the previously
mentioned TFlite models (Default, T1G, and T2G)
tested in Android Studio. We observe the same be-
havior that has been explained throughout this sec-
tion. While it is true that the execution time is higher
on the emulator compared to the computer, this is
due to the computer being much more powerful than
the Android Studio emulator. The accuracy decreases
HEALTHINF 2025 - 18th International Conference on Health Informatics
496
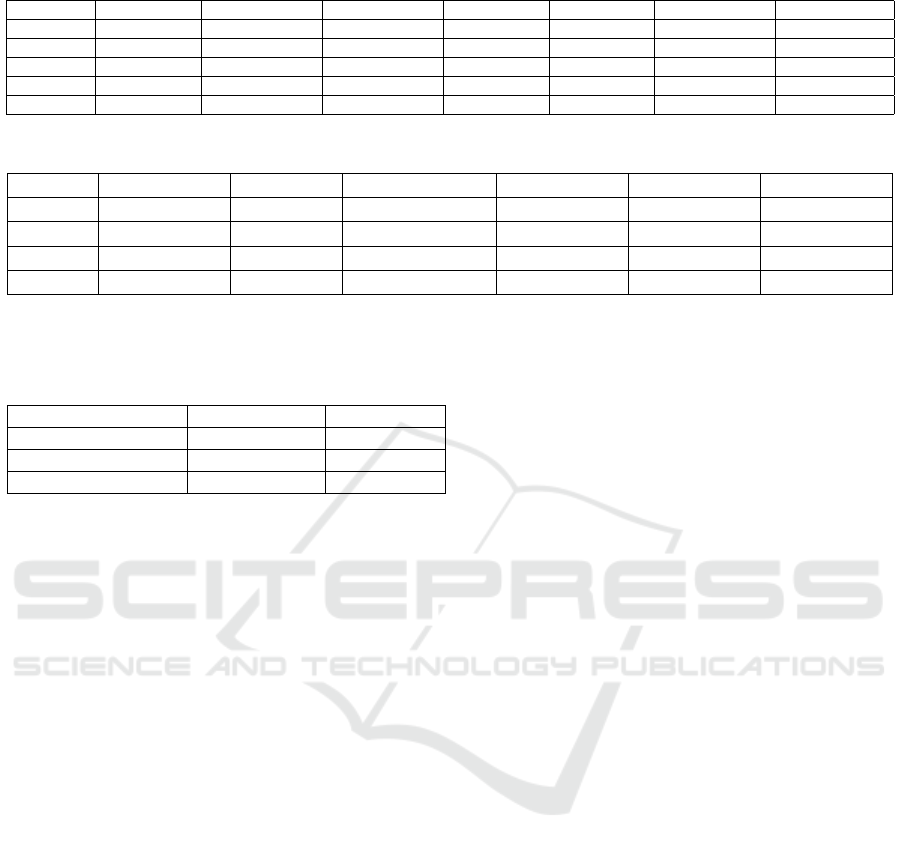
Table 3: Model Parameters.
Model Filters1 Kernel Size1 Dropout Rate1 Filters2 Kernel Size2 Dropout Rate2 Filters3
modelT1G 16 2 0.001 16 2 0.001 16
modelT2G 16 2 0.001 16 2 0.001 16
Model Kernel Size3 Dropout Rate3 Filters4 Kernel Size4 Units Optimizer Learning Rate
modelT1G 2 0.001 32 2 32 rmsprop 0.001
modelT2G 2 0.001 32 2 224 rmsprop 0.001
Table 4: Results after XAI, hyperparameters, and TFLite Optimization.
Name Accuracy Mbytes Proc Time(ms) Sensitivity Specificity AUC
None 0.891436808 0.5086212 0.143704203 0.876648823 0.905753472 0.95733939
Default 0.891511336 0.1345244 0.256185187 0.877022051 0.90552434 0.957337036
Size 0.891511336 0.1345244 0.25754078 0.877022051 0.90552434 0.957337036
Latency 0.891511336 0.1345244 0.254893658 0.877022051 0.90552434 0.957337036
Table 5: Accuracy and computation times for Android Stu-
dio.
Model Time (s) Accuracy
TFlite, not optimized 0.00381101875 0.857818278
T1G 0.00330349268 0.864615958
T2G 0.00296955678 0.867987304
slightly, but this reduction is not very significant. By
using the Profiler tool from Android Studio, which
is located inside the emulator, it can be seen that the
memory used for our model, Native memory, occu-
pies approximately 170 MB of the 256 MB used by
the application. Furthermore, the model utilizes about
38% of the CPU. A consistent observation is that the
Trim2 (T2G) model, representing the second trim,
performs best. It outperforms both the Trim1 (T1G)
model and the original model directly converted to
TFlite (Default). This indicates that the trimming pro-
cess yields positive results, both on a powerful com-
puter and on the Android Studio emulator.
5 CONCLUSIONS
This study demonstrates the effectiveness of using
XAI techniques to enhance the performance of neu-
ral networks. By highlighting the most relevant spec-
tral regions for cough detection, we created a more
focused dataset that improved processing time and re-
duced data size. Coupled with a thorough optimiza-
tion of the CNN’s hyperparameters, these techniques
facilitated the deployment of the network on devices
with limited hardware, such as smartphones, with-
out compromising efficiency. Although preliminary
tests on smartphone emulators are promising, further
live testing is necessary to evaluate performance un-
der real-world conditions.
ACKNOWLEDGEMENTS
This work is part of projects TED2021-
131536B-I00, funded by Spanish
MCIN/AEI/10.13039/501100011033 and EU’s
“NextGenerationEU”/PRTR and GRS 2837/C/2023
funded by Gerencia Regional de Salud, Junta de
Castilla y Le
´
on, Spain. The work was also partly
supported by the EU Horizon 2020 Research and
Innovation Programme under the Marie Sklodowska-
Curie grant agreement No 101008297. This article
reflects only the authors’ view. The European Union
Commission is not responsible for any use that may
be made of the information it contains.
REFERENCES
Abadi, M., Agarwal, A., Barham, P., Brevdo, E., Chen, Z.,
Citro, C., Corrado, G. S., Davis, A., Dean, J., Devin,
M., et al. (2015). TensorFlow: Large-scale machine
learning on heterogeneous systems. Software avail-
able from tensorflow.org.
Amado-Caballero, P., de-la Higuera, P. C., Alberola-L
´
øpez,
S. ., de Llano, J. M. A., s, J. A. L.-V., and Alberola-
L
´
øpez, C. (2023). Insight into ADHD diagnosis with
deep learning on actimetry: Quantitative interpreta-
tion of occlusion maps in age and gender subgroups.
Artificial Intelligence in Medicine, 143:102630.
Amrulloh, Y. A., Abeyratne, U. R., Swarnkar, V., Triasih,
R., and Setyati, A. (2015). Automatic cough segmen-
tation from non-contact sound recordings in pediatric
wards. Biomedical Signal Processing and Control,
21(Supplement C):126 – 136.
Audit Scotland (2011). A review of Telehealth in Scotland.
Technical report, Audit Scotland.
Belli, S., Balbi, B., Prince, I., Cattaneo, D., Masocco, F.,
Zaccaria, S., Bertalli, L., Cattini, F., Lomazzo, A.,
Dal Negro, F., et al. (2020). Low physical functioning
and impaired performance of activities of daily life in
Optimization of a Deep-Learning-Based Cough Detector Using eXplainable Artificial Intelligence for Implementation on Mobile Devices
497

COVID-19 patients who survived hospitalisation. Eu-
ropean Respiratory Journal, 56(4).
Birring, S. S., Fleming, T., Matos, S., Raj, A. A., Evans,
D. H., and Pavord, I. D. (2008). The leicester
cough monitor: preliminary validation of an auto-
mated cough detection system in chronic cough. Eu-
ropean Respiratory Journal, 31(5):1013–1018.
Drugman, T., Urbain, J., Bauwens, N., Chessini, R., Valder-
rama, C., Lebecque, P., and Dutoit, T. (2013). Ob-
jective study of sensor relevance for automatic cough
detection. IEEE Journal of Biomedical and Health In-
formatics, 17(3):699–707.
European Commission (2018). Market study on
telemedicine. Technical report, European Union.
H. Pinnock et al. (2013). Effectiveness of telemonitoring in-
tegrated into existing clinical services on hospital ad-
mission for exacerbation of chronic obstructive pul-
monary disease: researcher blind, multicentre, ran-
domised controlled trial. BMJ, 347.
Kingma, D. P. and Ba, J. (2015). Adam: A method for
stochastic optimization. In Bengio, Y. and LeCun,
Y., editors, 3rd International Conference on Learn-
ing Representations, ICLR 2015, San Diego, CA, USA,
May 7-9, 2015, Conference Track Proceedings.
Laguarta, J., Hueto, F., and Subirana, B. (2020). COVID-
19 artificial intelligence diagnosis using only cough
recordings. IEEE Open Journal of Engineering in
Medicine and Biology, 1:275–281.
Mingyu You et al. (2022). Automatic cough detection
from realistic audio recordings using C-BiLSTM with
boundary regression. Biomedical Signal Processing
and Control, 72:103304.
Tena, A., Claria, F., and Solsona, F. (2022). Automated
detection of covid-19 cough. Biomedical Signal Pro-
cessing and Control, 71:103175.
Vizel, E., Yigla, M., Goryachev, Y., Dekel, E., Felis, V.,
Levi, H., Kroin, I., Godfrey, S., and Gavriely, N.
(2010). Validation of an ambulatory cough detection
and counting application using voluntary cough under
different conditions. Cough, 6(1):3.
World Health Organisation (2017). The Global Impact of
Respiratory Disease. European Respiratory Society.
World Health Organisation (2021). WHO Coronavirus
(COVID-19) Dashboard. https://covid19.who.int/.
Zeiler, M. D. and Fergus, R. (2014). Visualizing and under-
standing convolutional networks. In European confer-
ence on computer vision, pages 818–833. Springer.
HEALTHINF 2025 - 18th International Conference on Health Informatics
498
