
Non-Invasive People Counting in Smart Buildings: Employing Machine
Learning with Binary PIR Sensors
Azad Shokrollahi
1 a
, Fredrik Karlsson
2
, Reza Malekian
1 b
, Jan A. Persson
1 c
and Arezoo Sarkheyli-H
¨
agele
1
1
Internet of Things and People Research Center, Department of Computer Science and Media Technology,
Malm
¨
o University, 211 19 Malm
¨
o, Sweden
2
Sony Network Communications, 215 32 Lund, Sweden
Keywords:
Smart Buildings, Occupancy Information, People Counting, Binary PIR Sensors, Machine Learning,
Non-Invasive Sensors.
Abstract:
People counting in smart buildings is crucial for the efficient management of building systems such as energy,
space allocation, efficiency, and occupant comfort. This study investigates the use of two non-invasive binary
Passive Infrared (PIR) sensors for estimating the number of people in seven office rooms with different people
counting intervals. Previous studies often relied on sensor fusion or more complex signal-based PIR sensors,
which increased hardware costs, raised privacy concerns, and added installation complexity. Our approach
addresses these limitations by utilizing fewer sensors, reducing hardware costs, and simplifying installation,
making it scalable and flexible for different room configurations, while also ensuring high consideration of
privacy. Additionally, binary PIR sensors are typically part of smart building systems, eliminating the need for
additional sensors. We employed several machine learning methods to analyze motion detected by binary PIR
sensors, improving the accuracy of people counting estimates. We analyzed important features by extracting
event count, duration, and density from sensor data, along with features from the room’s shape, to estimate the
number of people. We used different machine learning models for estimating the number of people. Models
like Gradient Boosting, XGBoost, MLP, and LGBM demonstrated superior performance for their strong ability
to handle complex, non-linear relationships in sensor data, high-dimensional datasets, and imbalanced data,
which are common challenges in people counting tasks using PIR sensors. These models were evaluated
using performance metrics such as accuracy and F1-score. Additionally, the results show that features such as
passage events and the number of detected events, combined with machine learning algorithms, can achieve
good accuracy and reliability in people counting.
1 INTRODUCTION
Smart buildings integrate technology and infrastruc-
ture to enhance operational efficiency and improve
the quality of life for people by automating processes
and making decisions based on data (Alsafery et al.,
2023; Jamali et al., 2024; Liu et al., 2023; Chaudhari
et al., 2024; Natarajan et al., 2023). A key feature
of smart buildings is the use of advanced technology,
particularly the incorporation of Internet of Things
(IoT) sensors, to gather data on occupancy informa-
tion. This data is essential for various applications,
including optimizing energy use by adjusting systems
a
https://orcid.org/0000-0006-2237-3010
b
https://orcid.org/0000-0002-2763-8085
c
https://orcid.org/0000-0002-9471-8405
like lighting, heating, ventilation, and air condition-
ing based on occupancy. Other key applications in-
volve enhancing occupant comfort and security, as
well as improving building management, such as op-
timizing resource utilization and providing guidance
within smart office environments.(Zhao et al., 2022).
However, the accuracy of this data can be affected by
challenges such as optimal sensor placement and pri-
vacy concerns (Ramzan et al., 2024). As IoT technol-
ogy continues to advance and the demand for smart
building solutions grows, there is an increased focus
on improving methods for generating accurate occu-
pancy data. This includes addressing privacy con-
cerns and improving data accuracy (Chaudhari et al.,
2024).
Occupancy information, including detecting pres-
ence, people counting, locating, activity detection,
394
Shokrollahi, A., Karlsson, F., Malekian, R., Persson, J. A. and Sarkheyli-Hägele, A.
Non-Invasive People Counting in Smart Buildings: Employing Machine Learning with Binary PIR Sensors.
DOI: 10.5220/0013141800003890
In Proceedings of the 17th International Conference on Agents and Artificial Intelligence (ICAART 2025) - Volume 3, pages 394-405
ISBN: 978-989-758-737-5; ISSN: 2184-433X
Copyright © 2025 by Paper published under CC license (CC BY-NC-ND 4.0)

tracking, and identification, is crucial for the manage-
ment of smart buildings, each presenting unique ben-
efits and different applications in the smart building
context (Shokrollahi et al., 2024). People counting is
one of the levels that can be used in different applica-
tions in smart buildings. Determining the number of
people in a given space is essential in numerous types
of applications and is widely applied in various appli-
cations (Zhao et al., 2022). Accurate people counting
or estimation may result in substantial improvements
in energy management, space utilisation, security and
so on (Zhai et al., 2024; Gao et al., 2024).There are
three main kinds of approaches for people counting in
a given space: non-invasive, vision-based, and semi-
invasive sensors. Every category has unique char-
acteristics and is used in certain applications. Envi-
ronments that place a high value on privacy are es-
pecially inclined towards using non-invasive sensors,
since they do not collect sensitive personal data. On
the other hand, vision-based sensors use cameras and
image processing technology to identify and quan-
tify individuals, offering a significant amount of accu-
racy but possibly giving rise to concerns over privacy.
Semi-invasive sensors achieve a compromise between
the two, providing both modest privacy and exten-
sive data collection. Today, non-invasive sensors are
becoming more popular in a variety of applications
as people become more concerned about their per-
sonal privacy. Additionally, advancements in machine
learning approaches have enabled these sensors to in-
fer more information from the sensor data than was
previously possible (Alsafery et al., 2023; Li et al.,
2024). Tao Li et al. discussed different types of sen-
sors used for people counting, along with occupancy
prediction algorithms such as statistical stochastic al-
gorithms, heuristic algorithms, nature-inspired meta-
heuristic algorithms, and hybrid algorithms. They
also noted that most research or implemented cases
focus on office and residential buildings for people
counting applications (Li et al., 2024).
The rest of the paper is organized as follows: Sec-
tion 2 discusses related work, providing an overview
of existing methods and approaches in people count-
ing using various sensors and techniques. Section 3
presents the methodology used for non-invasive peo-
ple counting with binary PIR sensors. Section 4
presents the results, discussing the performance of
various machine learning models. Finally, Section
5 concludes the paper, summarizing the key findings
and implications of the research.
2 RELATED WORK
Vision-based approaches for people counting utilize
RGB cameras and computer vision techniques with
machine learning for precise occupancy estimation
(Zhai et al., 2024; Alhawsawi et al., 2024; Wang et al.,
2023). Navarro et al. used these methods for accurate
people counting (Navarro et al., 2022). Alishahi et
al. combined cameras and WiFi for occupancy pre-
diction (Alishahi et al., 2022). Brazauskas et al. de-
veloped ”Cerberus,” a privacy-preserving system us-
ing ceiling-mounted cameras and facial recognition,
offering cost-effective indoor monitoring (Brazauskas
et al., 2024). Regarding semi-invasive sensors, Sahoo
et al. conducted research using a privacy-respecting
thermal camera. The method was assessed against
several categorization algorithms in both sparse and
dense scenarios (Sahoo and Lone, 2023). The Ther-
mal Sensor Data-driven Occupancy Estimation Sys-
tem (TODOS) was created by Rajabi et al. as the
most advanced way to count people. It uses deep con-
volutional neural networks to achieve accuracy rates
of 98% to 100% (Rajabi et al., 2023). Naser et al.
employed the Thermal Sensor Array (TSA) architec-
ture to address challenges arising from diverse sensor
placements and environmental conditions. This archi-
tecture utilizes a deep convolutional encoder-decoder
network combined with an adaptive boosting tech-
nique, effectively segmenting human presence and
calculating occupancy with a maximum accuracy of
100% from sensor locations (Naser et al., 2020).
With regard to non-invasive sensors, using CO2
sensors is more popular for people counting in build-
ings (Risuleo et al., 2015; Tomokazu, ; Jiang et al.,
2016). The study conducted by Kim et al. used ma-
chine learning algorithms to predict occupancy levels
using data on CO2 concentration and ventilation sys-
tem information. The models achieved an accuracy of
0.9180 (Kim et al., 2023). Liang et al. also showed
how useful it is to use LSTM models along with cheap
CO2 sensors (Liang et al., 2024). In another study,
Lu et al. covered non-intrusive occupancy estima-
tion in buildings by combining deep learning with fea-
ture engineering. Their network used data from sen-
sors measuring environmental factors such as temper-
ature, CO2, and TVOC, as well as human interactions
with building components like windows and air con-
ditioning systems (Lu, 2024). Wang et al. used en-
vironmental sensors and Wi-Fi technology to predict
office occupancy using kNN, SVM, and ANN mod-
els. They determined that the ANN model was the
most accurate. The maximum recorded occupancy
was 14 persons, and the integration of Wi-Fi and en-
vironmental data enhanced the reliability of predic-
Non-Invasive People Counting in Smart Buildings: Employing Machine Learning with Binary PIR Sensors
395

tions (Wang et al., 2018). Furthermore, Amayri et
al. used sensors like motion detectors, CO2 concen-
tration sensors, and power consumption monitors to
assess room occupancy at different levels, such as
Level 1 ((= 0), (> 0)), Level 2 ((= 0), (> 0 ≤ 3),
(> 3)), Level 3 ((= 0), (> 0 ≤ 2), (> 2 ≤ 4), (> 4)),
Level 4 ((= 0), (> 0 ≤ 1), (> 1 ≤ 2.2), (> 2.2 ≤ 3.2),
(> 3.2)), and Level 5 ((= 0), (> 0 ≤ 1), (> 1 ≤ 2),
(> 2 ≤ 3), (> 3 ≤ 4)). Their work utilized machine
learning algorithms, notably decision trees and ran-
dom forests, producing an average estimation error
of 0.18 to 0.19 (Amayri et al., 2016). In another
significant study, Dobrilovic et al. employed Multi-
Layer Perceptron Regression (MLPR) with Wireless
Sensor Networks (WSN) data, including light, tem-
perature, sound, CO2, and PIR motion sensors, to
estimate room occupancy with high accuracy (up to
98.20%). Their research focused on optimizing the
MLPR model for various sensor combinations in a 24-
square-meter space (Dobrilovic et al., 2023). To esti-
mate room occupancy, Mao et al. developed a non-
invasive sensor fusion technique that included tem-
perature, CO2, sound, and PIR sensor data. They
tested models such as Random Forest, SVM, XG-
Boost, and Multilayer Perceptrons and found that
Random Forest performed the best. Their technique
demonstrates how machine learning may improve en-
ergy efficiency by precisely counting room occupants
using non-intrusive sensors (Mao et al., 2023). Hob-
son et al. conducted a study to investigate cost-
effective techniques for estimating the number of peo-
ple in buildings. They used sensor fusion from Wi-
Fi access points, CO2 sensors, PIR motion detectors,
and electrical load metres. The researchers created
models using both multiple linear regression and ar-
tificial neural networks. They discovered that Wi-Fi
device counts were very useful, with average R2 val-
ues ranging from 80.1% to 83.0%. The model that
performed the best was multiple linear regression,
primarily because it is both transferable and simple
(Hobson et al., 2019). In continuity of this work, the
research conducted by Kumari et al. employs a two-
layer approach utilising a range of sensors (including
PIR motion detectors, CO2 sensors, plug loads, light-
ing loads, electricity use, and Wi-Fi access points)
and machine learning models, specifically the Light
Gradient Boosting Machine (Light GBM), to attain a
99% accuracy and F1-score in forecasting indoor oc-
cupancy (Kumari et al., 2024).
One of the widely used sensors for occupancy in-
formation is the PIR sensor, due to its affordability
and unobtrusive nature, requiring no pre-existing in-
frastructure. PIR sensors are primarily used for mo-
tion detection and are often combined with other sen-
sors in sensor fusion systems to provide data for dif-
ferent levels of occupancy information. There are two
types of PIR sensors based on their output: signal-
based and binary-based PIR sensors. Binary PIR sen-
sors detect the presence or absence of motion through
the use of a straightforward on/off signal. These de-
vices are inexpensive, simple to implement, and re-
duce power consumption, making them appropriate
for simple motion detection and cost-sensitive appli-
cations. Nevertheless, their capacity to provide com-
prehensive motion data is limited. Signal-based PIR
sensors, conversely, generate an analogue signal that
fluctuates in response to infrared intensity. This en-
ables them to offer comprehensive data pertaining to
the sizes, speed, and direction of objects in motion.
The ongoing signal processing of these sensors results
in increased power consumption, complicated con-
figuration, and setup requirements. Although signal-
based sensors have a greater power consumption and
higher cost, they are well-suited for applications that
demand careful and precise motion analysis (Shokrol-
lahi et al., 2024; Yun et al., 2023; Ngamakeur et al.,
2023; Umutoni et al., 2023). Several research papers
have used signal-based PIR sensors to count individ-
uals using various approaches. Zhang et al. presented
number intervals for counting with a single PIR sen-
sor and achieved 85% accuracy for adjacent intervals.
They classified the number of occupants into intervals
as follows: (0), (1–2), (3–4), (5–6), (7–9), (10–12),
(13–15), (16–18), (19–22), up to (87–96), effectively
categorizing large groups (Zhang et al., 2023). Tsou
et al. used a PIR sensor array and CNNs to achieve
92.75% accuracy (Tsou et al., 2020). Yang et al.
obtained 99.5% accuracy with four sensors in room
corners using a neural network (Yang et al., 2020).
Raykov et al. employed a single sensor and infinite
hidden Markov models (iHMM) to achieve 99% ac-
curacy (Raykov et al., 2016). For people counting us-
ing binary-based PIR sensors, Wahl et al. employed
pairs of PIR sensors placed strategically to count in-
dividuals. Inward-facing PIR sensors detect people
entering a room, while outward-facing PIR sensors
detect people leaving, providing for exact movement
monitoring across the company. These sensors were
placed across an office floor to establish a dispersed
network, assuring complete coverage while reduc-
ing installation and maintenance expenses using solar
power (Wahl et al., 2012). Binary PIR sensors have
been widely utilized for people counting due to their
simplicity and cost-effectiveness. Hitiyise et al. in-
troduced a method using two binary PIR sensors at
entrance areas, with counts increasing when the outer
sensor is activated first and decreasing when the in-
ner sensor is triggered first, achieving improved accu-
ICAART 2025 - 17th International Conference on Agents and Artificial Intelligence
396

racy without machine learning (Hitiyise et al., 2016).
Similarly, Udrea et al. developed a system using two
sensors to detect motion within a limited time frame,
though it faced challenges in distinguishing between
simultaneous movements (Udrea et al., 2022). A real-
life experiment was done by Masciadri et al. in an
apartment with eight PIR sensors and a contact sensor.
They used a directed acyclic graph (DAG) to track
movements and estimate occupancy with 86.78% ac-
curacy for up to six people (Masciadri et al., 2022).
Additionally, Wang et al. introduced a linear Gaus-
sian dynamic model to convert raw sensor data into
structured vectors, enhancing the accuracy of predic-
tions in multi-resident tracking with about 80% ac-
curacy in the TM004 dataset. These methods high-
light the effectiveness of binary PIR sensors in vari-
ous occupancy detection and people counting scenar-
ios (Wang and Cook, 2020).
Most previous work has utilized PIR sensors pri-
marily for motion detection purposes, such as turn-
ing lights on and off, and these sensors are now com-
monly available for lighting control and occupancy
detection in most modern buildings. Regarding the
use of PIR sensors for people counting, the common
approach has been to incorporate them as part of sen-
sor fusion systems or employ signal-based PIR sen-
sors. However, while binary-based PIR sensors are
known for their simplicity and cost-effectiveness in
people counting, none of the existing studies have uti-
lized motion counting for people counting within a
room. Only one prior study has employed machine
learning for people counting based on binary PIR sen-
sors. This study highlighted the potential of using ad-
vanced machine learning algorithms to enhance accu-
racy by analyzing motion events detected inside the
room and extracting new features. In earlier research,
binary PIR sensors were mainly deployed in pairs at
doorways to detect entry and exit movements, trig-
gering based on whether individuals were entering or
leaving (Hitiyise et al., 2016). This method, how-
ever, has a notable limitation: if multiple people enter
the room simultaneously, the sensors may only trig-
ger once, counting all individuals as a single entry.
Additionally, there is no sensor inside the room to ac-
count for individuals after they have entered, leading
to further inaccuracies in people counting. To address
these issues, our approach uses one PIR sensor at the
entrance and another for counting motion within the
room and using advanced machine learning.
This research is based on Sony Nimway system,
which is designed to optimize office space usage and
enhance workplace efficiency through advanced sen-
sor technology and data analysis. Based on that, we
introduce a novel approach by using one PIR sensor at
the entrance and another for counting motion within
the room. This approach not only improves the ac-
curacy of detection but also offers several advantages
over previous binary PIR sensor methods for people
counting by using machine learning. Our method re-
duces overall hardware costs and simplifies the instal-
lation process by requiring fewer sensors. By lever-
aging machine learning techniques and extracting dif-
ferent features based on sensor data, room layout, and
time-based patterns, we enhance the accuracy of peo-
ple counting. This approach enables us to count mul-
tiple individuals in a room, addressing the limitations
of previous methods that could miscount group en-
tries as a single event. Furthermore, this approach
can be adapted to different room sizes and configu-
rations without the need for multiple entry/exit sen-
sors, making it more scalable and flexible for vari-
ous smart building applications. Improved accuracy,
enhanced privacy protection, and reduced hardware
requirements lead to better system performance and
increased user satisfaction in smart building environ-
ments. Our approach ensures a more efficient, secure,
and user-friendly solution that meets the needs of both
building managers and occupants. Additionally, This
method improves the reliability of people counting
compared to traditional binary sensor methods. While
our approach may not always provide exact counts, it
offers better overall accuracy and flexibility for vari-
ous smart building applications.
3 METHODOLOGY
Based on the Sony Nimway system (Corporation,
2024), this study utilized data from this smart office
solution to optimize office space usage and enhance
workplace efficiency. The Nimway system’s fea-
tures—room booking, way finding, occupancy moni-
toring, and desk management—aid in effective office
space management. It provides real-time insights into
occupancy and utilization, reducing unused space,
improving productivity, and enhancing workplace sat-
isfaction, making it a valuable tool for smart building
management.
In this study, based on Nimway data collected
from seven rooms within a building over three years,
each room was equipped with two PIR sensors: a PIR
motion sensor inside the room and a PIR passage sen-
sor at the entrance. The passage sensor at the entrance
detects movement through the doorway without the
ability to detect the direction of the movement, while
the motion sensor inside the room monitors activity
within the room. Each sensor has distinct fields of
view, as depicted in Figure 1.
Non-Invasive People Counting in Smart Buildings: Employing Machine Learning with Binary PIR Sensors
397

Figure 1: Motion Sensor and Passage Sensor.
The motion sensor is designed to cover an entire
room or a specific section of it. For optimal perfor-
mance, the motion sensor is mounted at an angle and
a height of 2.5 meters, allowing it to cover a room up
to 4 x 6 meters. To prevent detection of movement
outside the door, the sensor is positioned on the same
wall as the door, ideally placed as close to the center
of the wall as possible. In contrast, the passage sensor
is also mounted at a height of 2.5 meters and covers a
door or passage up to 2 meters wide. It is positioned
to look directly down above the door to ensure accu-
rate detection. Figure 2 shows the side and top views
of each sensor.
Figure 2: Side and top views of the motion sensor.
The primary objective of our study is to count the
number of people between each passage sensor event
to provide a more accurate and reliable estimate of
room occupancy, as illustrated in Figure 3. In this
figure, each ”P” represents a passage sensor event,
and each ”M” represents a motion sensor event. The
number of people (GT) corresponds to the number of
individuals between each passage sensor event, ver-
ified using a camera. Our approach involves using
both non-invasive passage and motion sensors to send
event data to a gateway at specific time periods. If
there is an event during these periods, the sensors
transmit the data; otherwise, they wait for the next
time period. Due to this difference in timing, the in-
tervals between events detected by passage and mo-
tion sensors vary. Additionally, it is likely that more
events will be recorded during these time periods for
both passage and motion sensors. The gateway col-
lects and aggregates the data from both sensors and
then sends it to the cloud for further processing, lever-
aging the cloud-based nature of the Sony Nimway
system. Moreover, regarding occupancy status, if the
sensor inside the room detects movement, it indicates
that someone is there, and we consider the room oc-
cupied. Conversely, if the sensor at the entrance de-
tects movement but the sensor inside does not, it sug-
gests that the person has left the room and the room is
unoccupied, which is extracted based on sensor data.
Using both sensors together helps accurately detect if
the room is occupied or not.
Based on Figure 3, we extracted various features
from the sensor datasets. ”Duration” represents the
time between each passage sensor event, and ”Event
Count” is the total number of motion events recorded
between each passage sensor. ”Density” is calculated
as the duration divided by the event count. The ”Max
Motions Time” indicates the maximum time differ-
ence between each motion sensor event received by
the gateway (not the time between individual motion
events). Additionally, we count the number of pas-
sage events that occur before and after each duration
until the room becomes unoccupied, referred to as
”Passage Event Before” and ”Passage Event After,”
respectively. Moreover, as shown in Figure 4, we uti-
lized map data to extract features for different rooms,
such as length, width, and floor area. Another feature
is the room size, which indicates the number of seats
inside the room. Additionally, we extract time-based
features, such as ”Weekday” (e.g., day of the week
like Saturday) and ”Category” (e.g., non-official time,
official time, and lunch time).
After data collection, our data preprocessing
pipeline involved several critical steps to prepare the
data for modeling. After feature extraction, the data
undergoes encoding and scaling to standardize it for
the machine learning models. To address the problem
of imbalanced data, as illustrated in Figure 5, which
relates to the frequency of people counting, we cre-
ated different target levels based on threshold mov-
ing, as shown in Table 1. By using threshold moving,
we not only solve the problem of imbalanced data but
also create different levels for people counting. This
approach helps to balance the data and categorizes oc-
cupancy into various levels, thereby improving the
accuracy of people counting. The prepared data is
then split either randomly (80% training, 20% test-
ing) or based on room configurations to create training
and testing datasets. Various validation techniques,
such as hand-out, k-fold, and stratified sampling, are
employed to ensure reliable model evaluation. The
model training process involved comprehensive hy-
perparameter optimization using grid search for mod-
els such as Gradient Boosting, MLP, and XGBoost.
Key parameters, including learning rates, maximum
depths, and feature importance, were fine-tuned to en-
hance model performance. Once trained, the model is
evaluated for its accuracy and reliability in counting
the number of people.
ICAART 2025 - 17th International Conference on Agents and Artificial Intelligence
398
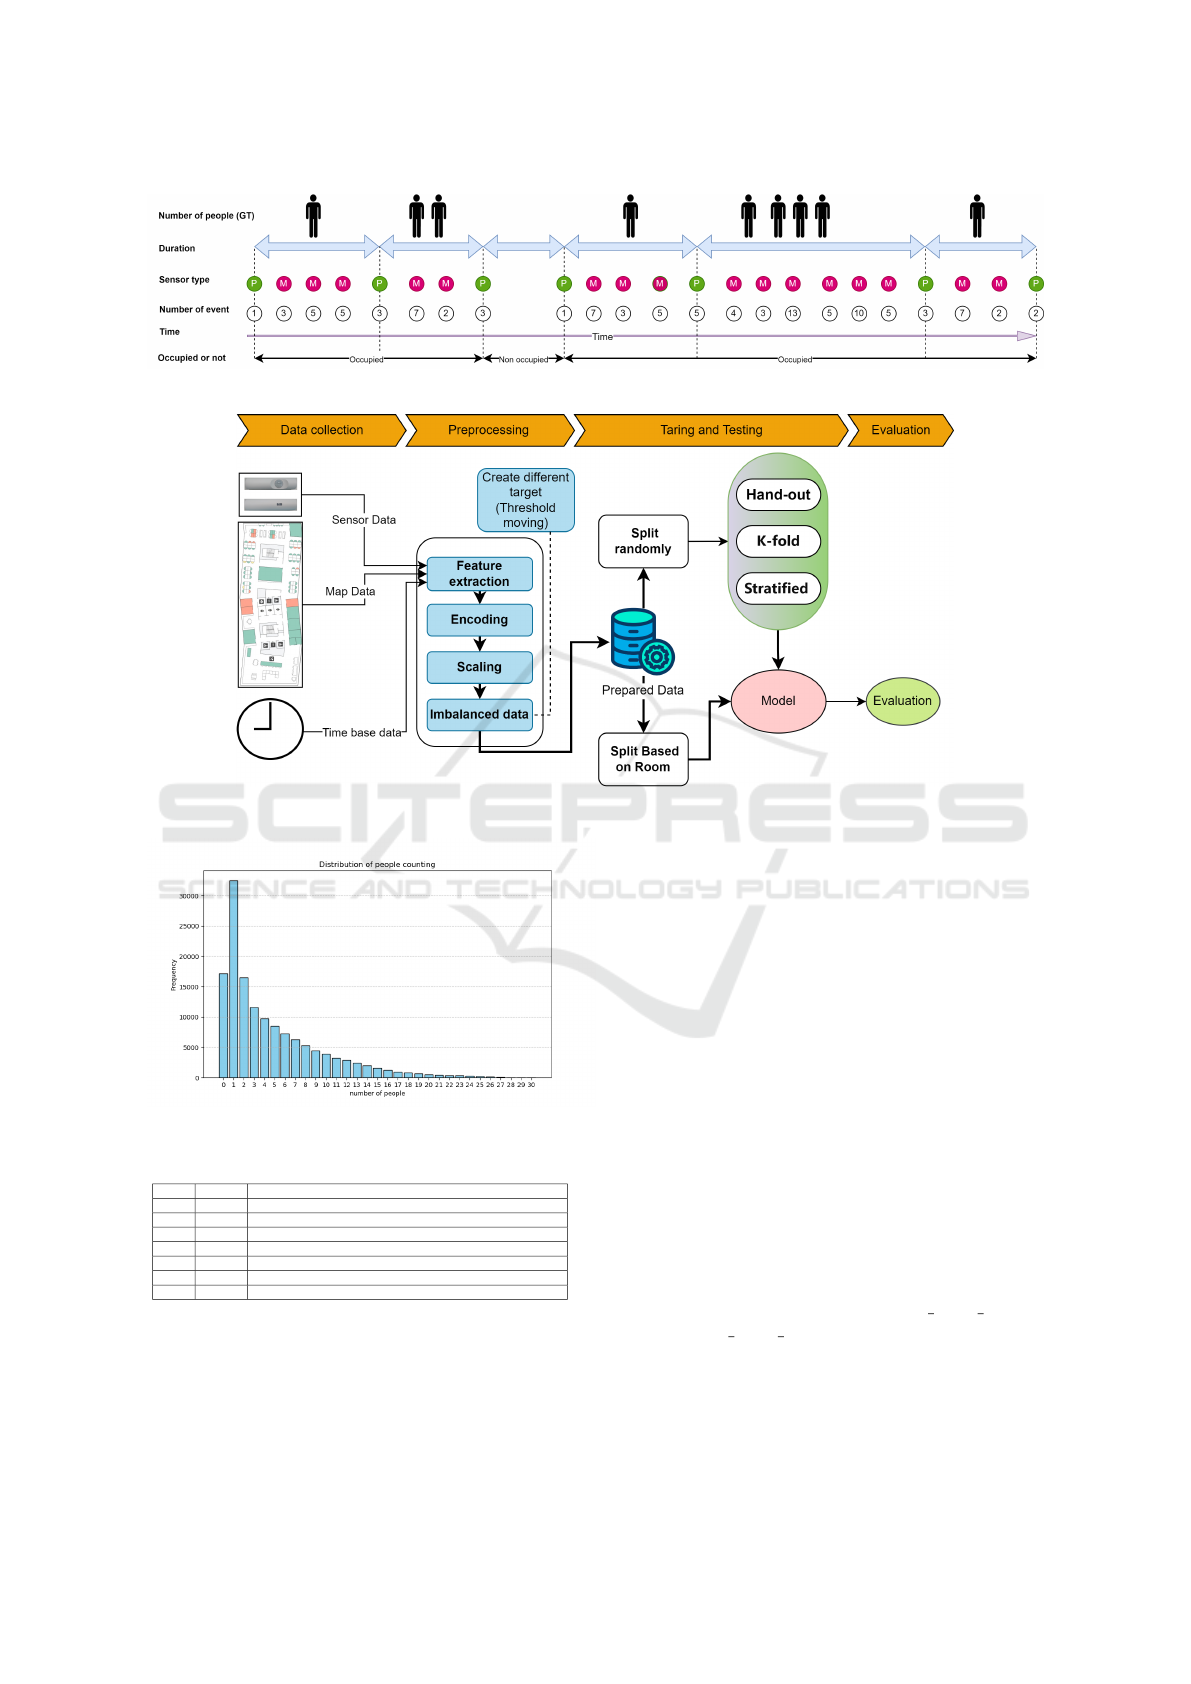
Figure 3: People counting structure.
Figure 4: Preprocessing, training, testing, and evaluation in machine learning.
Figure 5: Frequency of people counting.
Table 1: Classification Levels and Corresponding Thresh-
olds.
Level Classes Thresholds
1 12 (0), (1), ..., (10), (11 or higher)
2 7 (0), (1, 2), (3, 4), (5, 6), (7, 8), (9, 10), (11 or higher)
3 7 (0), (1, 2), (3 to 5), (6 to 8), (9 to 15), (16 to 20), (20 or higher)
4 6 (0), (1, 2), (3 to 5), (6 to 8), (9 to 12), (13 or higher)
5 5 (0), (1 to 3), (4 to 6), (7 to 10), (11 or higher)
6 5 (0), (1), (3 to 5), (6 to 10), (10 or higher)
7 4 (0), (1 to 4), (5 to 10), (11 or higher)
By employing these levels, we improve the robust-
ness and accuracy of our occupancy detection model,
making it ideal for smart building applications. This
approach helps optimize space usage, enhance energy
efficiency, and improve occupant comfort, aligning
with the goals of the Nimway system.
4 RESULTS
In this section, we first present the results of an anal-
ysis of feature correlations to understand their rela-
tionships and significance. Following this, we evalu-
ate the performance of various algorithms by examin-
ing their Accuracy and F1 scores. We also compare
the accuracy results using k-fold and stratified k-fold
cross-validation techniques. Finally, we discuss the
importance of certain features as determined by the
algorithms
In the previous section, we extracted various fea-
tures based on sensor data, map data, and time-based
data. Using these extracted features and considering
the different levels of people counting, we created a
correlation heatmap, as shown in Figure 6. The cor-
relation heatmap reveals the linear relationships be-
tween various features used in predicting occupancy
levels, indicating their importance for level predic-
tion. Key features such as ”passage event before”
and ”passage event after” show strong correlations
with the exact count (0.47 and 0.41, respectively),
indicating their critical role in capturing the dy-
namics of entry and exit events. Spatial features
like ”area” (0.3), ”size” (0.31), and ”length” (0.3)
Non-Invasive People Counting in Smart Buildings: Employing Machine Learning with Binary PIR Sensors
399

are moderately correlated with the exact count, of-
fering insights into the room’s capacity and po-
tential occupancy limits. Although ”event count”
has a lower correlation (0.16), it still contributes
valuable information about motion frequency within
the space.”max motions time” and ”density” exhibit
lower correlations with the exact count (-0.056 and -
0.041, respectively), suggesting they capture unique
aspects of occupancy not covered by the more sig-
nificant features. ”Duration” has a very weak corre-
lation with the exact count (0.011), suggesting that
while it provides temporal context, it may not be a
strong predictor on its own. Other features, such as
”category” and ”weekday,” show negligible correla-
tions with the exact count (-0.051 and 0.042, respec-
tively), indicating they have minimal impact on pre-
dicting occupancy levels. Overall, the heatmap pro-
vides a visual representation of how different features
relate to each other and to each level of people count-
ing, helping to identify the most significant predictors
for occupancy levels.
In our study, we implemented 15 different ma-
chine learning algorithms to analyze 7 levels of oc-
cupancy counting with different people counting in-
tervals. The data was split using different strate-
gies: first, by considering one room as the test dataset
and another as the training dataset; second, by ran-
dom splitting (80% training, 20% testing); and third,
by using k-fold and stratified k-fold cross-validation
techniques. The results obtained from these differ-
ent strategies were closely comparable. Therefore,
we focused on presenting the results based on the
random splitting approach, as shown in the Table
2. The algorithms evaluated include SVM, Logistic
Regression, Ridge Regression, K-Nearest Neighbors
(KNN), Gradient Boosting (GB), AdaBoost, Bag-
ging, Extra Trees Classifier, Decision Tree, Random
Forest, Naive Bayes, LightGBM (LGBM), CatBoost,
XGBoost, and Multi-Layer Perceptron (MLP). These
models were assessed for their accuracy and F1 macro
scores across different levels of occupancy counting.
Based on the detailed results presented in Table 2,
Gradient Boosting (GB) and XGBoost consistently
demonstrate superior performance across various lev-
els of occupancy counting. XGBoost, in particular,
achieved a high accuracy of 0.753 and a strong F1
score of 0.367 on Level 3, while GB showed similar
high accuracy (0.752) and a higher F1 score (0.493)
on the same level, indicating their robustness in both
correct predictions and balancing precision and re-
call. LightGBM (LGBM) and CatBoost also stand
out, especially in higher levels, with LGBM reach-
ing an accuracy of 0.748 and an F1 score of 0.363
on Level 3, and CatBoost achieving an accuracy of
0.75 and an F1 score of 0.484. This showcases their
efficiency in handling complex classifications effec-
tively. Random Forest also shows solid performance,
particularly with high accuracy (0.746) and a good F1
score (0.523) on Level 7, reflecting its reliability in
making accurate predictions while maintaining a bal-
ance between precision and recall. In contrast, mod-
els like K-Nearest Neighbors (KNN) perform moder-
ately well, particularly on Level 7, with an accuracy
of 0.705 and an F1 score of 0.593, indicating reason-
able but not top-tier performance. Bagging and Extra
Trees also provide moderate results, with Extra Trees
achieving an accuracy of 0.746 and an F1 score of
0.405 on Level 3. AdaBoost shows variability in per-
formance, performing better on some levels but gener-
ally lagging behind the top models. Conversely, Naive
Bayes consistently underperforms, with notably low
accuracy (0.282) and an F1 score of 0.242 on Level
3, indicating poor model performance overall. Sim-
ilarly, Ridge Regression shows lower effectiveness,
especially on Level 6, with an accuracy of 0.284
and an F1 score of 0.203. Support Vector Machine
(SVM) and Logistic Regression (LR) exhibit mixed
results, with some moderate performances but gener-
ally lower compared to other models. For instance,
SVM achieves an accuracy of 0.685 and an F1 score
of 0.456 on Level 7, and Logistic Regression shows
moderate performance but less effectiveness in han-
dling complex and detailed occupancy data. Multi-
Layer Perceptron (MLP) also demonstrates competi-
tive performance, achieving strong results particularly
at higher granularity levels, such as an accuracy of
0.744 and an F1 score of 0.501 on Level 3, and an ac-
curacy of 0.533 and an F1 score of 0.493 on Level 6.
MLP’s neural network architecture allows it to cap-
ture intricate patterns in the data, making it suitable
for applications requiring high precision and reliabil-
ity.
Overall, the superior performance of XGBoost,
Gradient Boosting, LightGBM, CatBoost, and MLP
highlights their capability in handling detailed and
high-accuracy occupancy counting tasks. Random
Forest remains a strong contender, particularly for ap-
plications requiring a balance of accuracy and model
interpretability. In contrast, simpler models like
KNN, Bagging, and Extra Trees provide moderate
performance, suitable for less complex applications.
Naive Bayes and Ridge Regression, along with Lo-
gistic Regression, generally underperform, especially
for more detailed and complex occupancy counting
levels. SVM, while showing better performance than
some simpler models, still lags behind the top per-
formers, indicating its limitations in handling the
most detailed classifications. The table suggests that
ICAART 2025 - 17th International Conference on Agents and Artificial Intelligence
400
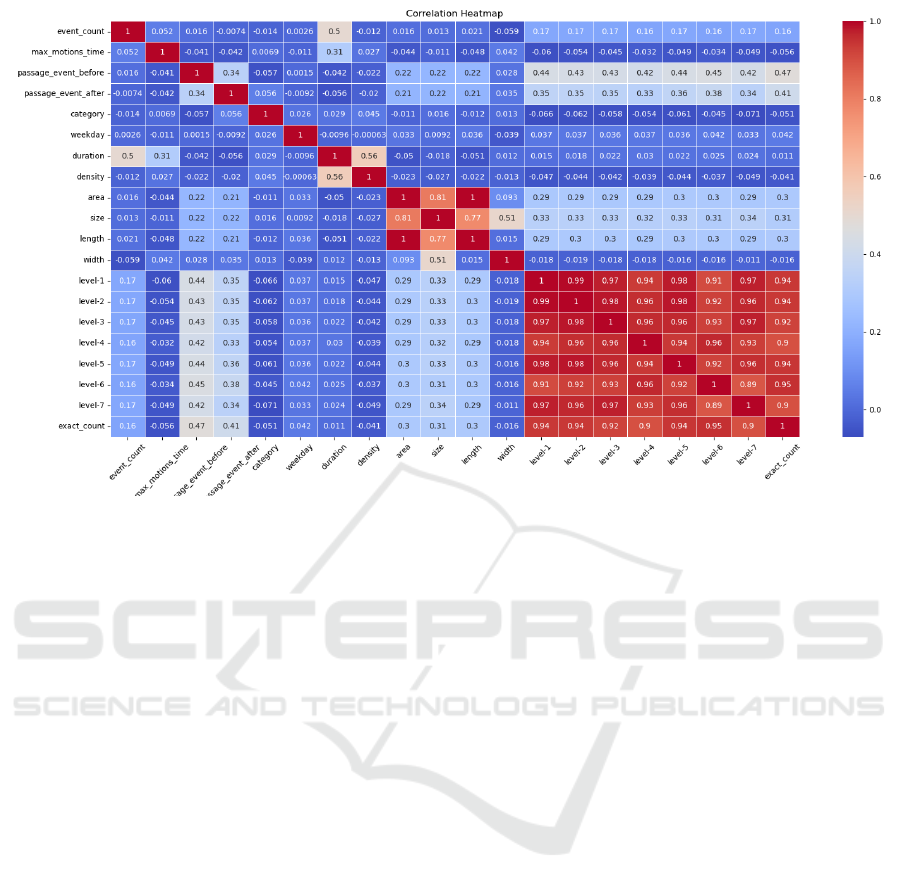
Figure 6: Feature Correlation Heatmap for different Occupancy Levels.
the choice of model and level significantly impacts the
prediction accuracy and balance between precision
and recall, making it crucial to select the right model
and level for predicting occupancy levels in smart
buildings. Additionally, the choice of machine learn-
ing algorithm for people counting in smart buildings
should consider trade-offs between accuracy, com-
plexity, resource requirements, and the specific needs
of the application. High-accuracy models like Gra-
dient Boosting, XGBoost, LightGBM, CatBoost, and
MLP are ideal for detailed tasks but require more
computational resources. SVM offers high accuracy
with minimal scaling needs but is resource-intensive.
KNN requires significant computational resources for
large datasets. Random Forest and Deep Learning
models excel in accuracy and resilience but need sub-
stantial data and computational power. Simpler mod-
els like Naive Bayes and Ridge Regression are suit-
able for less complex scenarios where quick deploy-
ment and interpretability are prioritized. In addi-
tion, the performance across different levels reveals
that levels with fewer classes, such as Level 7, gen-
erally see better accuracy and F1 scores. Level 7,
which has the fewest classes (4), and Level 3, with
7 classes, achieve better and similar accuracy across
most models, indicating their effectiveness for occu-
pancy counting tasks. Level 7 benefits from broader
intervals that capture fewer classes, leading to higher
accuracy, while Level 3 also performs well with its
specific interval distribution. Following these, Level
5, with 5 classes, balances detail and simplicity ef-
fectively, making it suitable for moderately detailed
occupancy counting. Level 4, with 6 classes, pro-
vides detailed counting without being overly com-
plex. Level 2, despite having 7 classes, shows reason-
able accuracy but loses effectiveness as the intervals
become broader. Finally, Level 6, designed to han-
dle imbalanced data with 5 classes, tends to perform
less effectively due to its simplified classification and
broader intervals.
The choice of intervals is crucial in people count-
ing, as shown by the distribution of people counts in
Figure 5. The frequency distribution shows a high
number of lower counts (0-3 people), which decreases
as the number of people increases. This pattern high-
lights the importance of selecting appropriate inter-
vals for each level so that the models can effectively
distinguish between different occupancy levels. Well-
chosen intervals, like those in Levels 7, 3, and 5, cap-
ture detailed occupancy patterns more accurately, re-
sulting in higher precision. On the other hand, poorly
chosen intervals, such as those in Level 6, simplify the
task but may miss finer distinctions, affecting overall
performance. Levels 4 and 2 offer a balance, provid-
ing reasonable accuracy without being overly com-
plex. This supports the observation that the distribu-
tion of people counts can impact results if not appro-
priately managed by choosing the right intervals and
number of classes. Moreover, the choice of intervals
may depend on the specific application, such as secu-
rity systems, energy management, and space alloca-
tion systems like Nimway. For security systems, finer
Non-Invasive People Counting in Smart Buildings: Employing Machine Learning with Binary PIR Sensors
401

Table 2: Comparison of Accuracy and F1 Macro Scores for Various Models.
Model Level1 Level2 Level3 Level4 Level5 Level6 Level7
Acc F1 Acc F1 Acc F1 Acc F1 Acc F1 Acc F1 Acc F1
SVM 0.285 0.107 0.474 0.180 0.684 0.289 0.526 0.299 0.597 0.306 0.395 0.329 0.685 0.456
LR 0.322 0.127 0.431 0.144 0.653 0.259 0.488 0.245 0.552 0.248 0.414 0.343 0.650 0.362
Ridge 0.280 0.062 0.467 0.110 0.691 0.243 0.467 0.233 0.598 0.225 0.284 0.203 0.685 0.310
KNN 0.349 0.207 0.510 0.356 0.701 0.427 0.554 0.440 0.616 0.488 0.461 0.427 0.705 0.593
GB 0.381 0.234 0.558 0.406 0.752 0.493 0.609 0.464 0.664 0.520 0.523 0.503 0.748 0.592
AdaBoost 0.332 0.157 0.478 0.279 0.461 0.343 0.549 0.371 0.628 0.418 0.498 0.409 0.706 0.530
Bagging 0.354 0.209 0.512 0.329 0.717 0.401 0.560 0.343 0.623 0.429 0.474 0.401 0.717 0.540
Extra Trees 0.365 0.196 0.534 0.306 0.746 0.405 0.584 0.378 0.654 0.426 0.496 0.405 0.744 0.514
Decision Tree 0.309 0.179 0.451 0.330 0.654 0.343 0.499 0.333 0.564 0.330 0.430 0.367 0.654 0.303
Random Forest 0.379 0.219 0.545 0.341 0.746 0.350 0.596 0.411 0.654 0.451 0.511 0.428 0.746 0.523
Naive Bayes 0.187 0.111 0.213 0.176 0.282 0.242 0.236 0.243 0.247 0.282 0.228 0.242 0.287 0.325
LGBM 0.382 0.215 0.554 0.537 0.748 0.363 0.611 0.474 0.660 0.537 0.521 0.363 0.750 0.537
CatBoost 0.395 0.258 0.565 0.425 0.750 0.484 0.619 0.462 0.665 0.522 0.527 0.484 0.753 0.612
XGBoost 0.386 0.226 0.558 0.364 0.753 0.367 0.613 0.421 0.661 0.500 0.517 0.367 0.756 0.612
MLP 0.398 0.235 0.563 0.394 0.744 0.501 0.618 0.504 0.672 0.611 0.533 0.493 0.730 0.624
intervals with more classes may be necessary to accu-
rately monitor and respond to changes in occupancy.
In contrast, energy management systems may benefit
from broader intervals that simplify classification and
focus on larger occupancy trends to optimize HVAC
systems, leading to significant cost savings. Regard-
ing space allocation systems like Nimway, an accu-
racy level of around 70-75% for people counting is
sufficient for ensuring efficient room utilization and
reducing the cost of unused spaces. This accuracy
aids in better planning and enhances workplace pro-
ductivity and satisfaction. By emphasizing the practi-
cality and applicability of these models in real-world
scenarios, our study demonstrates that even moderate
accuracy levels can yield significant benefits in smart
building management, validating the effectiveness of
machine learning models in this domain.
To ensure robust evaluation of our models, we
employed K-Fold, Stratified K-Fold cross-validation
methods, and random splitting (handout) for divid-
ing the test and train data. The results, shown in Ta-
ble 3 for Level 7, indicate that K-Fold and Stratified
K-Fold yield very similar performance metrics, with
nearly identical accuracy and F1 Macro scores. This
suggests that the data distribution is balanced and the
models are robust. Additionally, the handout method
results, as shown in Table 2, are close to those from K-
Fold and Stratified K-Fold cross-validation, confirm-
ing that all three methods provide comparable and re-
liable estimates of model performance.
Regarding feature importance, as shown in Fig-
ure 7 we have chosen five algorithms that perform
better. The feature importance scores for these mod-
els, including Gradient Boosting, AdaBoost, Ex-
tra Trees Classifier, Decision Tree, Random Forest,
and XGBoost Classifier, indicate the significance of
each feature in predicting occupancy levels. ”pas-
sage event before” is the most critical feature for all
of them, highlighting its crucial role in determin-
ing the number of people based on previous pas-
sage events. ”event count” is also notably important
across models, especially in XGBoost. Other sig-
nificant features include ”duration,” which measures
the time between events and shows high importance
in Extra Trees and Decision Tree models, and ”den-
sity,” reflecting the event concentration, which is im-
portant in Random Forest and Decision Tree models.
Lesser but still relevant features like ”area,” ”size,”
and ”length” provide spatial context with varying im-
portance across models. Overall, temporal and event-
based features are paramount for accurate occupancy
predictions, while spatial and categorical features also
contribute to the models’ predictive power. These
insights guide the refinement of models by focusing
on the most impactful features, ensuring improved
performance in smart building management applica-
tions.It’s important to note that a feature’s low impor-
tance in the correlation heatmap but high importance
in the feature importance plot, such as ”event count,”
indicates that the feature contributes to complex, non-
linear relationships or interactions with other features
that the model uses to improve its predictions.
Comparing this work with previous research in
smart building people counting reveals significant ad-
vancements. Historically, many studies have relied
on sensor fusion, often raising privacy concerns due
to their invasive nature.In contrast, our approach uti-
lizes only two non-invasive, simple binary PIR sen-
sors: a passage sensor located at the entrance and
a motion sensor inside the room, both of which are
PIR sensors with different fields of view. Unlike pre-
vious efforts that used two passage binary PIR sen-
sors outside and inside the room, triggering when
someone goes outside and decreasing the count, this
work integrates both passage and motion sensors to
count multiple people inside the room. Additionally,
we enhance the system’s capabilities by introducing
multiple levels of occupancy counting and employing
advanced machine learning algorithms like Gradient
Boosting, XGBoost, and LightGBM, which have not
ICAART 2025 - 17th International Conference on Agents and Artificial Intelligence
402
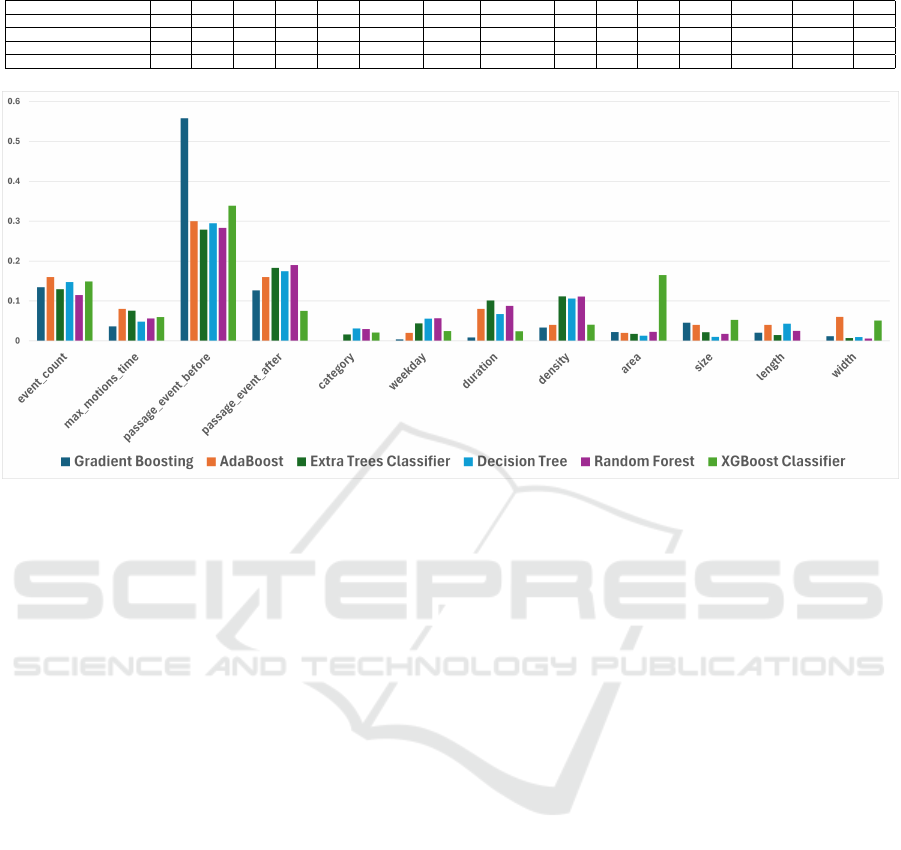
Table 3: Comparison of Accuracy and F1 Macro K-Fold and Stratified K-Fold Cross-Validation Methods.
Metric / Model SVM LR RC KNN GB AdaBoost Bagging Extra Trees DT RF NB LGBM CatBoost XGBoost MLP
Accuracy (KFold) 0.657 0.615 0.546 0.717 0.719 0.657 0.699 0.731 0.644 0.722 0.296 0.734 0.739 0.734 0.719
Accuracy (StratifiedKFold) 0.659 0.615 0.546 0.718 0.719 0.655 0.700 0.731 0.642 0.720 0.295 0.733 0.738 0.734 0.720
F1 Macro (KFold) 0.548 0.526 0.312 0.686 0.683 0.625 0.662 0.698 0.612 0.687 0.289 0.702 0.708 0.702 0.684
F1 Macro (StratifiedKFold) 0.554 0.526 0.312 0.686 0.683 0.626 0.663 0.698 0.609 0.686 0.289 0.702 0.707 0.702 0.682
Figure 7: Features important.
been widely used in prior studies. This innovative
combination not only respects user privacy but also
boosts the accuracy and adaptability of the occupancy
detection system, offering a more comprehensive so-
lution to smart building management.
5 CONCLUSION
This study presented a novel approach to people
counting in smart buildings, utilizing a minimal
setup of binary passive infrared sensors integrated
with advanced machine learning techniques. Our
method, focused on two strategically placed sensors
per room, overcomes traditional challenges associ-
ated with complex installations and high hardware
costs. By analyzing data collected over three years
from seven different office rooms, we demonstrated
that even simple binary PIR sensors, when coupled
with sophisticated machine learning algorithms like
Gradient Boosting, XGBoost, and LightGBM, can
yield accurate and reliable occupancy estimations.
The machine learning models employed successfully
interpreted the sensor data to predict the number of
people with acceptable accuracy. Our results con-
firmed that fewer sensors can still provide reliable oc-
cupancy data, provided that the data is processed with
effective machine learning strategies. The feature im-
portance analysis highlighted the significant roles of
passage events and motion detection patterns in en-
hancing the accuracy of people counting. Moreover,
by categorizing occupancy into multiple levels, we
further improved the accuracy and robustness of our
models, making them well-suited for various appli-
cations in smart building management. Furthermore,
our approach emphasizes scalability, flexibility, and
privacy, making it adaptable to various room config-
urations and sizes. This adaptability, along with the
reduced cost and installation simplicity, makes our
method a practical solution for real-world applica-
tions in smart building management. Future research
explores several promising directions. Integrating
non-invasive sensors, such as CO2 or sound sensors,
with booking data offers an opportunity to enhance
people counting accuracy by combining real-time en-
vironmental insights with contextual usage patterns.
Employing real-time data processing techniques en-
ables dynamic adaptation to changing environments
and user behaviors, while large-scale validation stud-
ies across diverse building types ensure broader ap-
plicability and reliability. Additionally, hybrid ap-
proaches that combine binary PIR sensors with low-
resolution vision-based systems balance privacy, cost,
and accuracy. By addressing these directions, future
work advances the capabilities of smart building tech-
nologies, delivering enhanced energy efficiency, opti-
mized space utilization, and improved occupant com-
fort.
Non-Invasive People Counting in Smart Buildings: Employing Machine Learning with Binary PIR Sensors
403

ACKNOWLEDGEMENTS
This work is supported by the Knowledge Founda-
tion (Stiftelsen f
¨
or kunskaps- och kompetensutveck-
ling) for the project titled Intelligent and Trustworthy
IoT Systems under Grant No. 20220087-H-01.
REFERENCES
Alhawsawi, A. N., Khan, S. D., and Ur Rehman, F. (2024).
Crowd counting in diverse environments using a deep
routing mechanism informed by crowd density levels.
Information, 15(5):275.
Alishahi, N., Ouf, M. M., and Nik-Bakht, M. (2022). Us-
ing wifi connection counts and camera-based occu-
pancy counts to estimate and predict building occu-
pancy. Energy and Buildings, 257:111759.
Alsafery, W., Rana, O., and Perera, C. (2023). Sensing
within smart buildings: A survey. ACM Computing
Surveys, 55(13s):1–35.
Amayri, M., Arora, A., Ploix, S., Bandhyopadyay, S., Ngo,
Q.-D., and Badarla, V. R. (2016). Estimating occu-
pancy in heterogeneous sensor environment. Energy
and Buildings, 129:46–58.
Brazauskas, J., Jensen, C., Danish, M., Lewis, I., and
Mortier, R. (2024). Cerberus: Privacy-preserving
crowd counting and localisation using face detection
in edge devices. In Proceedings of the 7th Interna-
tional Workshop on Edge Systems, Analytics and Net-
working, pages 25–30.
Chaudhari, P., Xiao, Y., Cheng, M. M.-C., and Li, T. (2024).
Fundamentals, algorithms, and technologies of occu-
pancy detection for smart buildings using iot sensors.
Sensors, 24(7):2123.
Corporation, S. (2024). Nimway smart office by sony. Ac-
cessed: 2024-12-30.
Dobrilovic, D., Bogdan, R., Ognjenovic, V., and Marcu, M.
(2023). Analyses on usage of mlp regression with wsn
data for predicting room occupancy. In 2023 IEEE
19th International Conference on Intelligent Com-
puter Communication and Processing (ICCP), pages
131–136. IEEE.
Gao, M., Souri, A., Zaker, M., Zhai, W., Guo, X., and Li, Q.
(2024). A comprehensive analysis for crowd counting
methodologies and algorithms in internet of things.
Cluster Computing, 27(1):859–873.
Hitiyise, E., Ntagwirumugara, E., Habarurema, W.,
Ingabire, W., and Gasore, G. (2016). Building oc-
cupancy monitoring based on microcontroller and pir
sensors. Int. J. Appl. Eng. Res, 11:10414–10419.
Hobson, B. W., Lowcay, D., Gunay, H. B., Ashouri, A., and
Newsham, G. R. (2019). Opportunistic occupancy-
count estimation using sensor fusion: A case study.
Building and environment, 159:106154.
Jamali, M., Davidsson, P., Khoshkangini, R., Ljungqvist,
M. G., and Mihailescu, R.-C. (2024). Specialized in-
door and outdoor scene-specific object detection mod-
els. In Sixteenth International Conference on Machine
Vision (ICMV 2023), volume 13072, pages 201–210.
SPIE.
Jiang, C., Masood, M. K., Soh, Y. C., and Li, H. (2016). In-
door occupancy estimation from carbon dioxide con-
centration. Energy and Buildings, 131:132–141.
Kim, J., Bang, J., Choi, A., Moon, H. J., and Sung, M.
(2023). Estimation of occupancy using iot sensors and
a carbon dioxide-based machine learning model with
ventilation system and differential pressure data. Sen-
sors, 23(2):585.
Kumari, P., Reddy, S., and Yadav, R. (2024). Indoor occu-
pancy detection and counting system based on boost-
ing algorithm using different sensor data. Building
Research & Information, 52(1-2):87–106.
Li, T., Liu, X., Li, G., Wang, X., Ma, J., Xu, C., and Mao,
Q. (2024). A systematic review and comprehensive
analysis of building occupancy prediction. Renewable
and Sustainable Energy Reviews, 193:114284.
Liang, X., Shim, J., Anderton, O., and Song, D. (2024).
Low-cost data-driven estimation of indoor occupancy
based on carbon dioxide (co2) concentration: A multi-
scenario case study. Journal of Building Engineering,
82:108180.
Liu, Z., Guo, Z., Chen, Q., Song, C., Shang, W., Yuan, M.,
and Zhang, H. (2023). A review of data-driven smart
building-integrated photovoltaic systems: Challenges
and objectives. Energy, 263:126082.
Lu, C. (2024). Enhancing real-time nonintrusive occupancy
estimation in buildings via knowledge fusion network.
Energy and Buildings, 303:113812.
Mao, S., Yuan, Y., Li, Y., Wang, Z., Yao, Y., and Kang,
Y. (2023). Room occupancy prediction: Exploring
the power of machine learning and temporal insights.
arXiv preprint arXiv:2312.14426.
Masciadri, A., Lin, C., Comai, S., and Salice, F. (2022).
A multi-resident number estimation method for smart
homes. Sensors, 22(13):4823.
Naser, A., Lotfi, A., and Zhong, J. (2020). Adaptive ther-
mal sensor array placement for human segmentation
and occupancy estimation. IEEE Sensors Journal,
21(2):1993–2002.
Natarajan, K. S., Balu, S., and Mangottiri, V. (2023). Smart
and sustainable infrastructure for future energy and
environmental management. Environmental Science
and Pollution Research, 30(44):98993–98994.
Navarro, R. C., Ruiz, A. R., Molina, F. J. V., Romero, M.
J. S., Chaparro, J. D., Alises, D. V., and Lopez, J. C. L.
(2022). Indoor occupancy estimation for smart utili-
ties: A novel approach based on depth sensors. Build-
ing and Environment, 222:109406.
Ngamakeur, K., Yongchareon, S., Yu, J., and Islam, S.
(2023). Passive infrared sensor dataset and deep
learning models for device-free indoor localization
and tracking. Pervasive and Mobile Computing,
88:101721.
Rajabi, H., Ding, X., Du, W., and Cerpa, A. (2023). To-
dos: Thermal sensor data-driven occupancy estima-
tion system for smart buildings. In Proceedings of
the 10th ACM international conference on systems for
ICAART 2025 - 17th International Conference on Agents and Artificial Intelligence
404

energy-efficient buildings, cities, and transportation,
pages 198–207.
Ramzan, F., Sartori, C., Consoli, S., and Reforgiato Recu-
pero, D. (2024). Generative adversarial networks for
synthetic data generation in finance: Evaluating statis-
tical similarities and quality assessment. AI, 5(2):667–
685.
Raykov, Y. P., Ozer, E., Dasika, G., Boukouvalas, A., and
Little, M. A. (2016). Predicting room occupancy with
a single passive infrared (pir) sensor through behavior
extraction. In Proceedings of the 2016 ACM inter-
national joint conference on pervasive and ubiquitous
computing, pages 1016–1027.
Risuleo, R. S., Molinari, M., Bottegal, G., Hjalmarsson, H.,
and Johansson, K. H. (2015). A benchmark for data-
based office modeling: challenges related to co2 dy-
namics. IFAC-PapersOnLine, 48(28):1256–1261.
Sahoo, S. R. and Lone, H. R. (2023). Occupancy count-
ing in dense and sparse settings with a low-cost ther-
mal camera. In 2023 15th International Conference
on COMmunication Systems & NETworkS (COM-
SNETS), pages 537–544. IEEE.
Shokrollahi, A., Persson, J. A., Malekian, R., Sarkheyli-
H
¨
agele, A., and Karlsson, F. (2024). Passive infrared
sensor-based occupancy monitoring in smart build-
ings: A review of methodologies and machine learn-
ing approaches. Sensors, 24(5):1533.
Tomokazu, T. Cooperative distributed demand control by
environmental sensor network-estimating the number
of people by co2 concentration. In The IEEE Interna-
tional Conference on Industrial Informatics (INDIN
2008).
Tsou, P.-R., Wu, C.-E., Chen, Y.-R., Ho, Y.-T., Chang, J.-
K., and Tsai, H.-P. (2020). Counting people by using
convolutional neural network and a pir array. In 2020
21st IEEE International Conference on Mobile Data
Management (MDM), pages 342–347. IEEE.
Udrea, I., Simion, N. D., Alionte, C. G., Ionut, V., Ghe-
orghe, V. F. K., and Petrache, S. (2022). Counting
versus detection in an fm application that deals with
rooms reservation. Journal of Eastern Europe Re-
search in Business and Economics, Norristown, PA,
USA.
Umutoni, R. M., Ogore, M., Hanyurwimfura, D., and
Nsenga, J. (2023). Integrating analog pir sen-
sor telemetry with tinyml inference for on-the-edge
classification of moving objects. In International
Congress on Information and Communication Tech-
nology, pages 405–415. Springer.
Wahl, F., Milenkovic, M., and Amft, O. (2012). A
distributed pir-based approach for estimating people
count in office environments. In 2012 IEEE 15th
International Conference on Computational Science
and Engineering, pages 640–647. IEEE.
Wang, K., Wang, Y., Ren, R., Zou, H., and Shao, Z. (2023).
Transformer-based feature aggregation and stitching
network for crowd counting. IEEE Access.
Wang, T. and Cook, D. J. (2020). smrt: Multi-resident track-
ing in smart homes with sensor vectorization. IEEE
transactions on pattern analysis and machine intelli-
gence, 43(8):2809–2821.
Wang, W., Chen, J., and Hong, T. (2018). Occupancy pre-
diction through machine learning and data fusion of
environmental sensing and wi-fi sensing in buildings.
Automation in Construction, 94:233–243.
Yang, T., Guo, P., Liu, W., Liu, X., and Hao, T. (2020). En-
hancing pir-based multi-person localization through
combining deep learning with domain knowledge.
IEEE Sensors Journal, 21(4):4874–4886.
Yun, J., Kim, D., Kim, D. M., Song, T., and Woo, J. (2023).
Gan-based sensor data augmentation: Application for
counting moving people and detecting directions us-
ing pir sensors. Engineering Applications of Artificial
Intelligence, 117:105508.
Zhai, W., Gao, M., Guo, X., Zou, G., Li, Q., and Jeon, G.
(2024). Scale attentive aggregation network for crowd
counting and localization in smart city. ACM Trans-
actions on Sensor Networks.
Zhang, X., Zhou, T., Kokogiannakis, G., Xia, L., and Wang,
C. (2023). Estimating the number of occupants and
activity intensity in large spaces with environmental
sensors. Building and Environment, 243:110714.
Zhao, L., Li, Y., Liang, R., and Wang, P. (2022). A state
of art review on methodologies of occupancy esti-
mating in buildings from 2011 to 2021. Electronics,
11(19):3173.
Non-Invasive People Counting in Smart Buildings: Employing Machine Learning with Binary PIR Sensors
405
