
Wearable Sensor Framework for Rehabilitation Monitoring Following
Knee-Related Conditions
Can Tekdemir
1
, Yusuf Ziya Hayirlioglu
1
, Olgar Birsel
2 a
and Beren Semiz
1 b
1
Department of Electrical and Electronics Engineering, College of Engineering, Koc¸ University, Istanbul, Turkey
2
Department of Orthopaedics and Traumatology, School of Medicine, Koc¸ University, Istanbul, Turkey
{ctekdemir21, yhayirlioglu17, olgarbirsel, besemiz}@ku.edu.tr
Keywords:
Knee Health, Acoustical Emissions, Electrical Bioimpedance, Inertial Activity, Rehabilitation Monitoring.
Abstract:
The knee, being the largest and one of the most complex joints in the body, is highly vulnerable to injury due to
its intricate structure and exposure to multi-directional forces. Surgical interventions are among the most fre-
quently utilized treatments for advanced degenerative joint disease. However during the rehabilitation process,
physician assessments can be subjective, which may lead to inconsistent evaluations, particularly in subtle or
complex cases. To enhance accuracy and reduce variability, objective methodologies like data-driven tools and
standardized protocols are necessary. Hence, we propose a multi-modal wearable sensor framework leveraging
electrical bioimpedance, acoustical emissions, inertial activity and temperature measurements simultaneously
to achieve objective and quantifiable information that can complement clinical judgement, ensuring more re-
liable and reproducible outcomes in patient care. The system was validated through active (flexion-extension)
and inactive (sedentary) measurements, and proven successful in capturing knee-related signatures and assess-
ing the knee joint health. Such a system could facilitate the establishment of a direct relationship between
signal characteristics and key knee health parameters, enabling more informed decisions regarding disease or
injury status and treatment progress.
1 INTRODUCTION
The knee is the largest and one of the most com-
plex joints in the human body, making it highly sus-
ceptible to stress from multi-directional forces during
physical activity (Austermuehle, 2001). Its intricate
structure, comprising two distinct joints, accommo-
dates loads from various directions while relying on
both static and dynamic soft tissues to maintain stabil-
ity. This complexity, along with age-related wear and
tear, makes the knee particularly vulnerable to injury
and a leading cause of rehabilitation among muscu-
loskeletal disorders. Globally, an estimated 1.71 bil-
lion people suffer from musculoskeletal conditions,
a number projected to rise with an aging population
(WHO, 2022).
Surgical interventions are one of the most com-
monly used treatment approaches for advanced de-
generative joint disease. Indeed, the number of to-
tal knee arthroplasties performed each year in the
United States alone is estimated to reach 3.5 million
a
https://orcid.org/0000-0002-2137-1164
b
https://orcid.org/0000-0002-7544-5974
in 2040 (Carmichael et al., 2022). Following surgery,
the main goal in the early postoperative period is to
maintain proper healing of the surgical wound. This
process is monitored by simple observation and phys-
ical examination findings. Healing, which begins as
soon as the surgical incision is made, should follow
a decrease in soft tissue edema, redness and temper-
ature, finally leading to restoration of skin integrity
(George Broughton et al., 2006). The second im-
portant point is to restore the range of motion of the
knee joint, which is calculated through angular val-
ues while the physician is passively moving the knee
joint or asking the patient to actively bend the knee.
The physician can then conclude whether the wound
is healing smoothly in the early postoperative period
and the inflammatory process has regressed as ex-
pected – or can make necessary interventions and pro-
vide warnings by identifying disruptions in the natural
course of recovery.
One problem with the physician assessments is
their subjectivity as they often rely on personal ex-
perience, intuition and observation, which can vary
between individuals and lead to inconsistent evalu-
ations, especially in subtle or complex cases. To
Tekdemir, C., Hayirlioglu, Y. Z., Birsel, O. and Semiz, B.
Wearable Sensor Framework for Rehabilitation Monitoring Following Knee-Related Conditions.
DOI: 10.5220/0013144000003911
Paper published under CC license (CC BY-NC-ND 4.0)
In Proceedings of the 18th International Joint Conference on Biomedical Engineering Systems and Technologies (BIOSTEC 2025) - Volume 1, pages 45-52
ISBN: 978-989-758-731-3; ISSN: 2184-4305
Proceedings Copyright © 2025 by SCITEPRESS – Science and Technology Publications, Lda.
45

Figure 1: Most important circuit components.
reduce variability and improve accuracy, objective
methodologies, such as data-driven tools and stan-
dardized protocols, are required. In the literature, sev-
eral attempts have been made to assess knee health
non-invasively which are expected to provide pa-
tients and physicians with more readily available
quantitative data regarding health or treatment sta-
tus. Most of these attempts have focused on the
design of wearable sensing modalities leveraging
the measurement of joint acoustics, edema or activ-
ity range through miniature microphones, electrical
bioimpedance (EBI) systems and inertial measure-
ment units (IMUs), respectively. For example, joint
acoustics (vibrations emitted from the mid-patella
during active movements) have been used to distin-
guish between subjects with osteoarthritis and healthy
subjects (Sarillee et al., 2014), to track treatment
and medication effectiveness in children with arthri-
tis (Semiz et al., 2018) and to monitor rehabilitation
advancements in athletes with an acute injury (Hersek
et al., 2017). On the other hand, several studies have
leveraged the use of EBI in joint edema (swelling)
detection and monitoring (Hersek et al., 2016); and
IMUs for knee joint stability (Kianifar et al., 2017)
and range of motion assessment (Seel et al., 2014).
In this work, we propose a multi-modal sensor
system prototype leveraging electrical bioimpedance,
acoustical emissions, inertial activity and tempera-
ture measurements simultaneously to achieve objec-
tive and quantifiable information that can complement
clinical judgement, ensuring more reliable and repro-
ducible outcomes in patient care. Such a multi-modal
system could potentially facilitate the investigation of
one-to-one correspondence between signal character-
istics and important knee health parameters, enabling
more informed decisions regarding the disease/injury
state or treatment progression.
2 METHODS
2.1 Hardware Setup
In the system, a Raspberry Pi Pico based on RP2040
microcontroller is used as the development kit. The
circuit visuals are provided in Figure 1 and the sen-
sor locations are visualized in Figure 2. The system
has have two modes: an active mode and an inac-
tive (passive) mode. In the active mode, acoustical
emissions and inertial activity measurements are em-
ployed, whereas during inactive mode, the electrical
bioimpedance and temperature values are measured.
Details regarding electrical bioimpedance, tempera-
ture, acoustical emissions and inertial activity are pre-
sented in the upcoming sub-sections.
2.1.1 Electrical Bioimpedance Measurement
System
The bioimpedance system uses an AD9833 signal
generator module to generate a 60 kHz sine wave with
an amplitude and DC offset of 325 mV each. Subse-
quently, this generated signal is fed into a DC off-
set remover and voltage buffer circuit (which uses an
LM358 op-amp) to be turned into a pure AC signal.
The output from the LM358 circuit is then fed into
BIODEVICES 2025 - 18th International Conference on Biomedical Electronics and Devices
46

Figure 2: Sensors included in the system.
Figure 3: Experimental protocol including active and inac-
tive (passive) measurements.
a NE5532 op-amp based VCCS (Voltage Controlled
Current Source) circuit. The VCCS circuit sends out
a constant 2 mA peak-to-peak current from the op-
amp’s output pin to its inverting input pin. The leg
electrodes are connected to these pins to send a con-
stant AC current through the knee joint. Additionally,
the VCCS circuit uses a potentiometer to fine-tune the
magnitude of the AC current.
The voltage across the knee joint is measured with
an NE5532 op-amp based circuit. The circuit con-
sists of a simple inverting summing amplifier (which
uses the NE5532) and a low-pass filter. The top-leg
electrode’s potential acts as the input signal, while the
bottom-leg’s is connected to the ADC ground (which
makes it act as a reference ground for the system).
The circuit adds the input voltage and a voltage source
of -1.5151 volts (which is half of the reference volt-
age of the RP2040’s ADC) together, inverts the signal
(so that it is positively shifted for the ADC), and then
feeds it into an anti-aliasing (low pass) filter, which
then gets connected to one of the ADC pins on the
Pico. It should be noted that the output signal is
not too large to cause any clipping or go beyond the
ADC’s range, which is why this level of DC offset is
perfectly adequate for the Pico’s ADC.
The negative voltage producing circuit consists of
a NE555 precision timer-based square wave gener-
ator that drives a negative charge-pump circuit and
a LM7905 negative voltage regulator. The system
functions by continuously driving a negative charge-
pump circuit at 60.33 kHz. The negative charge-pump
circuit consists of a 680 uH inductor, a 1N914 fast
switching diode, a 680 uF capacitor, and a 2N3906
PNP BJT transistor to act as a switch. At 60.33
kHz, the charge-pump circuit produces a stable -11.5
volts while being able to deliver a current around -
6.8 mA. The output from the charge-pump circuit is
then fed into a LM7905 negative voltage regulator,
which reduces and stabilizes the negative voltage cir-
cuit’s output to -5 volts. The negative voltage produc-
ing circuit’s output is primarily used in powering all
of the op-amps found in the system. It is also used
as a constant offset voltage for the aforementioned
bioimpedance voltage measurement system.
2.1.2 Temperature Measurement System
The temperature measurement circuit is based on a
voltage divider that consists of a thermistor and a re-
sistor. A 10 kOhm negative-thermal-coefficient ther-
mistor (model: TTC05103JSY) is connected in se-
ries with a 10 kOhm resistor. As the thermistor’s
temperature increases, its resistance decreases, which
causes the voltage across the 10 kOhm resistor to in-
crease. The output voltage on the resistor is fed into
a NE5532 op-amp based voltage buffer and the out-
put of the voltage buffer is fed into a low pass fil-
ter with a frequency cutoff of 15.92 Hz. It should be
noted that the temperature on the thermistor changes
very slowly due to thermodynamic physical phenom-
ena and that the DC component of the output signal is
significantly more important than the AC component.
Therefore, the low-pass filter is implemented to func-
tion as a pseudo-AC filter that also blocks off power-
line interference and other unneeded higher frequen-
cies. The NE5532 is used as a buffer to preserve the
voltage so that the voltage divider’s output is not af-
fected due to the low pass filter. The output of the fil-
ter is fed into the Pico’s second ADC pin to calculate
the thermistor’s temperature. It should also be noted
that the voltage-to-temperature calculation is done in-
ternally in the Pico itself.
2.1.3 Acoustical Emissions System
Two miniature Knowles BU-23173 analog contact
microphones were used in the acoustic emission sys-
tem. Both microphones were amplified through the
TDA2822m audio amplifier integrated with 39 dB
gain. After amplification, the signals are passed
through an anti-aliasing filter. Since the sampling rate
used in the microphones was 20 kHz, this results in a
Nyquist frequency of 10 kHz; hence, two first-order
low-pass filters with a cut-off frequency of 9042.89
Hz are used to avoid aliasing during the recordings.
Wearable Sensor Framework for Rehabilitation Monitoring Following Knee-Related Conditions
47
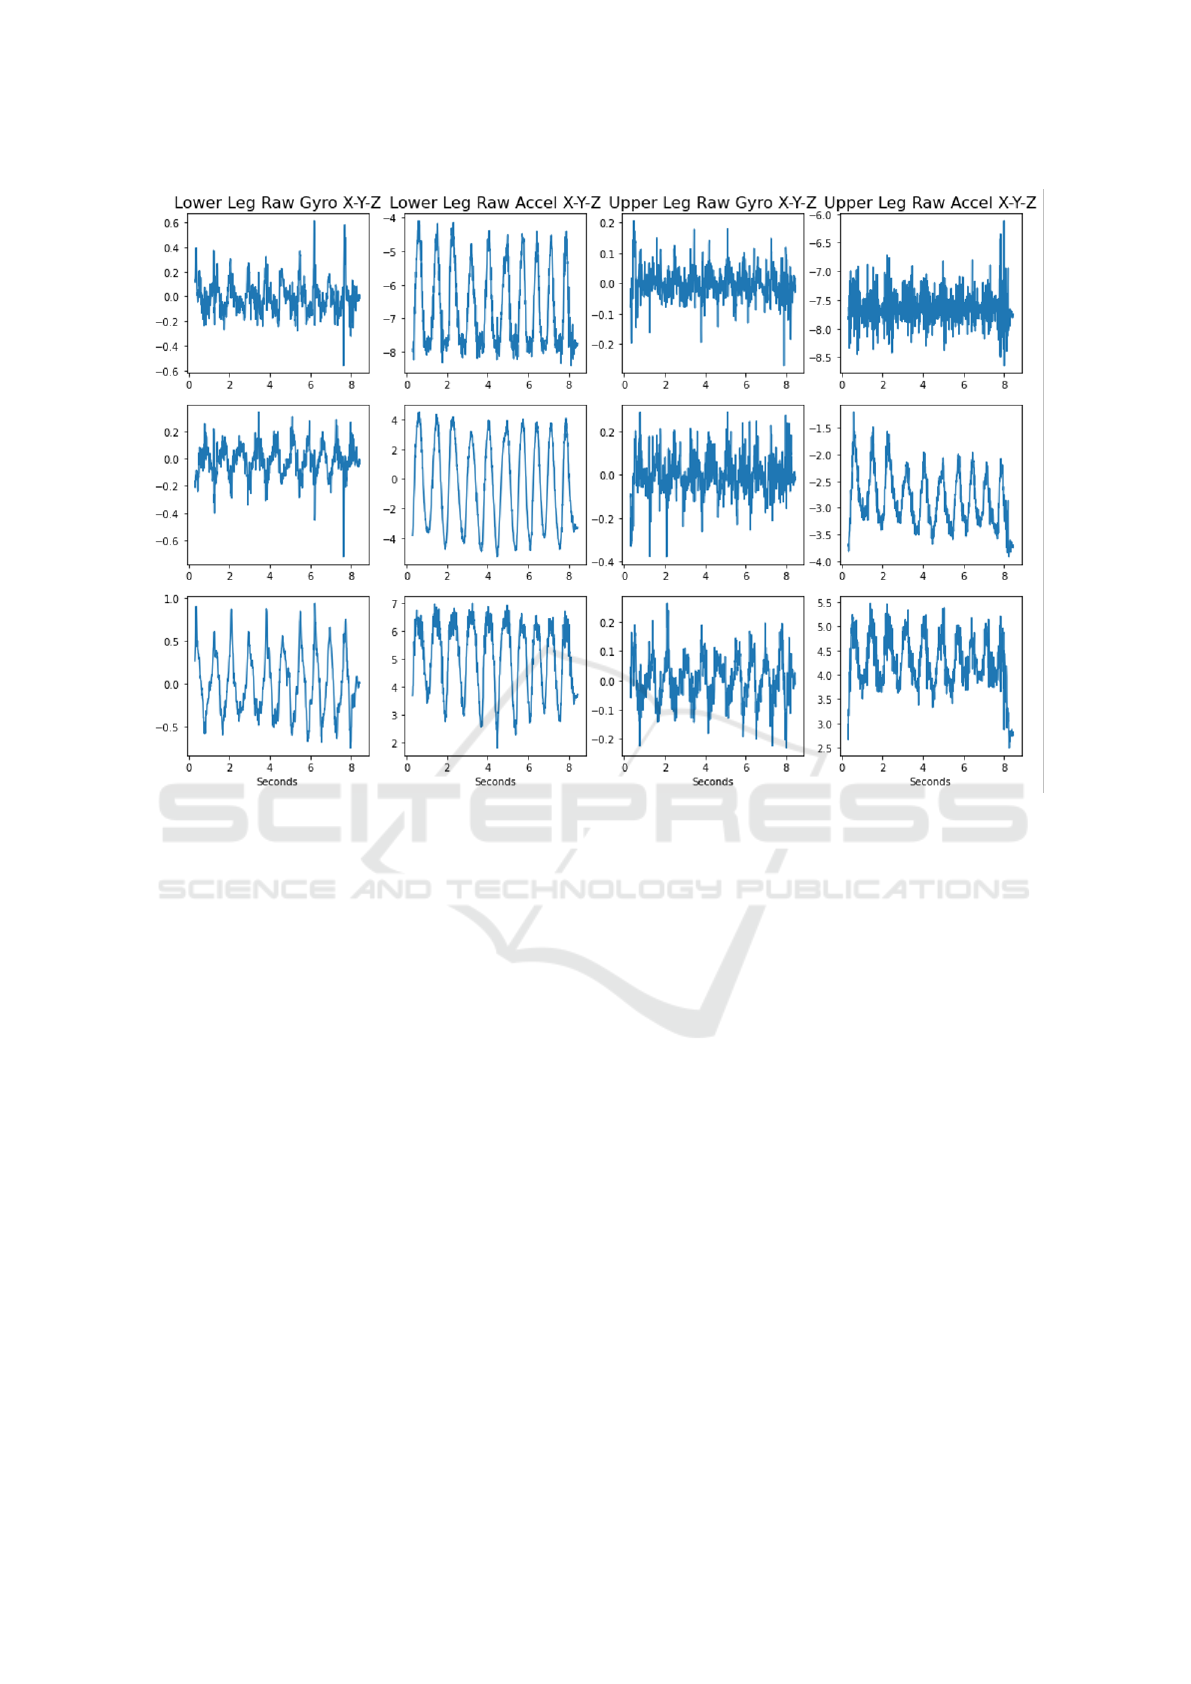
Figure 4: Raw IMU measurements showing accelerometer and gyroscope recordings individually.
2.1.4 Inertial Activity System
The inertial activity system measures joint motion and
angular changes along with knee acoustical emissions
during active movements. Accordingly, 2 IMU sen-
sors are included in the system, one fixed to the thigh
(upper) and the other to the calf (lower). A 6-axis
(3-axis accelerometer and 3-axis gyroscope) digital
BMI160 sensor is selected as the IMU. Each of the
IMUs receives data with a sampling rate of 100 Hz.
The raw accelerometer and gyroscope data are then
used for direction/angle calculation via quaternions.
2.1.5 Final System Design
In addition to the individual systems described above,
various peripheral elements are also used in the de-
sign.
The system switches between “active” and “inac-
tive” measurements via a DPDT (double pole, double
throw) switch that is controlled externally. When the
switch is in the “active” measurement position, the
output signals from the inertial activity system and
the acoustical emissions system are fed into the Pico’s
ADC pins. When the switch is set into the “passive”
position, the outputs from the electrical bioimpedance
system and the temperature measurement system are
fed into the ADC pins instead. This way, only one set
of measurements are taken at a time.
When the switch is in “active” mode, three dif-
ferent buttons are used to toggle between the “Start”,
“Hold” and “Stop” commands. When the recording
starts, a file is created on the microSD card for the ac-
tive mode; where the acoustic emission signals and
IMU data are recorded into this file. The files are
named using the date and time information captured
via the DS3231 RTC module. A flag is also added to
the file name to indicate that the record is an “active”
record.
When switching to “inactive” mode using the
switch, a second start button is used to create a
separate file with a different flag (note that the file
name still uses the date and time information from
the DS3231). Although a second “Start” button is
used for this mode, it shares the same “Hold” and
“Stop” buttons. This mode measures only 2 signals;
namely the electrical bioimpedance and the tempera-
ture, which are both analog signals. The voltage-to-
temperature measurement is done internally (as men-
tioned before), and the measured skin voltage is saved
directly into the file. All of the recorded measurement
data is saved unto an SD card through a Adafruit mi-
croSD card module.
BIODEVICES 2025 - 18th International Conference on Biomedical Electronics and Devices
48
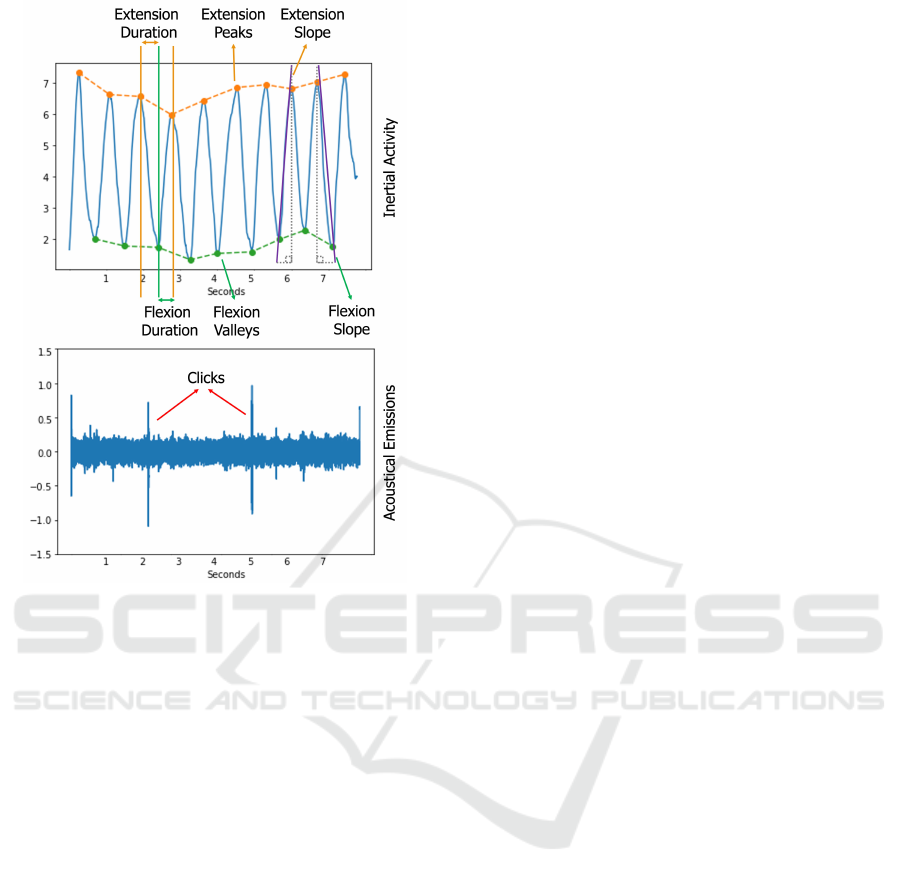
Figure 5: IMU-derived angle and acoustical emission sig-
nals shown together.
Additionally, there are 3 LEDs in the system that
indicate whether the system is functioning properly.
The green LED lighting up indicates that the record-
ing is running smoothly (for the “active” mode), while
a red LED indicates that there is a problem with the
system (e.g. SD card non-contact). For the “inactive”
mode, both the green and the yellow LED light up to
indicate that the system is recording.
2.2 Data Collection and Experimental
Protocol
The protocol for the measurements basically consists
of two main parts: (i) the sedentary recording part
during rest and (ii) the active recording part includ-
ing active tasks, as seen in Figure 3. Data was col-
lected from a healthy male participant in laboratory
settings. First, bioimpedance and temperature val-
ues were measured during 20 seconds of sedentary
measurement, followed by the active period. Dur-
ing the active period, 10 flexion-extension exercises
were performed, during which the corresponding in-
ertial activity and acoustic emission measurements
were taken. The protocol was terminated with a sec-
ond 20-second sedentary period.
2.3 Analysis Framework
2.3.1 Electrical Bioimpedance Analysis
The recorded bioimpedance signal was analyzed with
a simple signal processing algorithm implemented in
Matlab. First, the signal was passed through a very
tight band-pass filter ([59.5, 60.5] kHz) and then mul-
tiplied by 41.1392. This scaling value was obtained
experimentally: The output of the function generator
was fed as an input to the bioimpedance measurement
circuit and then the amount of drift and noise was ana-
lyzed. It was observed that the use of a bandpass filter
and this scaling factor resulted in a signal very close
to the signal seen on the oscilloscope. This algorithm
prevents any external noise from passing through and
also makes the calculated knee impedance more ac-
curate.
2.3.2 Temperature Analysis
For the temperature measurement, the Pico was pro-
grammed to shift the incoming data by 13 bits before
any value was calculated. The main reason behind
this is to avoid noise interference and to compensate
for the voltage difference between the output of the
filter and the output of the voltage divider. In ad-
dition, a simple compression algorithm was used to
reduce the temperature range to [24.5, 50.0] degrees
Celsius. Following the compression algorithm, the
temperature was shifted down to eliminate the added
bits and any DC noise.
2.3.3 Inertial Activity Analysis
The raw accelerometer and gyroscope data recorded
on the SD card were first filtered between 0.1 Hz and
48 Hz using a finite impulse response (FIR) Kaiser
window band-pass filter. The triaxial accelerometer
and gyroscope signals recorded from the calf (lower)
and thigh (upper) regions for each IMU of a sample
subject are visualized in Figure 4.
The raw accelerometer and gyroscope data were
then evaluated for direction/angle calculation using
quaternions (Seel et al., 2014). Accordingly, an ex-
tended Kalman filter was used to estimate an orien-
tation represented as a quaternion. The algorithm
first estimates the new state (the most recent ori-
entation) for the calf and thigh using the instanta-
neous measurements of the gyroscopes, then makes
the necessary corrections using the measurements of
the accelerometers. Next, quaternions are extracted
from the calculated orientations for the calf and thigh
and rotation matrices are calculated for both regions.
These two rotation matrices are multiplied to obtain
Wearable Sensor Framework for Rehabilitation Monitoring Following Knee-Related Conditions
49

Table 1: The calculated inertial activity characteristics.
Flexion Time Flexion Range Flexion Slope Extension Time Extension Range Extension Slope
Mean 0.417 4.966 0.121 0.382 4.959 0.133
Std 0.051 0.267 0.015 0.064 0.381 0.021
Max 0.510 5.345 0.138 0.540 5.517 0.172
Min 0.360 4.543 0.091 0.320 4.261 0.099
the relative rotation. Finally, from this relative rota-
tion matrix, relative angle values in x, y and z direc-
tions are obtained through Euler transformation.
The relative angles x, y and z represent the rela-
tive roll, pitch and yaw signals respectively. For an-
gle tracking and the extraction of relevant features,
relative pitch graph was used in accordance with the
mechanical orientations. On the relative pitch graph,
several features were calculated. First, the peak am-
plitudes, durations and slopes were extracted for each
flexion or extension movement. Then, the mean, stan-
dard deviation, minimum, and maximum values of
the peak, duration, and slope of all cycles were cal-
culated to evaluate the irregularity of the exercises, as
well as the maximum and minimum angles reached. It
should be noted that the features were extracted from
the non-normalized signal. This would potentially en-
able the assessment of the maximum/minimum angle
differences between the participants in future studies.
2.3.4 Acoustical Emissions Analysis
The .bin files saved on the SD card were first con-
verted to the appropriate format using Matlab. It
should be noted that the following pre-processing and
feature extraction steps were repeated for both the
left and right microphones. First, hardware noise was
suppressed using narrow band-stop filters ([185, 205]
and [940, 1050] Hz). The remaining pre-processing
and feature extraction steps were then employed in
Python (version 3.11).
In order to extract the clinically relevant part of the
acoustic emission data from the microphones, a finite
impulse response (FIR) Kaiser window bandpass fil-
ter between 250 Hz and 5 kHz was used. An example
signal is presented in Figure 5. In order to visualize
that the system successfully captures the felt clicks, a
signal containing clicks was specifically selected.
The signal was then divided into 500 ms windows
in parallel with the studies in the literature and 250 ms
overlap was used between the subsequent windows
(50% overlap). For the two different window types
(with and without clicks), we reported the distinctive
differences in the features selected from 3 different
groups: temporal (peak-to-peak), statistical (kurtosis)
and spectral (roll-off).
3 RESULTS AND DISCUSSION
3.1 Inertial Activity and Acoustical
Emissions Results
As mentioned in Section 2.2, the participant per-
formed 10 flexion-extension exercises during the pilot
data acquisition. Figure 5 clearly shows the angular
change. The dots on the graph represent the moments
of flexion, while the peaks represent the moments of
maximum extension. Although the preliminary analy-
sis focused on angular features, direct analysis of raw
accelerometer and gyroscope data would also be pos-
sible in the long term due to their high signal qual-
ity. In addition, the peak amplitudes, durations and
slopes were extracted for each flexion or extension
movement. Then, the mean, standard deviation, mini-
mum, and maximum values of the peak, duration, and
slope of all cycles were calculated to evaluate the ir-
regularity of the exercises, as well as the maximum
and minimum angles reached. The derived values are
presented in Table 1.
Figure 6 shows a superimposition of 500 ms
(10000 samples)-long segments, and examples of a
silent window and a window with clicks. As ex-
plained in Section 2.3.4, three different features were
extracted from a sample silent window and a win-
dow with clicks. As seen, the peak-to-peak values
were 0.081 and 0.023; whereas the kurtosis values
were 26.863 and 0.628, respectively. As higher kur-
tosis refers to the presence of more extreme values or
outliers (i.e. tailedness) compared to a normal dis-
tribution, it was indeed aligning with the morphol-
ogy differences between a window with click and a
silent window. Similarly, the spectral roll-off val-
ues were calculated to be 0.988 and 0.628, respec-
tively. Higher spectral roll-off in signal analysis indi-
cates that a greater proportion of the signal’s energy
is concentrated in the higher frequency components.
The joint clicks are characterized by high energy and
short duration, typically lasting between 10 and 20
milliseconds. Furthermore, these emissions contain
high-frequency components, with bandwidths extend-
ing up to 20 kHz, a range commonly expected for
acoustic emissions (Teague et al., 2016). Hence, hav-
BIODEVICES 2025 - 18th International Conference on Biomedical Electronics and Devices
50
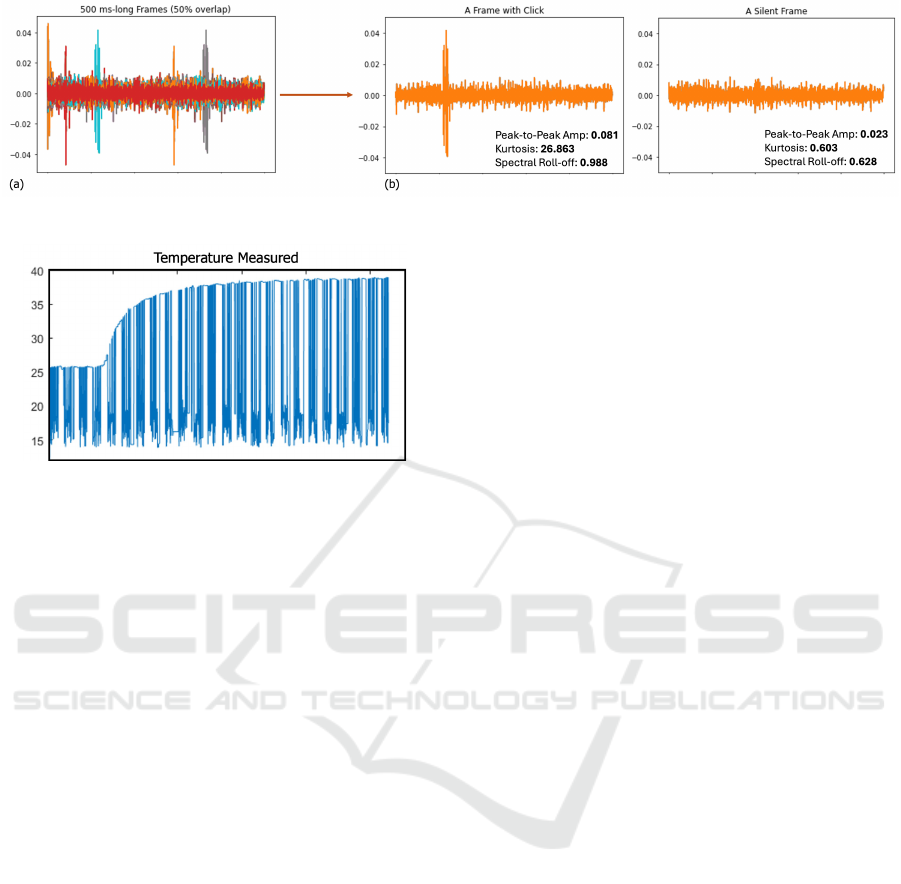
Figure 6: (a) Superimposition of acoustical emission frames. (b) Examples of a frame with a click and a silent frame.
Figure 7: Temperature measurement.
ing a higher spectral roll-of value indeed aligns with
the literature.
3.2 Temperature and Bioimpedance
Results
The temperature and impedance measurement analy-
ses were explained in Sections 2.3.2 and 2.3.1, respec-
tively. Accordingly, the resulting temperature mea-
surement for the participant is presented in Figure 7.
Similarly, the impedance value was calculated to be
97.9246 Ohm. This value was indeed in line with the
impedance values of healthy knees in studies in the
literature (Hersek et al., 2015).
4 CONCLUSION
In this work, we presented a multi-modal wear-
able sensor framework leveraging electrical
bioimpedance, acoustical emissions, inertial ac-
tivity and temperature measurements simultaneously
to obtain objective and measurable information that
can support clinical decision-making. The system
was validated using active (flexion-extension) and
inactive (sedentary) measurements and proven to be
successful in measuring the knee-related parameters.
The main limitation of the current design is the
extensive number of components. Hence, future work
will focus on transforming the current design into a
printed-circuit-board (PCB) and validating it in actual
clinical settings more easily. The first potential use
area will be to monitor the rehabilitation period of
the patients undergone total knee arthroplasty. Such
a system could help establishing direct relationships
between signal characteristics and key knee health pa-
rameters, allowing for more informed decisions about
the disease or injury status and treatment progress.
ACKNOWLEDGEMENTS
This work was supported by the Health Institutes of
Turkiye (TUSEB) under grant number 22554.
REFERENCES
Austermuehle, P. D. (2001). Common knee injuries in pri-
mary care. The Nurse Practitioner, 26(10):26–32.
Carmichael, J., Dennis, D., Jennings, J., Stevens-Lapsley,
J., and Bade, M. (2022). Feasibility and initial efficacy
of a multimodal swelling intervention after total knee
arthroplasty: A prospective pilot study with historical
controls. The Knee, 35:25–33.
George Broughton, I., Janis, J. E., and Attinger, C. E.
(2006). Wound healing: an overview. Plastic and
reconstructive surgery, 117(7S):1e–S.
Hersek, S., Pouyan, M. B., Teague, C. N., Sawka, M. N.,
Millard-Stafford, M. L., Kogler, G. F., Wolkoff, P.,
and Inan, O. T. (2017). Acoustical emission analysis
by unsupervised graph mining: A novel biomarker of
knee health status. IEEE Transactions on Biomedical
Engineering, 65(6):1291–1300.
Hersek, S., T
¨
oreyin, H., and Inan, O. T. (2015). A robust
system for longitudinal knee joint edema and blood
flow assessment based on vector bioimpedance mea-
surements. IEEE Transactions on biomedical circuits
and systems, 10(3):545–555.
Hersek, S., T
¨
oreyin, H., Teague, C. N., Millard-Stafford,
M. L., Jeong, H.-K., Bavare, M. M., Wolkoff, P.,
Sawka, M. N., and Inan, O. T. (2016). Wearable vec-
tor electrical bioimpedance system to assess knee joint
health. IEEE Transactions on Biomedical Engineer-
ing, 64(10):2353–2360.
Kianifar, R., Lee, A., Raina, S., and Kuli
´
c, D. (2017). Auto-
mated assessment of dynamic knee valgus and risk of
knee injury during the single leg squat. IEEE journal
Wearable Sensor Framework for Rehabilitation Monitoring Following Knee-Related Conditions
51

of translational engineering in health and medicine,
5:1–13.
Sarillee, M., Hariharan, M., Anas, M., Omar, M., Aishah,
M., and Oung, Q. W. (2014). Assessment of knee joint
abnormality using acoustic emission sensors. In 2014
IEEE International Conference on Control System,
Computing and Engineering (ICCSCE 2014), pages
378–383. IEEE.
Seel, T., Raisch, J., and Schauer, T. (2014). Imu-based
joint angle measurement for gait analysis. Sensors,
14(4):6891–6909.
Semiz, B., Hersek, S., Whittingslow, D. C., Ponder, L. A.,
Prahalad, S., and Inan, O. T. (2018). Using knee
acoustical emissions for sensing joint health in pa-
tients with juvenile idiopathic arthritis: A pilot study.
IEEE sensors journal, 18(22):9128–9136.
Teague, C. N., Hersek, S., T
¨
oreyin, H., Millard-Stafford,
M. L., Jones, M. L., Kogler, G. F., Sawka, M. N., and
Inan, O. T. (2016). Novel methods for sensing acous-
tical emissions from the knee for wearable joint health
assessment. IEEE Transactions on Biomedical Engi-
neering, 63(8):1581–1590.
WHO (2022). Musculoskeletal health — who.int. World
Health Organization. [Accessed 06-10-2024].
BIODEVICES 2025 - 18th International Conference on Biomedical Electronics and Devices
52
