
Detection of Door-Closing Defects
by Learning from Physics-Based Simulations
Ryoga Takahashi
1 a
, Yota Yamamoto
1 b
, Ryosuke Furuta
2
and Yukinobu Taniguchi
1 c
1
Department of Information and Computer Technology, Tokyo University of Science, Tokyo, Japan
2
Institute of Industrial Science, The University of Tokyo, Tokyo, Japan
Keywords:
Defect Detection, Video Recognition, Automobile Visual Inspection.
Abstract:
In this paper, we propose a method that applies physics-based simulations for detecting door-closing defects.
Quantitative inspection of industrial products is essential to reduce human errors and variation in inspection
results. Door-closing inspections, which now rely on human sensory evaluation, are prime targets for quantifi-
cation and automation. Developing a visual inspection model based on deep learning requires time-consuming
and labor-intensive data collection with dedicated measuring instruments. To eliminate the need for expensive
data collection, our proposal uses physics-based simulation data instead of real data to learn the physical rela-
tionships. Specifically, we simultaneously learn a binary classification task for normal and defective doors and
a task for estimating door-closing energy while sharing parameters, which allows us to learn the relationships
between them in a preliminary step. Experiments demonstrate that our method has greater accuracy than ex-
isting methods and achieves an accuracy comparable to the method that uses ground-truth data collected with
dedicated measuring instruments.
1 INTRODUCTION
In the final stage of industrial product quality assur-
ance, known as finished product inspection, quantita-
tive evaluations are required. Particularly in sensory-
based inspections, which rely on human visual and
auditory senses, results are often influenced by the
inspector’s experience and personal judgment, lead-
ing to variability and concerns about potential over-
sight due to human error. One example of finished
product inspection in the automotive industry is the
door-closing (DC) inspection, where inspectors check
for jamming or unusual noise when closing the door.
Currently, this inspection depends on sensory evalua-
tions.
Although a method has been developed that quan-
titatively evaluates the ease of DC (Yanagisawa et al.,
2012), it requires specialized measuring devices and
involves cumbersome procedures for attaching the
devices to the door. In addition, this method is
time-consuming and labor-intensive due to the repet-
itive DC operations, and it is currently used only for
a
https://orcid.org/0009-0005-9247-8339
b
https://orcid.org/0000-0002-1679-5050
c
https://orcid.org/0000-0003-3290-1041
sample-based inspections, not for all doors. Specif-
ically, this method performs the DC inspection by
measuring the minimum energy required to close the
door (minimum DC energy). As the minimum DC
energy cannot be measured directly, the applied force
(DC energy) is varied, see Figure 1(a)(b), while re-
peatedly closing the door to determine the boundary
at which the door closes successfully, thereby identi-
fying the “minimum” DC energy. Based on this mea-
suring process, the door is considered normal if the
energy is below a certain threshold, while energy ex-
ceeding the threshold indicates a defect.
Our objective is to automate DC inspection using
only high-speed camera video; no measuring devices
need to be attached to the door. If defects can be de-
tected from the video footage of inspectors closing the
door, it would enable efficient and quantitative inspec-
tions, extending the DC inspection process, which is
currently conducted on a sample basis, to all doors.
By reviewing high-speed camera footage of DC
operations, we found that, as shown in Figure 1(c)(d),
normal doors sink into the frame to a certain extent
and bounce one to two times (Figure 1(c)), while de-
fective doors, due to higher friction from the hinges
and other parts, sink to a smaller depth (Figure 1(d)).
However, the visual difference between normal and
Takahashi, R., Yamamoto, Y., Furuta, R. and Taniguchi, Y.
Detection of Door-Closing Defects by Learning from Physics-Based Simulations.
DOI: 10.5220/0013148200003912
Paper published under CC license (CC BY-NC-ND 4.0)
In Proceedings of the 20th International Joint Conference on Computer Vision, Imaging and Computer Graphics Theor y and Applications (VISIGRAPP 2025) - Volume 2: VISAPP, pages
93-98
ISBN: 978-989-758-728-3; ISSN: 2184-4321
Proceedings Copyright © 2025 by SCITEPRESS – Science and Technology Publications, Lda.
93
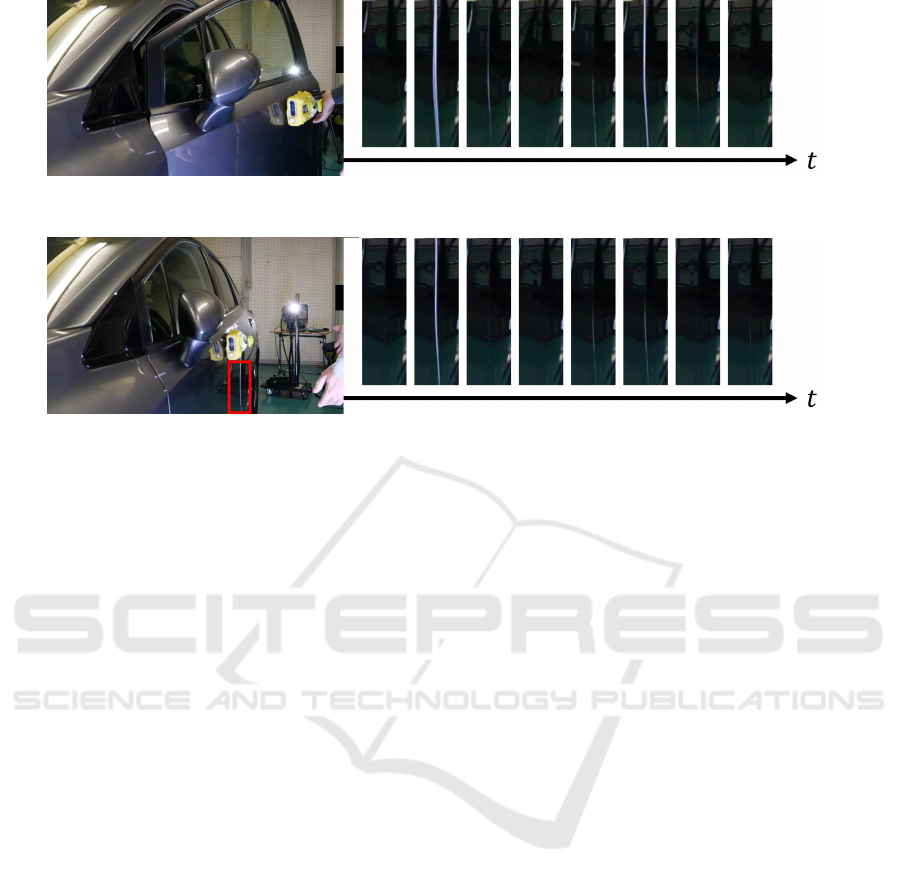
(a) The door starting to close (c)Normal door
(b) Door closing (d)Defective door
Figure 1: Door-closing inspection focusing on the door sink depth. The images on the left, (a) and (b), show the process of
door-closing inspection. The image sequences on the right, (c) and (d), show a close-up view of the area highlighted by the
red box in (b). (c) the normal door bounces twice at the second and sixth frames, while the defective door,(d), bounces once
at the second frame.
defective doors is minimal, making it difficult for the
human eye to distinguish them apart. Furthermore,
since the force applied by inspectors when closing
the door varies, it was found that relying solely on
sink depth or bounce count for defect detection using
a simple threshold method fails to achieve accurate
results. In addition, the machine learning of anomaly
detectors requires collecting a large amount of train-
ing data, which involves preparing multiple vehicle
bodies and having inspectors perform the DC oper-
ation while capturing it with the camera. This pro-
cess is time-consuming and labor-intensive, making
it challenging to gather a substantial amount of data.
This paper proposes a method for learning an ac-
curate DC defect detection model using pre-training
with simulation data based on physical laws; it is ef-
fective when only a small amount of real data is avail-
able. (Takahashi et al., 2024) proposed an approach
that simultaneously learns the tasks of DC energy
and defect detection to address data sparsity prob-
lems. However, they still used ground-truth DC en-
ergy data for training, which is time-consuming and
labor-intensive to obtain. The contributions of this re-
search are as follows:
• We propose a method for learning high-accuracy
DC defect detection using pre-training with sim-
ulation data based on physical laws, even if the
amount of training data is scant.
• In experiments our method achieved accuracy
comparable to that of an existing method that uses
DC energy data as the ground-truth data.
2 RELATED WORKS
Defect Detection in Industrial Products. There are
many deep learning methods for defect detection in
industrial products (Akcay et al., 2019; Roth et al.,
2022). For example, the MVTec dataset (Bergmann
et al., 2019) contains data on industrial products, in-
cluding screws and metal nuts, and research is being
conducted to make use of this data. While most meth-
ods target defects, such as scratches and dents, that
can be detected from still images, we target defects
that cannot be detected without video.
Video Anomaly Detection. Many video anomaly
detection methods have been developed; most tar-
get traffic surveillance videos (Ramachandra et al.,
2020; Ren et al., 2021). These methods detect anoma-
lies that humans can quickly identify, such as cars or
skaters entering the sidewalk (Li et al., 2013) and traf-
fic accidents, arson, and assault (Sultani et al., 2018).
In contrast to these methods, we tackle DC defect de-
tection, where the visual differences between normal
and defective products are too slight for humans to
distinguish as shown in Sec. 1.
Physics-Informed Machine Learning. In recent
years, various methods have been developed to in-
corporate physical laws as prior knowledge into ma-
chine learning systems (Hao et al., 2022; Zideh et al.,
VISAPP 2025 - 20th International Conference on Computer Vision Theory and Applications
94
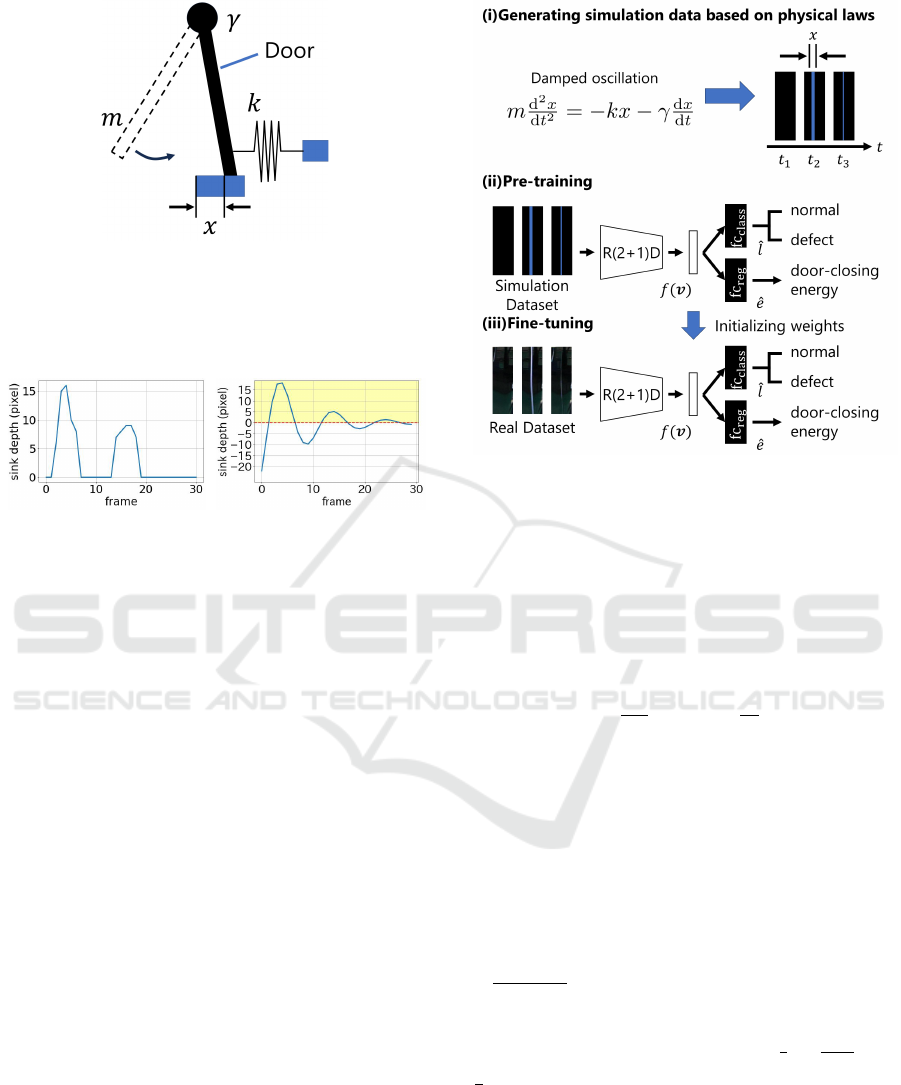
Figure 2: Schematic diagram of damped oscillation in door
closing (top-down view), where x, m, k, and γ are the door’s
sink depth, the mass of the door, the stiffness of the door
hinge, and the damping factor accounting for hinge friction,
respectively.
(a) (b)
Figure 3: Temporal changes in (a) measured sink depth, and
(b) sink depth simulated with damped oscillation (Eq. (2)).
2023). These approaches seek solutions based on not
only data but also the underlying physical laws asso-
ciated with the problem. (Raissi et al., 2019) built
a framework that integrates partial differential equa-
tions as prior information into the loss function to en-
sure physical consistency. Another effective approach
to incorporating physical laws is to use simulation
data in pre-training. (Jia et al., 2021) successfully
captured actual physical phenomena by pre-training
a model with simulation data and then fine-tuning it.
This research takes inspiration from this approach.
3 DOOR-CLOSING PHYSICAL
MODEL
Kavthekar et al. (Navalkumar and Avinash, 2015) an-
alyzed the factors that affect the DC speed of passen-
ger cars. The analysis addressed six factors: hinge
friction, gravity, inertia forces due to the tilt of the
hinge axis, resistance force from the check straps,
latching force, compression characteristics of the door
seal, and air resistance. They modeled the forces and
torques of each factor based on the door opening and
closing angles and displacement amounts.
In this study, we assume that a simplified physi-
cal model underlies this analysis, and DC is simply
modeled as a damped vibration based on observation
Figure 4: Overview of the proposed method. (i) Video clips
that simulate door-closing behavior are generated based on
damped oscillation. (ii) Pre-training a defect classification
model with simulation data. (iii) Fine-tuning with a real
dataset. This approach enables simultaneous learning of the
binary classification task for normal and abnormal cases as
well as the door-closing energy regression task.
results. The damped oscillation is expressed by the
following ordinary differential equation:
m
d
2
x
dt
2
= −kx − γ
dx
dt
, (1)
where x, t, m, k, and γ represent the displacement
(sink depth), time, mass, spring constant, and damp-
ing factor (e.g., hinge friction), respectively. As
shown in Figure 2, these parameters reflect DC be-
havior, where the spring constant k is replaced by the
stiffness of the door hinge and the damping factor γ is
replaced by hinge friction. The general solution is
x(t) = Ae
−κt
cos(ω
1
t + δ), (2)
where A and δ are constants, κ = γ/2m, and ω
1
≡
p
k/m − κ
2
. Additionally, the initial energy corre-
sponding to the DC energy in the damped oscillation
of a vehicle’s DC is represented by
1
2
m
dx(0)
dt
2
=
1
2
mv
2
0
. As shown in Figure 3, both the actual and
synthetic videos generated by the simulation exhibit
similar temporal behavior with regard to sink depth.
Thus, the temporal change in sink depth can be ap-
proximated using the positive region of the damped
oscillation.
Detection of Door-Closing Defects by Learning from Physics-Based Simulations
95

4 PROPOSED METHOD
The overall process of the proposed method is il-
lustrated in Figure 4: (i) generating simulation data
based on physical laws, (ii) pre-training with the sim-
ulation data, and (iii) fine-tuning with a small amount
of actual data.
4.1 Generation of Simulation Data
Based on Physical Laws
The simulation data is created by observing the door’s
sink depth x from a virtual camera positioned at the
same location as the real data. Specifically, rather
than a 3D curved surface, the door is modeled as a
2D plane onto which an image of the car is texture-
mapped. The bouncing motion of the door is approx-
imated with planar oscillation instead of 3D rotation
around the hinge. The door sink depth is represented
by a solid-colored straight line of width x(t). Video
clips v
v
v
sim
∈ R
200×200×3×50
are generated while vary-
ing damping factor γ and initial speed v
0
, where the
dimensions represent a size of 200 × 200 pixels, 3
color channels, and 50 frames. Other parameters, m
and k, are fixed. The binary label l
sim
i
(“defective” or
“normal”) for video clip v
v
v
sim
i
is set to “defective” if
γ is larger than a threshold value and “normal” oth-
erwise. For implementation simplicity, we use v
0
in-
stead of DC energy e
sim
i
(i.e., e
sim
i
is set to v
0
) since
m is a constant and the DC energy e
i
(=
1
2
mv
2
0
) corre-
sponds one-to-one with the initial velocity v
0
.
4.2 Pre-Training
As shown in Figure 4(ii), we train the DC defect de-
tection model with simulation data: video clips v
v
v
sim
i
∈
R
200×200×3×50
, labels l
sim
i
, and the DC energy e
sim
i
are
utilized. The model takes video clip v
v
v
sim
i
as input and
predicts the normal or abnormal label l
sim
i
as a binary
classification task; the DC energy e
sim
i
is predicted
as a regression task. The feature extraction part uses
R(2+1)D, a type of 3D convolutional neural network
(CNN) (Tran et al., 2018), as the backbone, yield-
ing 512-dimensional feature vector f (v
v
v
sim
) ∈ R
512
.
The output f (v
v
v
real
) is fed into a fully connected layer
fc
class
for normal and abnormal classification, and into
another fully connected layer fc
reg
for DC energy es-
timation.
The loss function for binary classification is the
weighted binary cross-entropy
L
WBCE
(l
i
,
ˆ
l
i
) =
1
n
1
l
i
logσ(
ˆ
l
i
) +
1
n
0
(1 −l
i
)log(1 − σ(
ˆ
l
i
)),
(3)
(a) Car C1 (b) Car C2
(c) Car C3
Figure 5: Cars used in the experiment.
where
ˆ
l
i
= fc
class
( f (v
v
v
i
)), σ denotes the sigmoid func-
tion, n
0
and n
1
are the number of samples l
i
= 0 and
l
i
= 1, respectively. The loss function for the regres-
sion problem is Huber loss (Huber, 1964):
L
Huber
(e
i
, ˆe
i
) =
(
1
2
( ˆe
i
− e
i
)
2
if | ˆe
i
− e
i
| < δ,
δ(| ˆe
i
− e
i
| −
1
2
δ) otherwise,
(4)
where ˆe
i
= fc
reg
( f (v
v
v
i
)), and δ is a hyperparameter set
to 1.0. By combining these losses, the overall loss
function is defined by
L = λ
pt
· L
WBCE
(l
i
,
ˆ
l
i
) + (1 − λ
pt
)L
Huber
(e
i
, ˆe
i
), (5)
where λ
pt
is a hyperparameter that balances the two
losses.
4.3 Fine-Ttuning
As shown in Figure 4(iii), we finetune the pre-
trained model using a real dataset: video clips v
v
v
real
i
∈
R
200×200×3×50
with the corresponding binary labels
l
real
i
“defective” or “normal”). Video clip v
v
v
real
i
is
cropped from the original video and resized to focus
on the door’s sink depth. Note that the correct DC en-
ergy, e
real
i
, is not available at this stage. We used the
loss function
L = λ
ft
L
WBCE
(l
i
,
ˆ
l
i
)+(1−λ
ft
)L
Huber
(e
pseudo
i
, ˆe
i
), (6)
where λ
ft
is a hyperparameter that balances the two
losses. We use the DC energy predicted by the
pre-trained model as pseudo DC energy e
pseudo
i
=
fc
reg
( f (v
v
v
real
)) to maintain (avoid forgetting) the DC
energy estimation learned by the pre-trained model.
5 EXPERIMENTS
In this section, we verify the effectiveness of the pro-
posed method.
VISAPP 2025 - 20th International Conference on Computer Vision Theory and Applications
96

Table 1: Ground-truth labels (n for normal, d for defect)
and the number of video clips per experimental condition.
The ground-truth label indicates a defect if the minimum
DC energy is higher than a certain threshold value.
Car ID 0 mm 2 mm 4 mm
C1 72(n) 88(n) 108(d)
C2 111(n) 115(n) 156(d)
C3 103(n) 131(d) 107(d)
5.1 Real Dataset
We constructed a dataset of DC videos by shooting
DC operations while creating simulated defects by
placing sheet wax since vehicles with actual defects
are rare and difficult to prepare. Three units of the
same car model, C1, C2, and C3 shown in Figure 5,
were prepared. Nine experimental conditions were
established by varying the reaction strength compo-
nent in three steps by placing 0, 2, and 4 mm sheet
wax between the door and the frame of each car. Each
time the conditions were changed, the minimum DC
energy was measured with a force inducer to deter-
mine if the door was normal or defective, and the re-
sults were recorded as ground-truth labels. For each
condition, DC operations were repeated 200 times
while varying the strength of the door push while be-
ing captured by a high-speed camera at 240 fps and
1,920×1,080 pixels. The DC energy was measured
with a measuring device during each DC event. The
ground-truth labels and the number of video clips per
experimental condition generated by these methods
are shown in Table 1. We excluded 809 video clips
in which the door failed to close or when the device
couldn’t acquire DC energy due to erroneous push
events.
5.2 Evaluation Metric
To evaluate defect detection performance, we used
Accuracy =
T P + T N
T P + FP + FN + T N
, (7)
where T P, FP, FN, and T N are the number of true
positives, false positives, false negatives, and true
negatives, respectively. The accuracy was evaluated
using leave-one-out cross-validation, i.e., two cars
were used for training and one for testing.
In addition, to evaluate the accuracy of the DC en-
ergy estimation, we used the correlation coefficient
r =
∑
( ˆe
i
−
¯
ˆe)(e
real
i
− e
real
)
p
∑
( ˆe
i
−
¯
ˆe)
2
q
∑
(e
real
i
− e
real
)
2
, (8)
where
¯
ˆe and e
real
represent the mean values of ˆe and
e
real
, respectively.
(a) (b)
Figure 6: Examples of video clips generated by physical
simulation for (a) normal door, (b) defective door. The blue
areas correspond to the door’s sink depth.
Table 2: Accuracy for each Car ID for each method. PT and
fc
reg
denote pre-training and fully connected layer for DC
estimation(Figure 4 (ii)). The DC-Energy-infused method,
based on (Takahashi et al., 2024), utilizes ground-truth data
as door-closing energy input.
Method C1 C2 C3 Avg
Baseline 0.78 0.77 0.79 0.78
+PT 0.88 0.83 0.85 0.85
+PT+fc
reg
(Ours) 0.82 0.84 0.93 0.86
DC-Energy-infused 0.83 0.97 0.86 0.89
5.3 Implementation Details
Synthetic video clips were generated while randomly
sampling damping factor γ and initial velocity v
0
fol-
lowing uniform distributions with ranges of [0.25,
0.45] and [8, 16], respectively. Parameters m and k
were set to 1 and 4π
2
, respectively. Hyperparameters
λ
pt
and λ
ft
were both set to 0.5. Examples of the data
so generated are shown in Figure 6. Stochastic gra-
dient decent (SGD) was used for model optimization.
Specifically, the learning rate started at 0.01 and was
halved every 25 epochs, with the momentum set to
0.9. The number of epochs was set to 100.
5.4 Results and Discussion
To verify the effectiveness of pre-training and the DC
energy estimation component, we compared the ac-
curacy with and without pre-training and fc
reg
. The
methods compared are the Baseline and DC-Energy-
infused. The baseline has the network of the proposed
method without the DC energy estimation head fc
reg
,
and its parameters are initialized with those of the
model pre-trained on Kinetics (Kay et al., 2017). The
DC-Energy-infused method (Takahashi et al., 2024) is
trained separately using only the real data without uti-
lizing simulation data. Unlike the proposed method,
the DC energy estimator employs the ground-truth
DC energy from the real data for training, and fea-
tures related to the DC energy are added to the fully
connected layer before the binary classification of the
baseline.
Relative to the baseline, our method
(Baseline+PT+fc
reg
) improved the average accu-
racy by 0.08. Comparing the baseline to baseline+PT,
Detection of Door-Closing Defects by Learning from Physics-Based Simulations
97

Table 3: Correlation coefficient between the ground-truth
data for door-closing energy and the pseudo output results.
Car ID C1 C2 C3 Avg
Ours w/o fine-tuning 0.88 0.96 0.90 0.91
Ours 0.53 0.90 0.87 0.77
the accuracy increased by 0.07, indicating that
pre-training contributes significantly to accuracy
enhancement. Additionally, the comparison between
baseline+PT and baseline+PT+fc
reg
shows a further
increase of 0.01, suggesting that while door-closing
energy estimation also contributes to performance,
its impact is less significant than that of pre-training.
Furthermore, our method matched the accuracy of
the DC-Energy-infused method, even without the
ground-truth data for DC energy.
To confirm that the proposed model success-
fully learned features needed for predicting DC en-
ergy, we calculated the correlation coefficients be-
tween the ground-truth DC energy and the predic-
tion fc
reg
( f (v
v
v
real
)). As shown in Table 3, the correla-
tion decreases by the fine-tuning because we used the
pseudo DC energy for the training on the real data.
However, the positive correlation coefficients suggest
that the model could well estimate DC energy even
without ground truth on real data. This shows that
the model can estimate DC energy accurately while
reducing the need for actual ground truth.
6 CONCLUSIONS
We proposed a deep-learning-based method for door-
closing inspection with pre-training on physics-based
simulation data to acquire features for door-closing
energy estimation. Experiments confirmed the effec-
tiveness of the proposed method. In the future, we
will develop methods that consider different defect
factors, such as hinge axis tilt and air resistance, using
multimodal data from both video and audio.
REFERENCES
Akcay, S. et al. (2019). GANomaly: Semi-Supervised
Anomaly Detection Via Adversarial Training. In
ACCV, pages 622–637. Springer.
Bergmann, P. et al. (2019). MVTec AD–A Comprehensive
Real-World Dataset for Unsupervised Anomaly De-
tection. In CVPR, pages 9592–9600.
Hao, Z. et al. (2022). Physics-Informed Machine Learn-
ing: A Survey on Problems, Methods and Applica-
tions. arXiv:2211.08064.
Huber, P. J. (1964). Robust Estimation of A Location Pa-
rameter. Ann. Math. Stat., 35(1):73–101.
Jia, X. et al. (2021). Physics-Guided Machine Learning for
Scientific Discovery: An Application in Simulating
Lake Temperature Profiles. ACM/IMS Transactions
on Data Science, 2(3):1–26.
Kay, W. et al. (2017). The Kinetics Human Action Video
Dataset. In arXiv:1705.06950, pages 1–22.
Li, W. et al. (2013). Anomaly Detection and Localization
in Crowded Scenes. IEEE Transactions on Pattern
Analysis and Machine Intelligence, 36(1):18–32.
Navalkumar, K. and Avinash, B. (2015). Numerical Analy-
sis of Door Closing Velocity for A Passenger Car. Int
J Cybern Inf, 4(2):1–16.
Raissi, M. et al. (2019). Physics-Informed Neural Net-
works: A deep Learning Framework for Solving For-
ward and Inverse Problems Involving Nonlinear Par-
tial Differential Equations. Journal of Computational
physics, 378:686–707.
Ramachandra, B. et al. (2020). A Survey of Single-Scene
Video Anomaly Detection. IEEE Transactions on Pat-
tern Analysis and Machine Intelligence, 44(5):2293–
2312.
Ren, J. et al. (2021). Deep Video Anomaly Detection:
Opportunities and Challenges. In 2021 International
Conference on Data Mining Workshops (ICDMW),
pages 959–966. IEEE.
Roth, K. et al. (2022). Towards Total Recall in Industrial
Anomaly Detection. In CVPR, pages 14318–14328.
Sultani, W. et al. (2018). Real-World Anomaly Detection in
Surveillance Videos. In CVPR, pages 6479–6488.
Takahashi, R. et al. (2024). Detection of Door Closing De-
fects by Analyzing Video from a High-speed Camera.
In The International Workshop on Frontiers of Com-
puter Vision, pages 1–3.
Tran, D., Wang, et al. (2018). A Closer Look at Spatiotem-
poral Convolutions for Action Recognition. In CVPR,
pages 6450–6459.
Yanagisawa, M. et al. (2012). Development of Measure-
ment Technology for Quality Enhancement. Nissan
Technical Review, 71:84–87.
Zideh, M. J., Chatterjee, P., and Srivastava, A. K.
(2023). Physics-Informed Machine Learning for Data
Anomaly Detection, Classification, Localization, and
Mitigation: A Review, Challenges, and Path Forward.
IEEE Access.
VISAPP 2025 - 20th International Conference on Computer Vision Theory and Applications
98
