
Electrical Response of Bacteria Cells in Water as Detection Mechanism
Abdullah Al-Khulaqi
1
, Abdullah Abdulhameed
2 a
and Yaqub Mahnashi
1,2,3 b
1
Bioengineering Department, King Fahd University of Petroleum & Minerals, Dhahran, Saudi Arabia
2
Center for Communication Systems and Sensing, King Fahd University of Petroleum & Minerals, Dhahran, Saudi Arabia
3
Electrical Engineering Department, King Fahd University of Petroleum & Minerals, Dhahran, Saudi Arabia
{s202182550, abdullah.abdulhameed, ymahnashi}@kfupm.edu.sa
Keywords:
Bacteria Detection, Escherichia Coli, Pseudomonas Aeruginosa, Bacillus Cereus, Biosensing, Water Security.
Abstract:
The detection of bacteria in drinking water is considered a critical step for the treatment and quality analysis
of water. Escherichia coli and Pseudomonas aeruginosa are among the most common bacteria found in water
sources in different regions of Saudi Arabia. The detection is determined by using common biochemical tests
and sophisticated machine analysis. These methods are not sustainable for continuous daily detection due
to their cost and time consumption. However, the electric characterization and separation of bacteria is a
cost-effective and promising approach due to its real-time diagnosis and integration capabilities. This study
aims to identify the electric characterization of three strands of bacteria, Escherichia coli, Bacillus cereus,
and Pseudomonas aeruginosa, prior to detection. The bacteria are subjected to electric fields with different
amplitudes and frequencies on the top of microelectrodes. The movement and resistance of Escherichia coli,
Bacillus cereus, and Pseudomonas aeruginosa cells are investigated before and after applying the electric
field. The movement and reaction of bacteria are observed under a microscope where a stronger response is
noticed at higher signal amplitude. Before applying the electric field, the resistances of the above bacteria are
found to be 1.28, 11.85, and 7 MΩ. Then, these values change to 4.6, 19, and 3.65 MΩ, respectively, after
applying the electric field. In addition, the separation of bacteria in a mixture of Escherichia coli and Bacillus
cereus at different frequencies is also investigated and presented in this paper.
1 INTRODUCTION
Water is considered to be a source of life. This state-
ment reflects our needs and the importance of water in
our daily live. The availability of clean drinking wa-
ter is becoming a priority(Okafor et al., 2024). The
challenge occurs in the presence of Bacteria, which
are prokaryotic creatures found everywhere. They
can live in several environments and regions, adapt-
ing to the surrounding area to survive and multiply
(Alawi et al., 2024). Bacteria pose critical health is-
sues when consumed in water or any contaminated
environment that can allow the bacteria to grow in the
human body, generating immune responses and harm-
ful infection (Alqahtani et al., 2015). The detection of
Bacteria in drinking water is considered a crucial fac-
tor for developing a clean environmental ecosystem
that could enhance the quality of drinking water for
society. Several studies in different regions of Saudi
Arabia investigated the presence of several types of
a
https://orcid.org/0000-0002-6122-8995
b
https://orcid.org/0000-0003-3400-466X
bacteria in water samples collected from sources such
as water taps, roof tanks and tankers (Abada et al.,
2019; Abdalwahab et al., 2017; Alaidarous et al.,
2017). The types and concentrations of bacteria found
in these studies were different according to the city
and source from which they were collected. The
detection results showed that Pseudomonas aerugi-
nosa is the most common bacteria that was present
in the samples collected from around Saudi Arabia
cities (Abdalwahab et al., 2017). The second most
common appearance was Escherichia coli (Tenaillon
et al., 2010). This analysis helps to identify the bac-
teria that are commonly found in drinking water that
could help in the development of more clean water for
consumers. It is important to mention that each study
represents many different types of bacteria, and the
Pseudomonas aeruginosa and Escherichia coli men-
tioned above were the most mentioned in all studies
(Alshammari et al., 2016).
The bacteria detection techniques used in these
studies were the conventional bacteria detection
methods. Polymerase Chain Reaction (PCR) tech-
Al-Khulaqi, A., Abdulhameed, A. and Mahnashi, Y.
Electrical Response of Bacteria Cells in Water as Detection Mechanism.
DOI: 10.5220/0013149000003911
Paper published under CC license (CC BY-NC-ND 4.0)
In Proceedings of the 18th International Joint Conference on Biomedical Engineering Systems and Technologies (BIOSTEC 2025) - Volume 1, pages 143-148
ISBN: 978-989-758-731-3; ISSN: 2184-4305
Proceedings Copyright © 2025 by SCITEPRESS – Science and Technology Publications, Lda.
143

nique and genomic DNA amplification were used in
the detection process by special devices such as ap-
plied biosystems prism 3730xl DNA analyzer (Abada
et al., 2019). The main part of the DNA strand of
the bacteria to be identified is 16S rRNA, which can
be identified in several other techniques such as using
GeneJET genomic DNA purification kit (Eid et al.,
2017). There are other methods used in the detection
of bacteria, which require sample preparation to en-
able the bacteria to grow, then using simple processes
such as the seven biochemical tests to identify the
bacteria species (Eid et al., 2017) (Al-Turk and Diab,
2009). Gram stain, named for Hans Christian Gram,
is a technique that uses differential staining with a
crystal violet-iodine complex and a safranin counter-
stain to distinguish between different strands of bacte-
ria. Gram-positive and Gram-negative (Bartholomew
and Mittwer, 1952). Gram-positive has one Thick
peptidoglycan layer. Whereas Gram-negative has two
thin peptidoglycan layers (Coico, 2006). These de-
tection methods require sophisticated machines with
special software and statistical packages to complete
the detection of a single sample (Omer et al., 2014).
Further, the complexity of some of these methods, be-
sides the time and resources they require, make it nec-
essary to find better approaches to detect bacteria in
drinking water in real-time.
Although the process of detecting bacteria in wa-
ter is complex and needs a lot of steps to completed,
electric characterization is a preferable method for the
detection of the specific type of bacteria in drinking
water. The electric characterization always depends
on conductivity and the permittivity of the bacteria
(Rahim et al., 2018). These characteristics could vary
between the different types of bacteria in terms of the
shape and size of the bacteria to be detected (Chen
et al., 2024; Ware et al., 2024). Identifying these bac-
teria characteristics using electronics can be a useful
method to detect the different types of bacteria in real-
time applications without the need to take any sam-
ples out from the sources and conduct several tests in
the lab. This method will save a lot of resources and
time in detecting bacteria in drinking water. An exam-
ple of electric characterizations is the usage of the di-
electrophoresis method to manipulate bacteria(Weber
et al., 2021). Dielectrophoresis is the motion of polar-
ized bioparticles, such as bacteria, in a liquid medium
that has different permittivity and conductivity(Qian
et al., 2014). This research is developing a new real-
time mechanism for the detection of bacteria in drink-
ing water. The system separates different types of
bacteria by their electrical conductivity and permit-
tivity. This new technique solves the problem of the
regular wet lab test that takes one sample from the wa-
ter, then separates the different types of bacteria, and
uses a sophisticated machine to know the strand found
in the sample, which is time-consuming. The nutri-
ent agar and the bacteria media were prepared in the
lab as a reference method to confirm the presence of
bacteria cells. The electrical response and resistance
of three bacteria strands were measured and investi-
gated. Also, two types of bacteria were mixed and
visualized under the microscope, and their reaction
to the different frequencies was studied. The scope
of the study is to capture the change in movement
and behavior when bacteria cells pass in electric fields
generated by microelectrodes. The rest of the paper is
structured as follows. The following sections explain
the methodology and materials used in this project.
Section three presents the results obtained and pro-
vides a detailed discussion. The paper is concluded in
section four.
2 MATERIALS AND METHODS
The experimental work is divided into sample prepa-
ration and bacteria manipulation. The sample prepa-
ration is started by preparing nutrient agar solution,
where 28 grams of dehydrated powder (lab-prepared
media) is added to 1000 milliliters of distilled water
and mixed in a flask. The suspension is then heated
to boiling to dissolve the medium completely. The
dissolved medium is then autoclaved at 15 lbs pres-
sure (121°C) for 15 minutes. Once the autoclave pro-
cess is complete, the flask is taken out and cooled to
a temperature of about 40-45°C. The media is then
poured into sterile Petriove plates under sterile con-
ditions. Once the media solidifies, the plates are
placed at room temperature for a few minutes to re-
move any moisture present on the plates before use.
Then, different bacteria samples are added to dif-
ferent watch plates (Abdalwahab et al., 2017). The
bacteria strands were put in the agar solution, allow-
ing it to grow and replicate for one day. Then, the
samples are collected from the petri dish and cen-
trifuged for 3 minutes with 5000 spin. After that, the
samples were transferred to a new container with 1
ml of sterilized water (Topi
´
c Popovi
´
c et al., 2023).
The manipulation of bacteria started by taking a drop
of the bacteria sample and placed on the electrodes.
The electrodes are ITO on a glass substrate with a
width and electrode gap of 100 and 50 µm, respec-
tively. The electrodes are connected to a function
generator to supply an AC signal with controlled am-
plitude (1, 5, and 10 V) and frequencies (0.6, 0.8,
1 MHz). The electrodes were placed under a mi-
croscope (ZIESS AX10) and connected to a com-
BIODEVICES 2025 - 18th International Conference on Biomedical Electronics and Devices
144
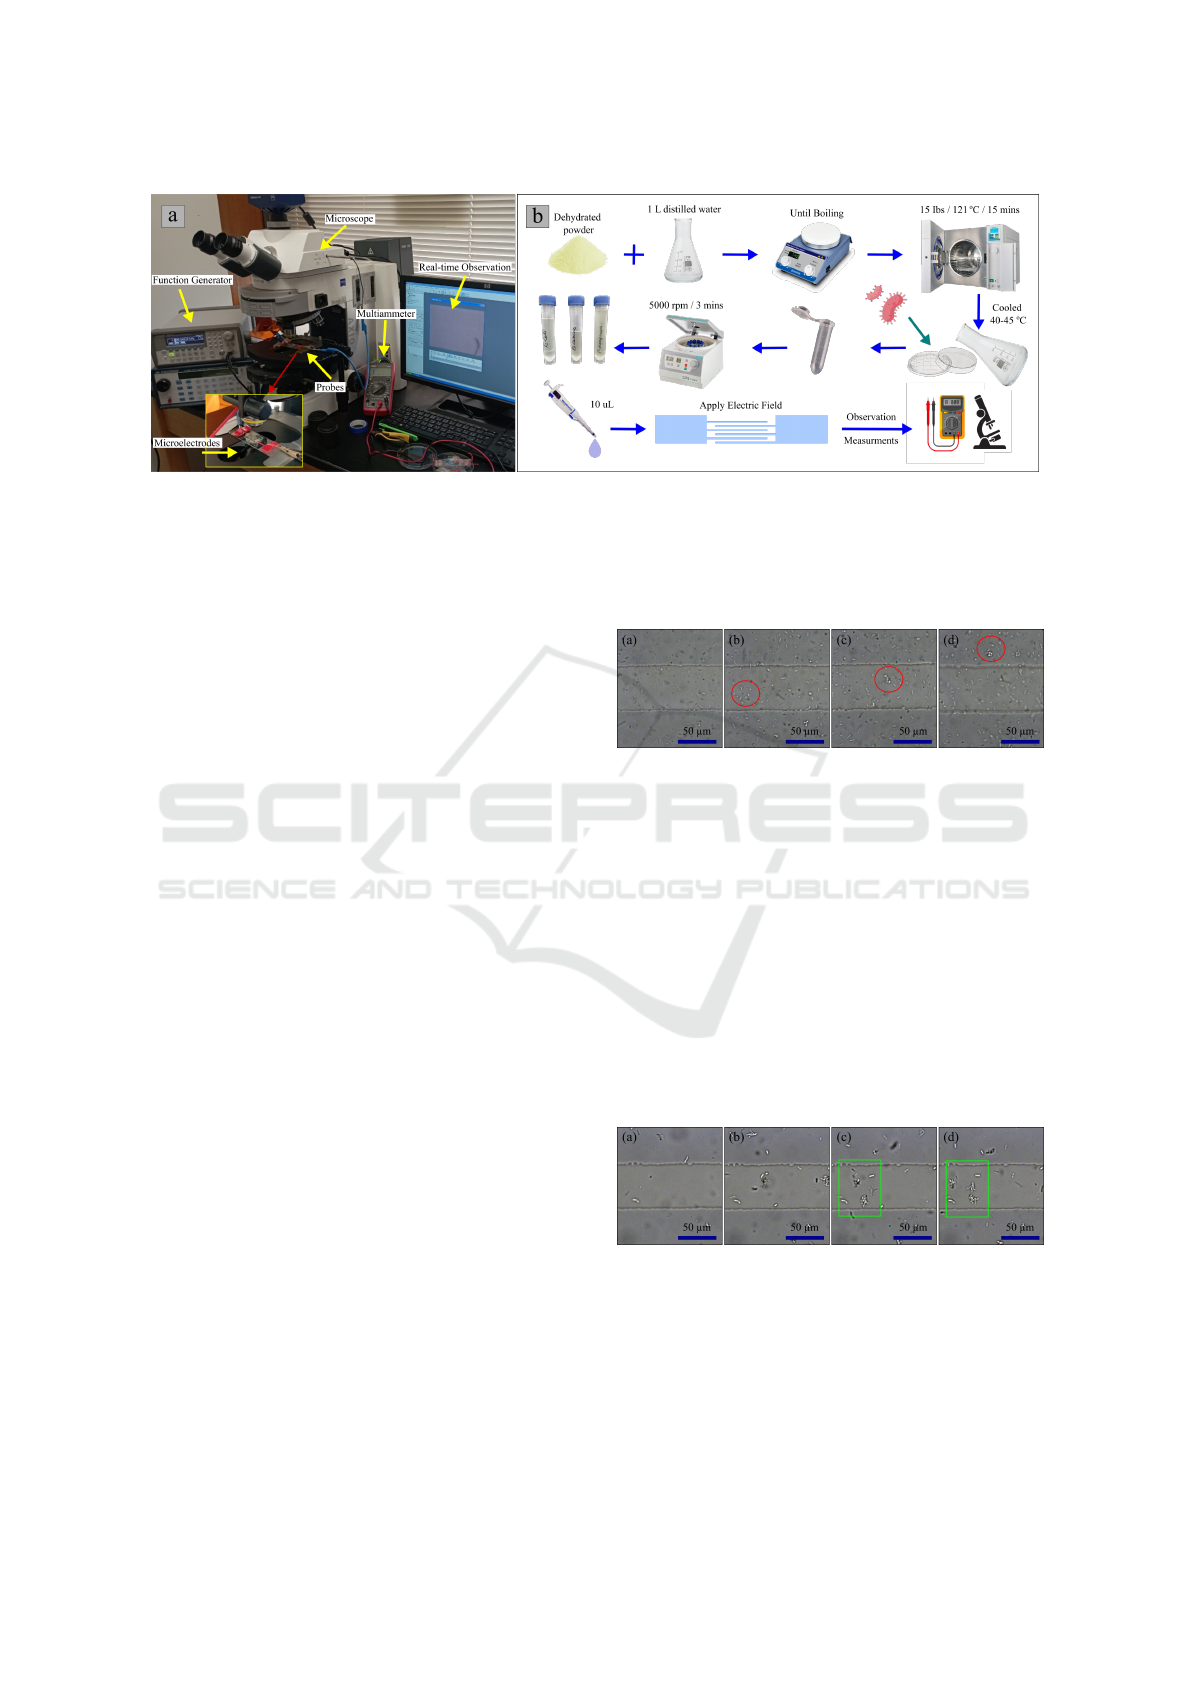
Figure 1: The methodology used in this work. (a) Experimental setup, (b) Steps of sample preparation and electrical charac-
terization.
puter to visualize the real-time movement by ZEN
Microscopy Software. The above-detailed methods
are applied to Escherichia coli, Bacillus cereus, and
Pseudomonas aeruginosa. The movement of bacteria
at different electric fields is recorded and compared
with their behaviour at no electric field. Further, the
resistance of the bacteria sample is measured before
and after applying the electric field using a multiame-
ter.
3 RESULTS AND DISCUSSION
This section first discusses the behavior of a single
type of bacteria under an electric field with different
intensities. Then, the change in the bacteria resistance
before and after applying the electric field is recorded
and discussed in sub-section 3.2. Finally, sub-section
3.1 addresses the behavior of multiple bacteria types
under different frequencies. The bacteria Escherichia
coli, Bacillus cereus, and Pseudomonas aeruginosa
were visualized and monitored under the microscope.
3.1 Single Bacteria Manipulation
Figure 2 shows the behavior of Escherichia coli at dif-
ferent electric field intensities and a fixed frequency
of 1 MHz. First, as a reference, Figure 2a shows the
distribution of Escherichia coli cells before applying
the electric field. The bacteria started to move toward
the electrode gap at a relatively slow speed when the
electric field turned on using an AC signal with an
amplitude of 1 V, as shown in Figure 2b. The bacteria
motion became faster when the voltage increased to
5 and 10 V, as shown in Figure 2c and d. It is worth
mentioning that this motion is a combination of verti-
cal and horizontal motion as some bacteria cells were
attracted from different heights above the electrodes,
which explains the increase in the cell number com-
pared to the number of cells at 0 V. A shaking move-
ment in all directions of Escherichia coli was also de-
tected as the voltage increased.
Figure 2: The electric response of Escherichia coli. (a) No
signal applied, (b) 1 V, (c) 5 V, and (d) 10 V AC signal ap-
plied across the electrodes with fixed frequency of 1 MHz.
Figure 3a shows the behavior of Bacillus cereus
before applying the electric field. At a signal of 1 V
and 1 MHz, Bacillus cereus started to trap within the
gap and above the electrode surface, as shown in Fig-
ure 3b. Bacillus cereus showed the most rapid move-
ment in all strands, which was relatively higher than
Escherichia coli and Pseudomonas aeruginosa. The
number of trapped Bacillus cereus cells (see the green
boxes) increases as the voltage increases, as shown in
Figure 3c and d. The shivering movement in Bacillus
cereus was less than it was in Escherichia coli as the
speed difference indicates its active state.
Figure 3: The electric response of Bacillus cereus. (a) No
signal applied, (b) 1 V, (c) 5 V, and (d) 10 V AC signal ap-
plied across the electrodes with fixed frequency of 1 MHz.
Figure 4a shows a reference picture of Pseu-
domonas aeruginosa before applying the electric
field. No changes were observed when applying an
electric field of 1 V and 1 MHz, as shown in Figure
4b. A small number of bacteria cells (see the yellow
Electrical Response of Bacteria Cells in Water as Detection Mechanism
145
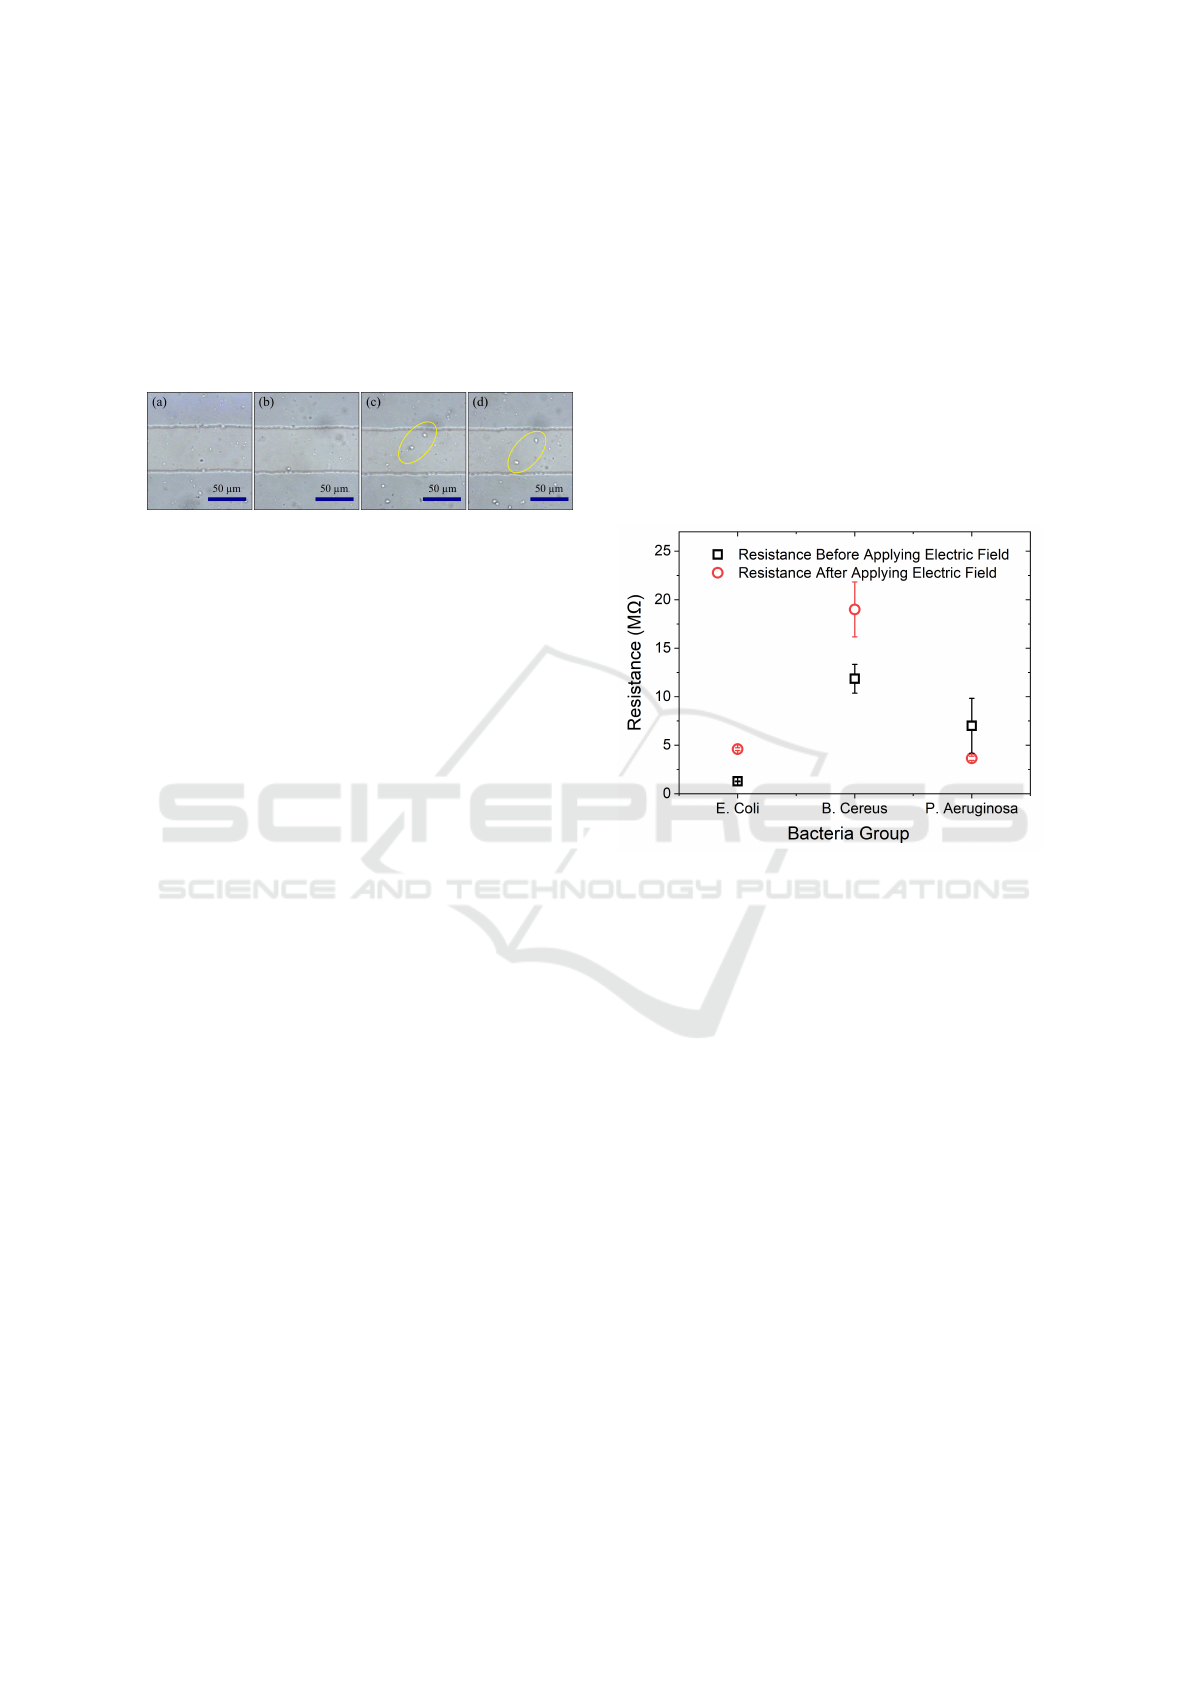
ovals) were observed at the electrode gap when the
signal amplitude increased to 5 and 10 V, as shown
in Figure 4c and d. In general, Pseudomonas aerugi-
nosa was relatively slow compared to Bacillus cereus.
The shivering movement in Pseudomonas aeruginosa
was similar to that in Escherichia coli, indicating they
share similar characteristics and behavior compared
to Bacillus cereus.
Figure 4: The electric response of Pseudomonas aerugi-
nosa. (a) No signal applied, (b) 1 V, (c) 5 V, and (d) 10
V AC signal applied across the electrodes with fixed fre-
quency of 1 MHz.
In conclusion, the difference in the behavior of
the bacteria under electric fields is due to their cellu-
lar structure, which is confirmed using gram-positive
and gram-negative tests. Pseudomonas aeruginosa is
gram-negative with two thin peptidoglycan layer bac-
teria with rod-shaped structure (Diggle and White-
ley, 2020). Escherichia coli has almost similar size
and length, and it is also gram-negative, explaining
the similar behavior of these two bacteria (Tenail-
lon et al., 2010). On the other hand, Bacillus cereus
is a gram-positive bacteria with a rod-shaped struc-
ture that varies in length from 3.0 - 5.0 µm. Bacil-
lus cereus is bigger in size than Escherichia coli and
Pseudomonas aeruginosa and has one thick peptido-
glycan layer, explaining their strong response to the
electric field (Logan and Vos, 2015).
3.2 Resistance Measurements
Measuring the resistance of the bacteria samples be-
fore and after applying the electric field was per-
formed using a digital multimeter by connecting its
probes with the electrode pads. This gives an indica-
tion of what happened during the application of the
electric field. Figure 5 represents the average resis-
tance of the bacteria samples before (black curve) and
after (red curve) applying the electric field. The mea-
surements were repeated 3 times after applying an AC
signal with amplitudes of 10 V and frequency of 1
MHz applied for 1-2 minutes at similar conditions in
the same electrode slide. In general, the difference
in the resistance measurements in the bacteria sam-
ples before applying the electric field could be due to
the size of the bacteria, the type in which it is gram-
positive or gram-negative, the bacteria diameter and
shape, and the conductivity of the medium. Bacil-
lus cereus showed the highest resistance because of
its larger size compared to Escherichia coli and Pseu-
domonas aeruginosa. Further, Bacillus cereus is con-
sidered to be a gram-positive bacteria with a thicker
peptidoglycan layer, which explains the increase in
the resistance of the bacteria. Both Escherichia coli
and Pseudomonas aeruginosa have lower resistance
values than Bacillus cereus as they are both gram-
negative bacteria. Pseudomonas aeruginosa is the
smallest strand in size, which is why it has the low-
est resistance values. The change in the resistance af-
ter applying the electric field is because bacteria cells
moved toward the electrodes and obstructed the cur-
rent flow across the electrodes.
Figure 5: The resistance measurements of the studied bac-
teria before and after applying the electric field of 10 V and
frequency of 1 MHz.
3.3 Multi Bacteria Manipulation
Escherichia coli and Bacillus cereus were mixed in
the same medium with a volume of 5 µl each. The
bacteria were observed under the microscope at dif-
ferent frequencies. It can be noticed that the bacteria
cells have a rod shape with significant differences in
their size. Figure 6a shows the case before applying
the electric field where a semi-uniform distribution of
the bacteria cell within the medium. In Figure 6b,
the electric field was applied at a frequency of 1 MHz
to the sample, and the change occurred as a shiver-
ing movement of both bacteria when they were in the
electrode path. After some time, the bacteria started
to become stable again before switching off the elec-
tric field. As the frequency decreased to 800 kHz, the
bacteria showed stronger movement and shivering, as
shown in Figure 6c. Also, it can be noticed here that
the upper and middle parts of the electrode became
darker, which indicates that a small number of E. Coli
bacteria were trapped on the electrode surface. At 600
BIODEVICES 2025 - 18th International Conference on Biomedical Electronics and Devices
146
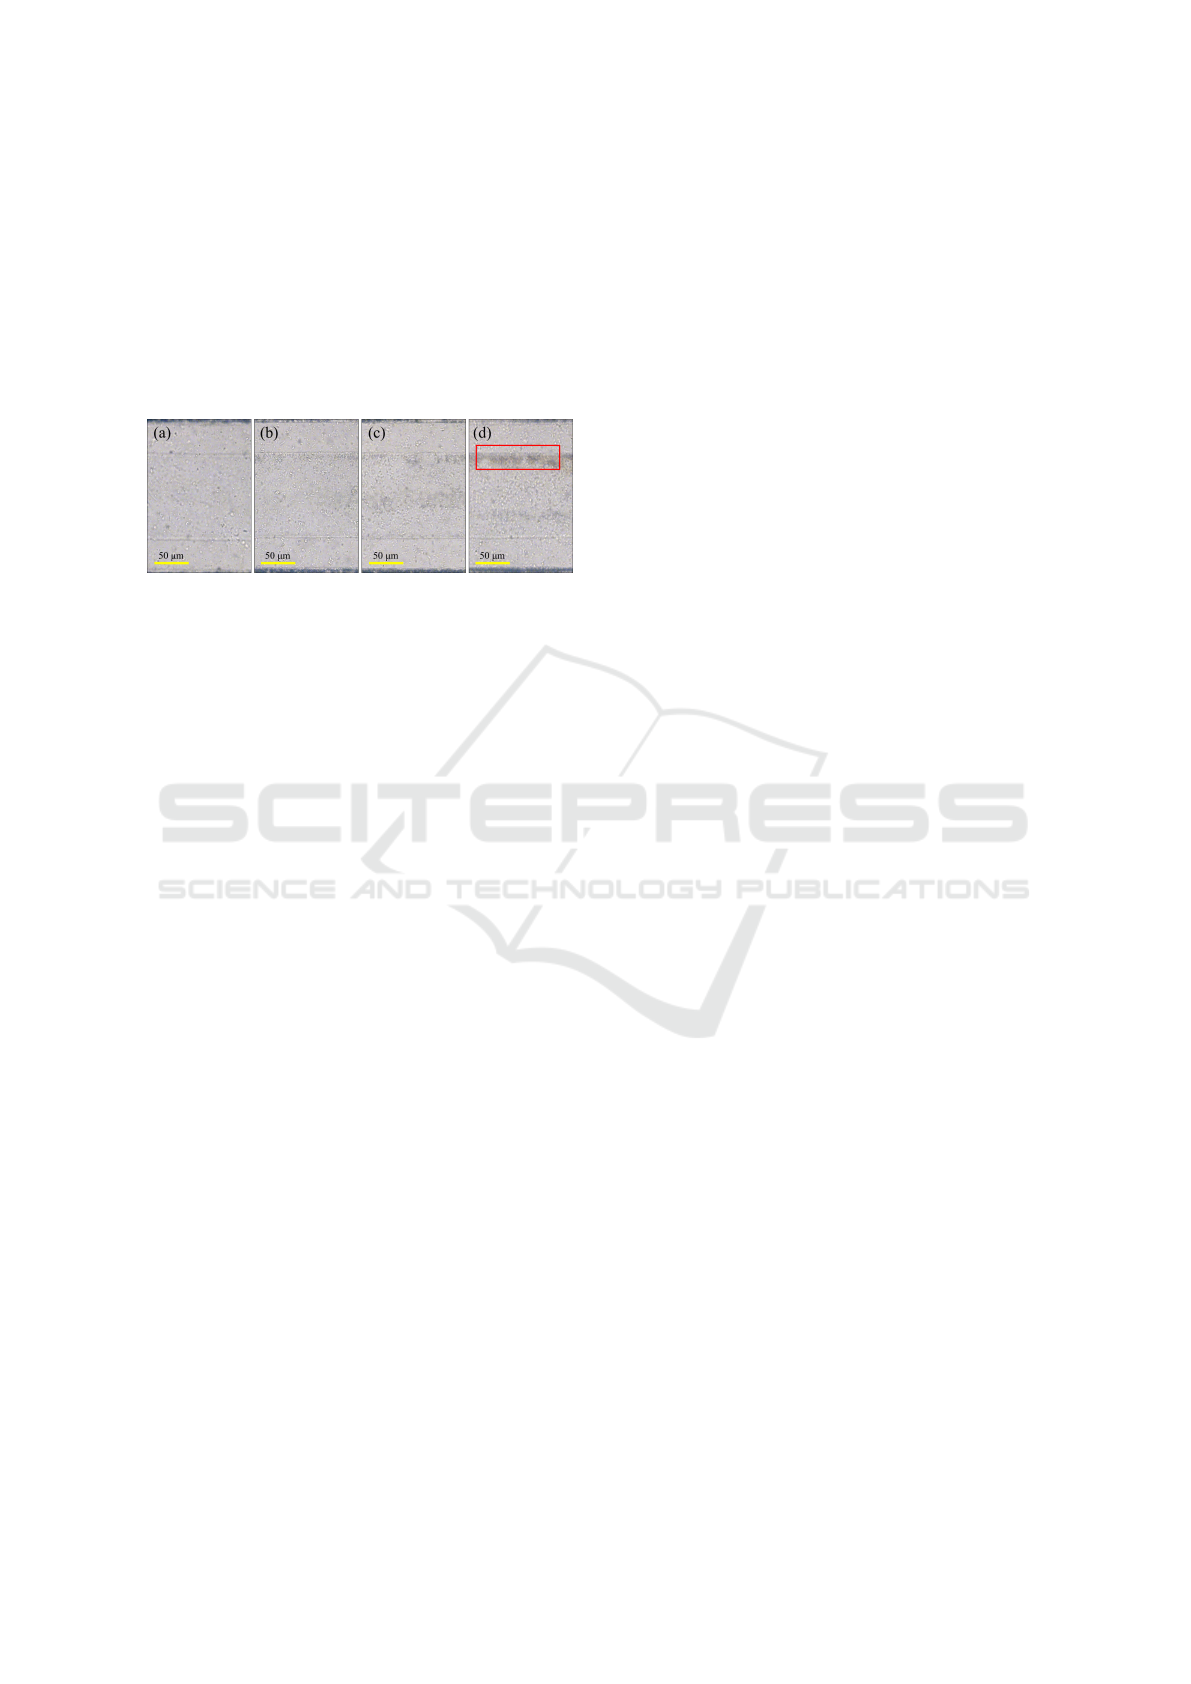
kHz, more E.coli bacteria are trapped on the electrode
surface, as shown in Figure 6d. The dark area (as
shown in the red box) indicated more cell trapping
as a function of time and frequency. It can noticed
from the shape of the bacteria that the trapped cells
are E.coli, and what remained in the medium is Bacil-
lus cereus. In conclusion, the isolation of E. Coli,
trapping, and shivering of bacteria on the electrodes
increases with the decrease in frequency.
Figure 6: The electric response of a mixture of Escherichia
coli and Pseudomonas aeruginos. (a) No signal applied, (b)
1 MHz, (c) 0.8 MHz, and (d) 0.6 MHz with fixed 10 V AC
signal applied across the microelectrodes.
4 CONCLUSIONS
The detection of bacteria in drinking water is con-
sidered a critical need to prevent widespread bacte-
rial infection. Recent studies showed that bacteria
such as Escherichia coli and Pseudomonas aerugi-
nosa are present in drinking water sources at high
percentages in several regions in Saudi Arabia. So
far, the detection of these bacteria has been investi-
gated using common biochemical tests and machine
analysis, which is costly and requires a long time for
the result. In this study, we investigated the electri-
cal response of three different bacteria as a sensing
mechanism. The bacteria’s electric characteristics are
affected by their length, diameter, and cell wall type.
Through visualization of the bacteria under a micro-
scope, the movement of bacteria at different voltages
and frequencies was investigated. The difference in
the behavior of the bacteria under electric fields was
due to their cellular structure, which is confirmed us-
ing gram-positive and gram-negative tests. The elec-
trical characterization in terms of the resistance was
measured before and after the application of electric
fields for all bacteria samples in this study.
ACKNOWLEDGEMENTS
The authors would like to acknowledge the support
received by the Center for Communication Systems
and Sensing and the Deanship for Student Affairs
through the (Uxplore) program Program offered by
the Undergraduate Research Office (URO) at King
Fahd University of Petroleum & Minerals.
REFERENCES
Abada, E., Al-Fifi, Z., Al-Rajab, A. J., Mahdhi, M., and
Sharma, M. (2019). Molecular identification of bi-
ological contaminants in different drinking water re-
sources of the jazan region, saudi arabia. Journal of
Water and Health, 17(4):622–632.
Abdalwahab, S. A., Dawood, E. S., and Abouhosh, M. A.
(2017). Evaluation of microbial or bacterial quality of
the drinking water of duba province north saudi ara-
bia. Asian Journal of Agriculture and Food Sciences,
5(1).
Al-Turk, I. M. and Diab, A. M. (2009). Bacterio-
logical drinking water potability at al-madinah al-
mounwwarah in relation to plasmid-linked multidrug-
resistance. Journal of International Environmental
Application & Science, 4(2):214–230.
Alaidarous, M., Alanazi, M., and Abdel-Hadi, A. (2017).
Isolation, identification, and antimicrobial susceptibil-
ity of bacteria associated with waterpipe contaminants
in selected area of saudi arabia. BioMed Research In-
ternational, 2017(1):8042603.
Alawi, M., Smyth, C., Drissner, D., Zimmerer, A., Leupold,
D., M
¨
uller, D., Do, T. T., Velasco-Torrijos, T., and
Walsh, F. (2024). Private and well drinking water are
reservoirs for antimicrobial resistant bacteria. npj An-
timicrobials and Resistance, 2(1):7.
Alqahtani, J. M., Asaad, A. M., Ahmed, E. M., and Qureshi,
M. A. (2015). Drinking water quality and public
health in southwestern saudi arabia: The need for a
national monitoring program. Journal of Family and
Community Medicine, 22(1):19–24.
Alshammari, A. S., Sulieman, A. M. E., Veettil, V. N., and
Abdelmuhsin, A. A. (2016). Bacteriological quality of
drinking water sources of hail, saudi arabia. Advances
in Life Sciences, 6(3):49–53.
Bartholomew, J. W. and Mittwer, T. (1952). The gram stain.
Bacteriological Reviews, 16(1):1–29.
Chen, J., Zhong, J., Chang, Y., Zhou, Y., Koo, S. H.,
Tan, T. Y., Lei, H., and Ai, Y. (2024). Rapid
and accurate antimicrobial susceptibility testing us-
ing label-free electrical impedance-based microfluidic
platform. Small, 20(6):2303352.
Coico, R. (2006). Gram staining. Current Protocols in Mi-
crobiology, (1):A–3C.
Diggle, S. P. and Whiteley, M. (2020). Microbe profile:
Pseudomonas aeruginosa: Opportunistic pathogen
and lab rat. Microbiology, 166(1):30–33.
Eid, N. H., Al Doghaither, H. A., Kumosani, T. A., and
Gull, M. (2017). Diversity, physiochemical and phy-
logenetic analyses of bacteria isolated from various
drinking water sources. Pakistan Journal of Medical
Sciences, 33(3):703.
Electrical Response of Bacteria Cells in Water as Detection Mechanism
147

Logan, N. A. and Vos, P. D. (2015). Bacillus. Bergey’s
Manual of Systematics of Archaea and Bacteria, pages
1–163.
Okafor, C. O., Ude, U. I., Okoh, F. N., and Eromonsele,
B. O. (2024). Safe drinking water: The need and chal-
lenges in developing countries. In Water Quality—
New Perspectives. IntechOpen.
Omer, E., Algamidi, A., Algamidi, I., Fadlelmula, A., and
Alsubaie, A. S. R. (2014). The hygienic-related mi-
crobiological quality of drinking water sources al-
baha province, kingdom of saudi arabia. Journal of
Health Specialties, 2(2):68.
Qian, C., Huang, H., Chen, L., Li, X., Ge, Z., Chen, T.,
Yang, Z., and Sun, L. (2014). Dielectrophoresis for
bioparticle manipulation. International Journal of
Molecular Sciences, 15(10):18281–18309.
Rahim, M. K. A., Buyong, M. R., Jamaludin, N. M. A.,
Hamzah, A. A., Siow, K. S., and Majlis, B. Y. (2018).
Characterization of permittivity and conductivity for
eskape pathogens detection. In 2018 IEEE Inter-
national Conference on Semiconductor Electronics
(ICSE), pages 132–135. IEEE.
Tenaillon, O., Skurnik, D., Picard, B., and Denamur,
E. (2010). The population genetics of commen-
sal escherichia coli. Nature Reviews Microbiology,
8(3):207–217.
Topi
´
c Popovi
´
c, N., Kazazi
´
c, S. P., Bojani
´
c, K., Strunjak-
Perovi
´
c, I., and
ˇ
Co
ˇ
z-Rakovac, R. (2023). Sample
preparation and culture condition effects on maldi-tof
ms identification of bacteria: A review. Mass Spec-
trometry Reviews, 42(5):1589–1603.
Ware, J. P., Shea, D. K., Nicholas, S. L., Stimson, E. A.,
Riesterer, J. L., and Ibsen, S. D. (2024). Recovery and
analysis of bacterial membrane vesicle nanoparticles
from human plasma using dielectrophoresis. Biosen-
sors, 14(10):456.
Weber, R. E., Petkowski, J. J., Michaels, B., Wisniewski,
K., Piela, A., Antoszczyk, S., and Weber, M. U.
(2021). Fluid-screen as a real time dielectrophoretic
method for universal microbial capture. Scientific Re-
ports, 11(1):22222.
BIODEVICES 2025 - 18th International Conference on Biomedical Electronics and Devices
148
