
Trends in Drug Prescriptions in the Outpatient Physician Sector in a
German Federal State from 2014 to 2023 Using Morbidity Related
Groups, Correlations and Partial Correlations
Mareike Burmester
1,5
, Timo Emcke
2
, Vera Ries
3
, Klaus-Peter Thiele
3
, Bernhard van Treeck
4
and Reinhard Schuster
1,5
1
Medical Advisory Board of Statutory Health Insurance in Northern Germany (MD Nord), 23554 L
¨
ubeck, Germany
2
Association of Statutory Health Insurance Physicians (KVSH), 23795 Bad Segeberg, Germany
3
Medical Advisory Service Institution of the Statutory Health Insurance in North Rhine (MD Nordrhein), 40212 D
¨
usseldorf,
Germany
4
Federal Joint Committee (G-BA), 10587 Berlin, Germany
5
Institute of Mathematics, University of L
¨
ubeck, 23562 L
¨
ubeck, Germany
Keywords:
ATC Code, Big Data, Morbidity Related Groups, Correlations and Partial Correlations.
Abstract:
The pharmaceutical prescription data of all SHI-insured persons in a German federal state are analysed over a
period of 10 years. With the help of the International ATC Code, each patient is assigned a Morbidity Related
Group (MRG) as the active substance group with the highest costs per year. The leading MRG positions
per age are compared between 2019 as the current year before the coronavirus pandemic and 2023 after
the coronavirus pandemic. Between the ages of 23 and 31, treatment with antidepressants has come to the
fore. Beta-lactam antibacterials and penicillins dominate in early childhood in both years and antithrombotics
agents in old age. The correlations between age, polypharmacy and cost percentiles are examined in pairs or
as a whole with correlations and partial correlations. All partial correlations of the three variables are greater
than the correlations.
1 INTRODUCTION
The costs associated with drugs prescribed by SHI
physicians represent a significant financial burden
within the context of statutory health insurance (SHI)
in Germany, ranking as the second or third largest
expenditure category in many regions. In the Ger-
man state of Schleswig-Holstein, the cost of pharma-
ceuticals has risen from 1.0 billion euros in 2014 to
1.7 billion euros in 2023. The following analysis is
based on all data associated with doctor’s prescrip-
tions to SHI patients. It should be noted that over-the-
counter medicines are not included in this analysis,
as no patient-related data exists for these in general.
Additionally, the approximately ten percent of pri-
vately insured patients were excluded from the analy-
ses. These calculations fall within the domain of big
data, given the number of prescriptions, which range
from 7.0 to 8.3 million per year.
In this paper, the focus should be on the patient,
irrespective of which medical practitioner issued the
prescription. This is a significant difference to doctor-
centred cost-effectiveness analyses. The number of
patients included in the analyses varies from year to
year, with figures ranging from 1.5 to 1.7 million. The
top one percent of expensive patients account for 39-
42% of pharmaceutical expenditure, with an annual
expenditure of EUR 5,400 in 2014 and rising to EUR
12,100 in 2023. The objective of this paper is not to
examine the cost structure and developments in the
one per cent of patients with the highest costs; rather,
it is to investigate the correlations and developments
in the 99 per cent of patients who account for the ma-
jority of prescriptions.
We use the five-level international ATC code
(Anatomical-Therapeutic-Chemical) introduced by
the WHO with specifications relating to the German
authorisation law for medicinal products. Germany
has the largest number of authorised medicinal prod-
ucts in the European Union and globally. In Germany,
96
Burmester, M., Emcke, T., Ries, V., Thiele, K.-P., van Treeck, B. and Schuster, R.
Trends in Drug Prescriptions in the Outpatient Physician Sector in a German Federal State from 2014 to 2023 Using Morbidity Related Groups, Correlations and Partial Correlations.
DOI: 10.5220/0013149200003911
Paper published under CC license (CC BY-NC-ND 4.0)
In Proceedings of the 18th International Joint Conference on Biomedical Engineering Systems and Technologies (BIOSTEC 2025) - Volume 2: HEALTHINF, pages 96-104
ISBN: 978-989-758-731-3; ISSN: 2184-4305
Proceedings Copyright © 2025 by SCITEPRESS – Science and Technology Publications, Lda.

medicinal products are identified by a pharmaceuti-
cal central number (PZN). Extensive pharmacologi-
cal information is available in databases based on this
PZN. To illustrate, data regarding the active ingredi-
ents, their pharmaceutical forms, and dosages is ac-
cessible at a more granular level than that obtained
from the ATC code. The prescriptions of multiple ac-
tive substances for a single patient are represented by
the number of ATC codes at the third level (see ex-
amples below), which are classified as ATC four-digit
codes, cf. (Johnell and Klarin, 2007), (Fricke et al.,
2019). The number of active substances is considered
as a measure of polypharmacy, although this is not
contingent on a specific number. This is connected
to the concept of performance auditing as outlined in
the MRG (Morbidity Related Groups) framework (re-
fer to (Schuster et al., 2016), (Schuster et al., 2018)
and (Schuster et al., 2016)). With regard to the 10-
year analysis, the simultaneity considerations relate
appropriately to one year at a time. It is not feasible
to conduct a longer analysis than 10 years using the
original data due to the constraints imposed by data
protection regulations. Similarly to the DRG (Diag-
nosis Related Group) within the hospital sector, the
MRG drug group (ATC four-digit) with the highest
costs is used as an annualised patient characteristic.
In general, the higher the age, the higher the
polypharmacy and the cost percentile. Deviating from
this, particularly high costs in the oncological field are
found in middle age, for example, but these gener-
ally affect the most expensive one per cent of patients
and only have a minor impact on the overall view, see
(Case and Deaton, 2017), (High, 2004), (Turrentine
et al., 2006), (Brennan and Clare, 1980), (Koh et al.,
2005), (Delara et al., 2022), (Golchin et al., 2015) and
(Weng et al., 2020). The MRG considerations illus-
trate the circumstances under which particular con-
siderations are beneficial for specific patient groups.
However, this is beyond the scope of the present pa-
per. The correlations resulting from the three parame-
ters listed and the partial correlations determined with
them show that classical interpretations reach their
limits in this respect. Furthermore inverse formulae
are provided for calculating the correlations from the
partial correlations. These results stem from a rela-
tionship to spherical trigonometry, which gives rise to
a sine theorem of statistics. The relationship to the
corona pandemic is discussed in some places.
2 MATERIALS AND METHODS
The objective of this study is to analyse drug prescrip-
tion data on all patients with statutory health insur-
ance in the period from 2014 to 2023 for treatments
of patients of SHI-doctors from Schleswig-Holstein.
The data set includes a patient identifier, the patient’s
year of birth, and the year in which the prescription
was issued. With the exception of minor fluctuations
throughout the year, this information serves to de-
termine the patient’s age. The pharmacological data
is derived from the central pharmaceutical number
(PZN) using information from the database.
The flow of data in Germany has historically been
characterised by media discontinuities. Following a
protracted period of postponement, a comprehensive
electronic transmission is presently undergoing devel-
opment. The biggest media disruption is the scan-
ning of a paper prescription in the pharmacy data cen-
tres. Errors pertaining to the patient ID, the doctor ID
(which is not directly utilised in our analyses, but is
nevertheless pertinent to the allocation to the federal
state), the patient’s date of birth and the PZN have the
potential to impact the evaluations. While these errors
can be rectified to a certain extent within the partici-
pating institutions, the extent of this rectification is
limited.
The ATC classification is an official system for
categorising pharmacological agents according to the
organ or organ system they affect and according
to their chemical, pharmacological and therapeutic
properties, cf. (R
¨
ubenach et al., 2021). Since 2004,
the BfArM institution has published the official ver-
sion of the ATC classification annually on behalf of
the Federal Ministry of Health in accordance with
Section 73 (8) of the Fifth Book of the German Social
Code (SGB V), see (Bundesinstitut f
¨
ur Arzneimit-
tel und Medizinprodukte (BfArM), 2021). In accor-
dance with Section 73 (8) of the German Social Code
(SGB V), the ATC classification is to be adapted to
the specific features of the healthcare situation in Ger-
many as required. The official ATC classification is
an adaptation of the WHO ATC classification, tai-
lored to the specific requirements of the German phar-
maceutical market. The following example in table
1 illustrates the aforementioned concept with refer-
ence to the most frequently prescribed active sub-
stance in Schleswig in 2023, which bears the ATC
code N02BB02:
It should be noted that the ATC system does not
adhere to a consistent classification structure, with
the levels anatomical, therapeutic and chemical being
used in a non-uniform manner.
The Morbidity Related Group (MRG) per patient
and analysis period (in this paper across all doctors, in
other analyses per doctor) represents the drug group at
the Anatomical Therapeutic Chemicals (ATC) level
(third level) - in the example N02B - with the high-
Trends in Drug Prescriptions in the Outpatient Physician Sector in a German Federal State from 2014 to 2023 Using Morbidity Related
Groups, Correlations and Partial Correlations
97

Table 1: The five levels of the ATC code with their corre-
sponding ATC classification.
code different ATC levels classification
N02BB02 Metamizole sodium chemical
N02BB Pyrazolones chemical
N02B Other analgestics therapeutic
and antipyretics
N02 Analgetrics therapeutic
N Nervous system anatomical
est costs. Consequently, a single ’main medication’ is
identified for each patient and period, which serves
to displace less significant medications in terms of
their assigned label, cf. (Schuster et al., 2016) Sub-
sequently, the total costs are allocated to the afore-
mentioned MRG. Furthermore, the analyses calculate
the number of these ATC four-digit drugs as a char-
acteristic of polypharmacy, the proportion of costs at-
tributable to the label, and the percentile of the pa-
tient’s costs in a year-on-year comparison.
From a methodological standpoint, alternative
metric scales could be employed in lieu of the cost
per PZN.
We define the partial correlations from the corre-
lations ρ
12
, ρ
13
and ρ
23
of the random variables X
1
, X
2
and X
3
with values from the intervall (−1, 1) in a gen-
eral way (see (Kim, 2015) and (Brief et al., 1988)) by:
ρ
12,3
=
ρ
12
− ρ
23
ρ
13
q
1 − ρ
2
23
q
1 − ρ
2
13
ρ
13,2
=
ρ
13
− ρ
12
ρ
23
q
1 − ρ
2
12
q
1 − ρ
2
23
(1)
ρ
23,1
=
ρ
23
− ρ
12
ρ
13
q
1 − ρ
2
12
q
1 − ρ
2
13
The exclusion of interval limits ±1 is intended to ex-
clude singularities. Moreover, we define
m =
1 − ρ
2
12,3
1 − ρ
12
.
By inserting the definition of the partial correlation, a
short transformation yields the following result:
m =
1 − ρ
2
23
− ρ
2
13
− ρ
2
12
+ 2ρ
12
ρ
13
ρ
23
(1 − ρ
2
12
)(1 − ρ
2
13
)(1 − ρ
2
23
)
(2)
Due to the symmetry of this expression, the following
can be inferred
m =
1 − ρ
2
12,3
1 − ρ
2
12
=
1 − ρ
2
13,2
1 − ρ
2
13
=
1 − ρ
2
23,1
1 − ρ
2
23
. (3)
In the three-dimensional space of correlations within
the specified intervals, we consider the boundary sur-
faces with partial correlation, with an absolute value
Figure 1: The yellow and blue levels indicate all values of
the correlation for which the absolute value of the partial
correlation is equal to one.
of 1, using the Mathematica software from Wolfram
Research.
The solution of the quadratic equation is derived
from the upper and lower boundary surfaces, and once
more, the symmetry with regard to the three variables
is evident. The boundary surface delineates a parti-
tion of the three-dimensional space, wherein the inner
area is characterised by partial correlations that are all
less than the correlations, while the outer area is dis-
tinguished by partial correlations that are all greater
than the correlations. In the event that the absolute
value of the partial correlations is not equal to 1, the
inverse formulae apply:
ρ
12
=
ρ
12,3
+ ρ
23,1
ρ
13,2
q
(1 − ρ
2
23,1
)(1 − ρ
2
13,2
)
ρ
13
=
ρ
13,2
+ ρ
23,1
ρ
12,3
q
(1 − ρ
2
23,1
)(1 − ρ
2
12,3
)
(4)
ρ
23
=
ρ
23,1
+ ρ
12,3
ρ
13,2
q
(1 − ρ
2
12,3
)(1 − ρ
2
13,2
)
Upon inserting the definition (1) into (4) and employ-
ing the symmetry (2), an identity is yielded after a
brief calculation. The inverse conclusion then serves
to substantiate the proof of (4). Given that the abso-
lute value of the partial correlations is either greater
than or less than 1, it can be concluded that the con-
tents of the roots in the denominator in (4) are al-
ways positive. The assertion made in the literature
that the absolute values of the partial correlations and
the correlations are always less than 1 is not correct.
One could argue that not all values in the correla-
tion space under consideration can arise from random
variables. This is also not true. m > 1 is equal to
1 − ρ
2
12,3
> 1 − ρ
2
12
and ρ
2
12
> ρ
2
12,3
. Analogue for
m < 1. As a consequence of the aforementioned sym-
metry, this conclusion also applies to all other correla-
tions and partial correlations. It can be demonstrated
that all partial correlations are greater or smaller than
the correlation determined by the value of m. This
value m can also be determined from the partial cor-
relations. A quick calculation yields
HEALTHINF 2025 - 18th International Conference on Health Informatics
98
1
m
= ¯m =
1 − ρ
2
23,1
− ρ
2
13,2
− ρ
2
12,3
− ρ
12,3
ρ
23,1
ρ
13,2
(1 − ρ
2
12,3
)(1 − ρ
2
23,1
)(1 − ρ
2
13,2
)
.
(5)
The symmetry of the partial correlations and
the correlations resulting from (3) is also impor-
tant here. The geometric background of correlation
and partial correlations is discussed in the follow-
ing sources: (Jackson, 1924), (Bilin Zeng and Wang,
2017), (Thomas and O’quigley, 1993), (Kendall,
1941), (Irwin, 1965), (Maier and Kiesewetter, 1971)
and (Good, 1992).
3 RESULTS
For each patient, three values are provided as total
numbers per prescription year: age, polypharmacy
(number of active ingredients) according to the four
digit Anatomical Therapeutic Chemical (ATC) classi-
fication system, and cost percentile. Prior to calculat-
ing the correlations and partial correlations between
these three variables, which can be regarded as ran-
dom variables, it is necessary to consider the pairwise
dependencies per year. In order to provide clarity re-
garding the figures presented, the years 2014, 2018,
2020 and 2023 have been selected for analysis. This
approach allows for the investigation of trends and in-
fluences resulting from the coronavirus pandemic. In
each instance, the mean value of a second variable is
examined as a function of a first variable. As a conse-
quence of this asymmetrical process of averaging, the
dependencies in question are typically not reversible.
It is pertinent to examine intervals in which the depen-
dencies are approximately linear, as this allows for the
imposition of suitable restrictions on the correlations
and partial correlations of the three variables. Further-
more, mean values are also obtained for larger devi-
ations from linearity, which are nevertheless relevant.
It is important to note that two-dimensional represen-
tations do not initially account for the frequency of
occurrence of the base variable. This must therefore
be considered at the outset. The averaging process
yields considerably higher coefficients of determina-
tion than the primary data.
The number of patients in figure 2 with drug pre-
scriptions is largely characterised by demographic as-
pects, with significant variations across different age
groups and genders. There has been a notable rise
in the number of individuals within the 45 to 65 age
bracket between 2014 and subsequent years. The
maximum values are determined by the baby boomers
and the pre-war generation, with a significant decline
occurring in 1945.
Zu jedem Paenten sind pro Verordnungsjahr drei Werte als ganze Zahlen gegeben: das Alter, die
Polypharmazie im Sinne der Anzahl der Wirkstoe als ATC-Viersteller und das Kosten-Perzenl. Bevor
Korrelaonen und parelle Korrelaonen zwischen diesen drei Größen, die als Zufallsvariable
betrachtet werden können berechnet werden, sollen paarweise Abhängigkeiten pro Jahr betrachtet
werden. Um es in den Abbildungen übersichtlich zu gestalten, verwenden wir die Jahre 2014, 2018,
2020 und 2013. Dies soll es auch ermöglichen, Trends und Einüssen der Corona-Pandemie zu
betrachten. Dazu wird jeweils der Mielwert einer zweiten Größe in Abhängigkeit von einer ersten
Größe betrachtet. Durch diesen asymmetrischen Prozess der Mielwertbildung sind die
Abhängigkeiten i.A. nicht umkehrbar. Intervalle, in denen die Abhängigkeiten in guter Näherung linear
verlaufen, sind für geeignete Einschränkungen der Korrelaonen und parellen Korrelaon der drei
Größen relevant. Auch bei größeren Abweichungen von der Linearität ergeben sich relevante
Mielwerte. In die zweidimensionalen Darstellungen geht zunächst nicht ein, wie häug die
Basisgröße vorkommt, dies muss daher eingangs betrachtet werden. Durch den Mielungsprozess
ergeben sich wesentlich größere Besmmtheitsmaße als durch die Primärdaten
(altersverteilungen_2014-2023.xlsx)
Die Anzahl der Paenten mit Arzneimielverordnungen ist wesentlich durch demographische
Aspekte geprägt. Im mileren Alter von 45 bis 65 Jahren gibt es eine erhebliche Steigerung von 2014
zu den späteren Jahren. Die Maxima sind durch die Baby-Boomer und die Vorkriegsgeneraon
besmmt mit einem efen Einschni dazwischen im Jahr 1945.
In Abbildung xxx wird die Anzahl der Paenten zu einem Polypharmaziewert angegeben
(poly_number.xlsx):
0
5.000
10.000
15.000
20.000
25.000
30.000
35.000
0 3 6 9 12 15 18 21 24 27 30 33 36 39 42 45 48 51 54 57 60 63 66 69 72 75 78 81 84 87 90 93 96 99
Number of patients
Number of patients with drug prescriptions
Age
2014 2018 2020 2023
Figure 2: Age progression analysed in 2014, 2018, 2020,
2023 for patients taking medication.
Es gibt von 2014 zu 2023 eine leichte Verlagerung zu höhen Fallzahlen bei höheren
Polypharmaziewerten. Der Kurven lassen sich durch Poisson- oder genauer durch
Gammaverteilungen besmmen.
Die altersabhängige milere Polypharmaziewert wird in Abbildung xxx dargestellt
(polypharmacy_2014-2023.xlsx):
Es gibt ein Minimum bei ca. 14 Jahren und ein Maximum bei ca. 93 Jahren, wobei ab ca. 30 Jahren
der Polypharmaziewerte von 2014 zu 2023 nicht nur geringfügig steigt. Außerhalb der Kindheit und
des höheren Alters liegt Monotonie und gewisser Näherung eine Linearität vor. Die fehlende
Monotonie für den gesamten Kurvenbereich mach sich in der Umkehrung vom Polypharmaziewert
zum mileren Alter in Abbildung xxx bemerkbar (poly2alter.xlsx):
0
50.000
100.000
150.000
200.000
250.000
300.000
1 2 3 4 5 6 7 8 9 10 11 12 13 14 15 16 17 18 19 20 21 22 23 24 25 26 27 28 29 30
Patients
Polypharmacy
Number of patients with polypharmacy number
2014 2018 2020 2023
0,0
2,0
4,0
6,0
8,0
10,0
12,0
0 3 6 9 12 15 18 21 24 27 30 33 36 39 42 45 48 51 54 57 60 63 66 69 72 75 78 81 84 87 90 93 96 99
Polypharmacy
Age
Relationship between age and polypharmacy
2014 2018 2020 2023
Figure 3: The number of patients exhibiting a polyphar-
macy value.
In figure 3 there is a slight shift from 2014 to 2023
towards higher case numbers with higher polyphar-
macy values. The curves can be determined using
either Poisson or gamma distributions, the latter of
which is a more precise model.
The figure 4 shows a minimum at about 14 years
of age and a maximum at about 93 years of age.
The polypharmacy value demonstrates a notable in-
crease from 2014 to 2023, rising from approximately
30 years of age. Outside of childhood and old age,
the curve displays a monotony and a certain approx-
imation of linearity. The lack of monotony for the
whole area of the curve is evident in the inversion of
the polypharmacy value with respect to the mean age
in Figure 5.
The presence of a single active ingredient is suffi-
cient to result in an average age of over 40 years, and
Es gibt von 2014 zu 2023 eine leichte Verlagerung zu höhen Fallzahlen bei höheren
Polypharmaziewerten. Der Kurven lassen sich durch Poisson- oder genauer durch
Gammaverteilungen besmmen.
Die altersabhängige milere Polypharmaziewert wird in Abbildung xxx dargestellt
(polypharmacy_2014-2023.xlsx):
Es gibt ein Minimum bei ca. 14 Jahren und ein Maximum bei ca. 93 Jahren, wobei ab ca. 30 Jahren
der Polypharmaziewerte von 2014 zu 2023 nicht nur geringfügig steigt. Außerhalb der Kindheit und
des höheren Alters liegt Monotonie und gewisser Näherung eine Linearität vor. Die fehlende
Monotonie für den gesamten Kurvenbereich mach sich in der Umkehrung vom Polypharmaziewert
zum mileren Alter in Abbildung xxx bemerkbar (poly2alter.xlsx):
0
50.000
100.000
150.000
200.000
250.000
300.000
1 2 3 4 5 6 7 8 9 10 11 12 13 14 15 16 17 18 19 20 21 22 23 24 25 26 27 28 29 30
Patients
Polypharmacy
Number of patients with polypharmacy number
2014 2018 2020 2023
0,0
2,0
4,0
6,0
8,0
10,0
12,0
0 3 6 9 12 15 18 21 24 27 30 33 36 39 42 45 48 51 54 57 60 63 66 69 72 75 78 81 84 87 90 93 96 99
Polypharmacy
Age
Relationship between age and polypharmacy
2014 2018 2020 2023
Figure 4: The age-dependent mean polypharmacy score.
Trends in Drug Prescriptions in the Outpatient Physician Sector in a German Federal State from 2014 to 2023 Using Morbidity Related
Groups, Correlations and Partial Correlations
99
Bereits ein Wirksto führt zu einem mileren Alter von über 40 Jahren, kommt also auch im höheren
Alter nicht selten. Ab 20 Wirkstoen ist ein Sägungswert des Alters erreicht. Von 2014 bis 2023
steigt i.A. das milere Alter zu einem Polypharmaziewert. Umgekehrt verringert sich die Anzahl der in
einem mileren Alter.
Wenn wir die betrachteten Zuordnungen von Alter zu Polypharmazie (in diesem Fall gerundet auf
natürliche Zahlen) und Polypharmazie zu Alter ebenfalls auf natürliche Zahlen gerundet betrachten,
erhalten wir relevante Altersgruppen in Bezug auf die Polypharmazie durch sich ergebende gleiche
Funkonswerte im Jahr 2023: Alter 1, 2-5, 6-9, 10-29, 30-47, 48-59, 60-67, 68-74, 75-80, 81-87, 88-94
und 95-99 Jahre. Eine weitere Iteraon führt zu größeren Intervallen: 1-9, 10-29, 30-74,75-99. Eine
weitere Iteraon führt bereits zu einem konstanten Wert von 52.
Umgekehrt können wir durch durch Hintereinanderausführung der betrachteten Abbildungen in
Bezug auf das Alter relevante Intervall der Polypharmazie nden: 1-3, 4-7, 8-11 und 12-30. Eine
weitere Iteraon führt bereits auf einen gleichen Wert von 5.
Es ist von theoreschem Interesse, bei welchen Ausgangsdaten zyklische Iteraonen möglich sind,
wie es für diskrete Prozesse (durch Rundungen auf natürliche Zahlen) gut bekannt ist. (Literatur
heraussuchen: „cobwebbing“ bei diskreten Verhulst-Prozessen, z.B Murray und RS).
Eine 3D-Darstellung der kombinierten Fallzahlen zwischen Alter und Polypharmazie ist in Abb. Xxx
gegeben:
30
35
40
45
50
55
60
65
70
75
80
1 2 3 4 5 6 7 8 9 10 11 12 13 14 15 16 17 18 19 20 21 22 23 24 25 26 27 28 29 30
Age
Polypharmacy
Relationship between polypharmacy and age
2014 2018 2020
2023
Figure 5: Reversal of the polypharmacy value as a function
of the mean age.
thus it is not uncommon for this to occur at an older
age. A saturation value of age is reached with the ad-
ministration of 20 active ingredients. From 2014 to
2023, the median age generally increases to a value
indicative of polypharmacy. Conversely, the number
of middle-aged patients will decline.
By mapping age to polypharmacy (in this case,
rounded to natural numbers) and polypharmacy to age
(also rounded to natural numbers), we obtain rele-
vant age groups in relation to polypharmacy through
the resulting equal function values in 2023. The age
groups are as follows: 1, 2-5, 6-9, 10-29, 30-47, 48-
59, 60-67, 68-74, 75-80, 81-87, 88-94 and 95-99. A
further iteration of the process results in the forma-
tion of larger intervals, namely 1-9, 10-29, 30-74, and
75-99. It is notable that a single additional iteration
already yields a constant value of 52.
Conversely, the relevant intervals of polyphar-
macy in relation to age can be identified by running
the figures in sequence. The relevant intervals of
polypharmacy can then be identified as follows: 1-3,
4-7, 8-11 and 12-30. A further iteration of the process
yields an equal value of 5.
It is of theoretical interest to determine for which
initial data cyclic iterations are possible, as they are
known for discrete Verhulst equations (cf. (Murray,
2007), (Murray, 2003)).
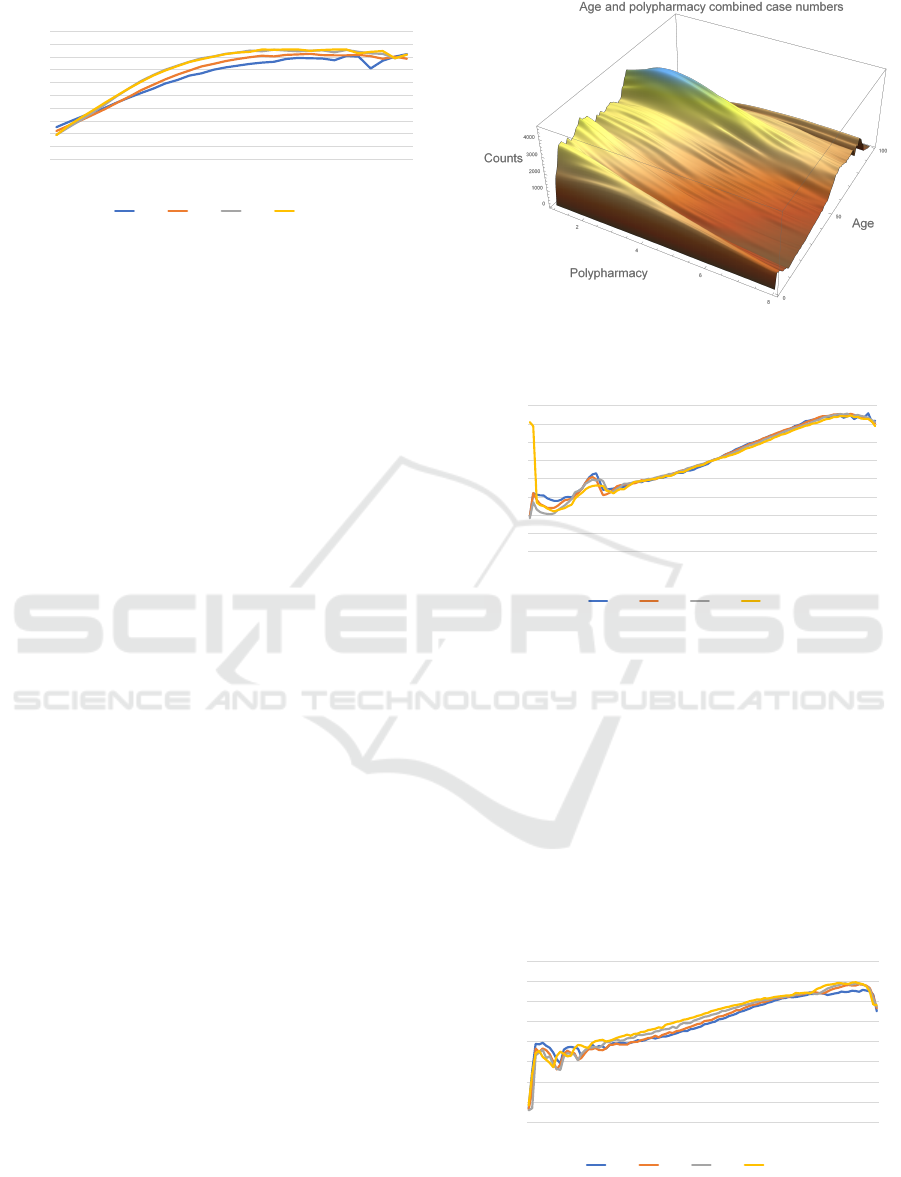
The figure 6 shown above result from the marginal
mean values of the combined case numbers. A com-
parison of years, as in the two-dimensional figures, is
not meaningful in the three-dimensional visualisation.
From the 3D maximum, it seems plausible that 52
years is the iterative limit of the marginal projection.
In the case of polypharmacy, there is a convergence
towards the centre, which in principle could also lead
to a cyclical progression.
Figure 7 shows that the age 0 in 2023 will be due
to a singularity in data technology. With the exception
of the childhood and hunting years, the differences
between the years are minimal. It can be observed
that significant differences from a linear relationship
only exist up to the stages of adolescence and old age.
Figure 6: A 3D representation of the combined case num-
bers between age and polypharmacy.
Die oben betrachteten Abbildungen ergeben sich aus den Rand-Mielwerte kombinierten Fallzahlen.
Ein Vergleich der Jahre wie in den zweidimensionalen Abbildungen ist in der dreidimensionalen
Visualisierung nicht sinnvoll möglich. Aus der Abbildung erscheint es aus dem 3D-Maximum heraus
plausibel, dass 52 Jahre der iterave Grenzwert der Randprojekon ist. Bei der Polypharmazie liegt
eine Konvergenz zur Mie vor, die prinzipiell auch zu einem zyklischen Verlauf führen könnte.
Die Abhängigkeit vom Alter zum Mielwert des Kosten-Perzenls hinsichtlich der Paenten ist in
Abbildung xxx gegeben:
Das Alter 0 im Jahr 2023 wird auf eine datentechnische Singularität zurückzuführen sein. Die
Unterschiede zwischen den Jahren sind bis auf die Kindes- und Jagendzeit gering. Wesentliche
0,0
10,0
20,0
30,0
40,0
50,0
60,0
70,0
80,0
0 3 6 9 12 15 18 21 24 27 30 33 36 39 42 45 48 51 54 57 60 63 66 69 72 75 78 81 84 87 90 93 96 99
Mean value of the cost percentile
Age
Relation between age and mean value of the cost percentile
2014
2018
2020 2023
Figure 7: The dependence of age on the mean value of the
cost percentile with regard to patients.
The maximum value of the mean in relation to the
cost percentile is approximately 75. Conversely, the
relationship between the cost percentile and the mean
age is illustrated in Figure 8.
The curve is simular to the inverse scenario, ex-
hibiting augmented growth at the outset and a mod-
erately diminished saturation value. Furthermore, an
iterative application may prove beneficial in examin-
ing the correlation between age and cost percentile,
where the conversion from age to cost percentile and
Unterschiede von einer linearen Beziehung liegen nur bis zur Jugendzeit und dem höheren Alter vor.
Das Maximum des Mielwertes zum Kostenperzenl liegt bei ca. 75. Umgekehrt wird die
Abhängigkeit vom Kostenperzenl zum Mielwert des Alters in Abbildung xxx dargestellt:
Der Kurvenverlauf ist ähnlich zur umgekehrten Situaon, zu Beginn liegt ein stärkeres Wachstum vor
und der Sägungswert ist etwas niedriger. Auch für den Zusammenhang zwischen Alter und
Kostenperzenl ist eine iterave Anwendung von Interesse, wobei die Umrechnung von Alter zu
Kostenperzenl und zurück langsamer konvergiert. Nach der drien Iteraon ergeben sich die
Altersgruppen 1, 2-15, 16-23, 24, 35-53, 54-72 und 73-99 Jahre. Umgekehrt ergeben sich die
Kostenperzenle 1, 2 ,3 4, 5-9, 10, 11-13, 14-50, 51-64, 65-98 und 99-100.
Eine 3D-Darstellung für das Jahr 2023 ist in Abbildung xxx gegeben: ->import_3d_alter_br_perc.nb
0,0
10,0
20,0
30,0
40,0
50,0
60,0
70,0
80,0
1 5 9 13 17 21 25 29 33 37 41 45 49 53 57 61 65 69 73 77 81 85 89 93 97
Age
Cost percentile
Cost percentile vs. age
2014 2018 2020 2023
Figure 8: The figure illustrates the mean age for the cost
percentiles displayed on the x-axis for the years 2014, 2018,
2020 and 2023.
HEALTHINF 2025 - 18th International Conference on Health Informatics
100

Figure 9: A 3D visualisation for the year 2023.
Man beachte große lokale Variaonen und eine hohe Strukturvielfalt, die in den eben betrachteten
Randdarstellungen durch Gläung weitgehend verloren geht. Bei den Berechnungen der
Korrelaonen und parellen Korrelaonen geht dies in voller Tiefe der Daten ein. Die Fallzahlmaxima
und -minima werden wir in den theoreschen Betrachtungen zu den Korrelaonen und parellen
Korrelaonen wiedernden. Die größere Anzahl relevanter Altersgruppen und Kostenperzenle in der
Iteraon der zweidimensionalen Transformaonen ist vor dem Hintergrund der größeren lokalen
Variaon in Abbildung xxx moviert.
Die Abhängigkeit vom Wert der Polypharmazie zum Mielwert des Kostenperzenls wird in
Abbildung xxx dargestellt (poly2be_perc.xlsx):
Zu beachten ist der durchweg monotone und konvex Kurvenverlauf für alle Jahre. Da Kostenperzenl
zum gegeben Polypharmaziewert nimmt von 2014 bis 2023 leicht ab.
In der Umkehrung vom Kostenperzenl zum Mielwert der Polypharmazie liegt im niedrigen und
höheren Kostensegment keine Monotonie mehr vor, wie in Abbildung xxx dargestellt
(cost_perc2poly.xlsx):
0,0
10,0
20,0
30,0
40,0
50,0
60,0
70,0
80,0
90,0
100,0
1 2 3 4 5 6 7 8 9 10 11 12 13 14 15 16 17 18 19 20 21 22 23 24 25 26 27 28 29 30
Cost percentile
Polypharmacy
From polypharmacy to cost percentile
2014 2018 2020 2023
Figure 10: The relationship between the value of polyphar-
macy and the mean cost percentile.
back converges at a slower rate. Following the third
iteration, the resulting age groups are as follows: 1,
2-15, 16-23, 24, 35-53, 54-72 and 73-99 years. Con-
versely, the cost percentiles are as follows: 1, 2, 3, 4,
5-9, 10, 11-13, 14-50, 51-64, 65-98, and 99-100.
In figure 9 it is important to note the significant
local variations and high structural diversity, which is
largely obscured in the marginal plots that have been
considered thus far due to the smoothing techniques
employed. In calculating the correlations and partial
correlations, this is taken into account in a compre-
hensive manner, reflecting the full depth of the data.
The larger number of relevant age groups and cost
percentiles in the iteration of the two-dimensional
transformations is motivated by the greater local vari-
ation in Figure 9.
It is notable that the curve demonstrates a consis-
tent monotonic and convex pattern across all years.
The cost percentile for the specified polypharmacy
value exhibits a slight decline from 2014 to 2023.
The reversal from a cost percentile to a mean value
of polypharmacy reveals a departure from monotony
in the lower and higher cost segments, as shown in
Figure 11.
The differences between the years are greater in
this direction. For a given cost percentile, the value
of polypharmacy is higher from 2014 to 2023. The
Die Unterschiede zwischen den Jahren ist in dieser Betrachtungsrichtung größer. Zu gegebenem
Kostenperzenl ergibt sich von 2014 bis 2023 ein höherer Wert der Polypharmazie. Das Corona-Jahr
2020 reduziert den allgemeinen Trend leicht. Exemplarisch ist an dieser Stelle die Regressionsgerade
für 2023 eingezeichnet. Verbunden mit dem Mielwert für die abhängige Variable ergibt sich ein
hoher Korrelaonskoezient. Das ist ein übliches Phänomen, wenn mit mileren Ergebnissen
Auswertungen vorgenommen werden.
Die Dreifache Iteraon von den Kosten-Perzenlen zu den Polypharmaziewerten und zurück ergibt
die relevanten Kosten-Intervalle in Bezug auf die Polypharmazie von 1-7, 8-19, 20-57, 58-65, 66-92
und 99-100.
Umgekehrt ergeben sich die relevanten Intervalle von der Polypharmazie zu den Kosten-Perzenlen
und zurück nach dreifacher Iteraon von 1, 2-5, 6, 7-18 und 19-30.
Die 3D-Darstellung der Fallzahlen wird in Abbildung xxx dargestellt:
R² = 0,9303
0
2
4
6
8
10
12
14
16
1
4
7
10
13
16
19
22
25
28
31
34
37
40
43
46
49
52
55
58
61
64
67
70
73
76
79
82
85
88
91
94
97
100
Polypharmacy
Cost percentile
From cost percentile to polypharmacy
2014 2018 2020 2023 Linear (2023)
Figure 11: The relationship between the mean cost per-
centile and the value of polypharmacy.
Figure 12: A 3D representation of the combined case num-
bers between cost percentile and the value of polypharmacy.
year 2020, which was marked by the global spread of
the novel coronavirus, resulted in a slight reduction
in the observed trend. The regression line for 2023
is illustrated here as an example. Combined with the
mean value for the dependent variable, this results in
a high correlation coefficient. This is a common phe-
nomenon when analyses are carried out with mean re-
sults.
The triple iteration from the cost percentiles to the
polypharmacy values and back yields the pertinent
cost intervals in relation to polypharmacy, namely 1-
7, 8-19, 20-57, 58-65, 66-92, and 99-100.
Conversely, the relevant intervals from the
polypharmacy to the cost percentiles and back result
after triple iteration of the following values: 1, 2-5, 6,
7-18 and 19-30.
The 3D visualisation of the case numbers is shown
in Figure 12.
In the two years compared, 2019 (table 2) and
2023 (table 3), many items are essentially the same.
In 2023, antidepressants have moved to the forefront
in the 23-30 age group (polypharmacy from 3.2 to 3.5,
cost percentile 37.2 to 40.7). This may be indicative
of the significant impact the Coronavirus pandemic
has had on young adults in particular.
As previously stated, the three variables in ques-
Trends in Drug Prescriptions in the Outpatient Physician Sector in a German Federal State from 2014 to 2023 Using Morbidity Related
Groups, Correlations and Partial Correlations
101

Table 2: The table illustrates the most frequently prescribed
MRGs for the year 2019. The age groups that exhibited the
same top 1 were summarised.
2019
Age MRG Poly- Description
pharmacy
3-9 J01C [4.0 ; 5.2] Beta-lactam anibacteri-
als, penicillins
10-12 P03A [3.1 ; 3.7] Ectoparasiticides, incl.
scabicides
14-22 G03A [2.2 ; 2.8] Hormonal contracep-
tives for systemic use
23-27 R03A [3.5 ; 3.7] Adrenergics, inhalants
28-48 H03A [2.3 ; 2.6] Thyroid preparations
49-65 R03A [4.9 ; 7.1] Adrenergics, inhalants
66-99 B01A [7.8 ; 10.3] Antithrombotic agents
Table 3: The table illustrates the most frequently prescribed
MRGs for the year 2023. The age groups that exhibited the
same top 1 were summarised.
2023
Age MRG Poly- Description
pharmacy
2-11 J01C [3.6 ; 5.4] Beta-lactam antibacte-
rials, penicillins
12-14 N06B [3.1 ; 3.5] Psychostimultans,
agents used for ADHD
and nootropics
15-22 G03A [2.3 ; 2.8] Hormonal contracep-
tives for systemic use
23-31 N06A [3.2 ; 3.5] Antidepressants
33-45 H03A [2.5 ; 2.7] Thyroid preparations
46-52 R03A [5.1 ; 5.8] Adrenergics, inhalants
53-66 C09C [4.0 ; 4.5] Angiotensin II receptor
blockers (ARBs), plain
67-99 B01A [8.3 ; 11] Antithrombotics agents
tion, namely age, polypharmacy and cost percentile,
exhibit a high degree of pairwise dependency. From
the preceding observations, it can be determined that
there are intervals which exhibit a comparatively high
degree of linear dependency. It should be noted that
correlations and partial correlations do not require lin-
ear dependencies as a prerequisite. Consequently, in-
tervals with large deviations are also of interest, in-
cluding those relating to low and high age, low and
high polypharmacy, as well as small and large cost
percentiles in various combinations.
The calculations described in the chapter on ma-
terials and methods yield the following results:
The correlations denote:
ρ
12
: Age - polypharmacy,
ρ
13
: Age - cost percentile of patients,
ρ
23
: Polypharmacy - cost percentile
of patients and correspondingly the partial correla-
tions with regard to the other variables.
Table 4: The table describes the correlations between the
three variables age, polypharmacy and cost percentile of pa-
tients for all years between 2014 and 2023 and 1.5 till 1.7
million patients in each year. Also the modulus m and the
partial correlations.
Year ρ
12
ρ
13
ρ
23
m ρ
12,3
ρ
13,2
ρ
23,1
2014 0.26 0.68 0.47 1.06 -0.09 0.65 0,41
2015 0.28 0.68 0.48 1.08 -0.07 0.65 0.41
2016 0.29 0.69 0.49 1.08 -0.09 0.66 0.43
2017 0.30 0.69 0.50 1.09 -0.08 0.66 0.43
2018 0.31 0.70 0.51 1.10 -0.07 0.66 0.43
2019 0.32 0.70 0.51 1.11 -0.06 0.65 0.42
2020 0.37 0.71 0.52 1.16 0.01 0.65 0.39
2021 0.37 0.71 0.51 1.16 0.02 0.65 0.37
2022 0.36 0.71 0.51 1.15 0.00 0.65 0.38
2023 0.38 0.72 0.50 1.17 0.04 0.66 0.35
The modulus value m is observed to exceed 1 for
all years from 2014 to 2023, exhibiting a monotonic
increase with minimal deviation in 2016. This indi-
cates that the absolute partial correlations are less pro-
nounced than the correlations. It is possible for the
sign to change, whereby a positive dependency may
transform into a negative dependency, or vice versa.
This phenomenon occurs from 2019 to 2020, which
coincides with the transition from the pre-corona pe-
riod to the era of the global pandemic.
It is usually argued that an apparent dependence
given by the correlation with the partial correlation
depends on a third variable, on which ‘in truth’ the
two variables depend. In our analysis, all three vari-
ables are interdependent in terms of content, cf. (Run-
kler and Runkler, 2000) and (Janssen et al., 1994). In
this context, it can be posited that one dependency
exerts itself as dominant (in this case, the dependency
on age and cost percentile) at the expense of another
dependency (in this case, the dependency on age to
polypharmacy). So far, the literature has lacked com-
pelling exemplars of such interactions. This is despite
their potential to occur with great frequency in both
medical and economic contexts.
4 CONCLUSIONS
The equations (1) and (4) correspond to the side and
angle cosine theorems of spherical trigonometry with
various restrictions, but apply more generally here,
cf. (Armitage and Eberlein, 2006) and (Good, 1992).
First of all, in this context there is no restriction with
regard to the triangle inequality in spherical trigonom-
etry. A restriction regarding the value of m can be re-
solved by swapping the side and angle cosine theorem
in the assignment of correlation and partial correla-
tion. The symmetry in the possible values of correla-
HEALTHINF 2025 - 18th International Conference on Health Informatics
102

tion and partial correlations assumed at the beginning
is also not necessary in the formula, since all consid-
erations are retained if one assumes correlation val-
ues with magnitudes above 1, but then uses the root
extraction as in (4) in (1) over the entire denominator.
In this respect, a relationship is then established not
only to spherical trigonometry, but also to hyperbolic
trigonometry, which provides the description for the
addition of velocities in the context of the special the-
ory of relativity.
The MRG offers a distinctive label, which allows
for the delineation of a transition between one period
(in this case, a year) and the subsequent period. This
provides the transition coefficients that are employed
as the constituent elements of a matrix. The eigen-
vector corresponding to the largest eigenvalue of the
matrix determines the limit distribution that would re-
sult as the limit value if this transition were to be fre-
quently applied as a Markov process This permits an
examination of the discrepancy between the current
distribution and the limit distribution.
Since this long-term analysis in the Big Date con-
text determined the dominant Morbidity Related Drug
Group drug group with the changes, the results can
be used in health policy decisions. In Schleswig-
Holstein, this is included in the negotiations between
the statutory health insurance funds and the Associ-
ation of Statutory Health Insurance Physicians. Of
particular importance are changes caused by the coro-
navirus pandemic, which must be distinguished from
long-term trends that existed before it. Another im-
portant point is the treatment of patients with a high
level of polypharmacy, as guidelines from specialist
associations are geared towards specific disease pat-
terns and comparatively little consideration is given
to interaction effects.
In future, it should be investigated more closely
what proportion of patients in the highest cost per-
centile are affected by very high-priced drugs for
rare diseases. For patient-centred evaluations, cross-
doctor considerations are important, which are rarely
available for data protection reasons.
REFERENCES
Armitage, J. V. and Eberlein, W. F. (2006). Elliptic func-
tions, volume 67. Cambridge University Press.
Bilin Zeng, K. C. and Wang, C. (2017). Geometric views
of partial correlation coefficient in regression analysis.
AL JOUR, 6(3):51.
Brennan, M. E. and Clare, P. H. (1980). The relation-
ship between mortality and two indicators of morbid-
ity. Journal of Epidemiology & Community Health,
34(2):134–138.
Brief, A. P., Burke, M. J., George, J. M., Robinson, B. S.,
and Webster, J. (1988). Should negative affectivity
remain an unmeasured variable in the study of job
stress? Journal of applied psychology, 73(2):193.
Bundesinstitut f
¨
ur Arzneimittel und Medizinprodukte
(BfArM) (2021). ATC-Klassifikation mit definierten
Tagesdosen DDD. https://www.dimdi.de/dynamic/
de/arzneimittel/atc-klassifikation. Accessed:
18.12.2024.
Case, A. and Deaton, A. (2017). Mortality and morbidity
in the 21st century. Brookings papers on economic
activity, 2017:397.
Delara, M., Murray, L., Jafari, B., Bahji, A., Goodarzi, Z.,
Kirkham, J., Chowdhury, M., and Seitz, D. P. (2022).
Prevalence and factors associated with polypharmacy:
a systematic review and meta-analysis. BMC geri-
atrics, 22(1):601.
Fricke, U., G
¨
unther, J., Niepraschk-von Dollen,
K., and Zawinel, A. (2019). Anatomisch-
therapeutisch-chemische Klassifikation mit
Tagesdosen f
¨
ur den deutschen Arzneimittelmarkt.
https://www.wido.de/fileadmin/Dateien/Dokumente/
Publikationen Produkte/Arzneimittel-Klassifikation/
wido arz atc gkv-ai 2019.pdf. Accessed:
18.12.2024.
Golchin, N., Frank, S. H., Vince, A., Isham, L., and
Meropol, S. B. (2015). Polypharmacy in the elderly.
Journal of Research in Pharmacy Practice, 4(2):85–
88.
Good, I. (1992). C389. partial correlation and spherical
trigonometry, ii.
High, K. P. (2004). Infection as a cause of age-related
morbidity and mortality. Ageing Research Reviews,
3(1):1–14.
Irwin, J. (1965). Note on the addition formula for the ja-
cobian elliptic functions and their connexion with the
theory of correlation, in statistics. The Mathematical
Gazette, pages 425–427.
Jackson, D. (1924). The trigonometry of correlation. The
American Mathematical Monthly, 31(6):275–280.
Janssen, J., Laatz, W., Janssen, J., and Laatz, W. (1994).
Korrelation. Statistische Datenanalyse mit SPSS f
¨
ur
Windows: Eine anwendungsorientierte Einf
¨
uhrung in
das Basissystem, pages 347–357.
Johnell, K. and Klarin, I. (2007). The relationship between
number of drugs and potential drug-drug interactions
in the elderly: a study of over 600 000 elderly pa-
tients from the swedish prescribed drug register. Drug
safety, 30:911–918.
Kendall, M. (1941). The relationship between correlation
formulae and elliptic functions. Journal of the Royal
Statistical Society, 104(3):281–283.
Kim, S. (2015). ppcor: an r package for a fast calculation to
semi-partial correlation coefficients. Communications
for statistical applications and methods, 22(6):665.
Koh, Y., Kutty, F. B. M., and Li, S. C. (2005). Drug-related
problems in hospitalized patients on polypharmacy:
the influence of age and gender. Therapeutics and
clinical risk management, 1(1):39–48.
Trends in Drug Prescriptions in the Outpatient Physician Sector in a German Federal State from 2014 to 2023 Using Morbidity Related
Groups, Correlations and Partial Correlations
103

Maier, W. and Kiesewetter, H. (1971). Funktionalgleichun-
gen mit analytischen L
¨
osungen. (No Title).
Murray, J. (2003). Mathematical biology ii. spatial mod-
els and biological applications. Springer-Verlag, New
York.
Murray, J. D. (2007). Mathematical biology: I. An introduc-
tion, volume 17. Springer Science & Business Media.
R
¨
ubenach, S. P., Stahl, T., Zawinell, A., Niepraschk-von
Dollen, K., Knecht, B., Sch
¨
ussel, K., Telschow, C.,
and Schr
¨
oder, H. (2021). Nutzung von Arzneimit-
telverordnungsdaten der gesetzlichen Krankenver-
sicherung f
¨
ur die Krankheitskostenrechnung. WISTA–
Wirtschaft und Statistik, 73(2):97–110.
Runkler, T. A. and Runkler, T. A. (2000). Datenanalyse
und Modellierung. Information Mining: Methoden,
Algorithmen und Anwendungen intelligenter Daten-
analyse, pages 53–109.
Schuster, R., Emcke, T., von Arnstedt, E., and Heidbreder,
M. (2016). Morbidity Related Groups (MRG) for epi-
demiological analysis in outpatient treatment. In Ex-
ploring complexity in health: An interdisciplinary sys-
tems approach, pages 783–787. IOS Press.
Schuster, R., Ostermann, T., Heidbreder, M., and Emcke,
T. (2018). Relations of Morbidity Related Groups
(MRG), ICD-10 Codes and Age and Gender Structure
in Outpatient Treatment. In HEALTHINF, pages 322–
328.
Thomas, G. and O’quigley, J. (1993). A geometric interpre-
tation of partial correlation using spherical triangles.
The American Statistician, 47(1):30–32.
Turrentine, F. E., Wang, H., Simpson, V. B., and Jones, R. S.
(2006). Surgical risk factors, morbidity, and mortality
in elderly patients. Journal of the American College
of Surgeons, 203(6):865–877.
Weng, Y.-A., Deng, C.-Y., and Pu, C. (2020). Targeting
continuity of care and polypharmacy to reduce drug–
drug interaction. Scientific reports, 10(1):21279.
HEALTHINF 2025 - 18th International Conference on Health Informatics
104
