
White Light Spectroscopy for Mammalian Cell Viability/Quality
Assessment: Towards an Online, Label-Free and Sampling-Less
System to Simplify Quality Control in CAR T-Cells Production
Bruno Wacogne
1,2
, Céline Codjiova
1
, Jovanne Palvair
1
, Naïs Vaccari
1
, Mélanie Couturier
3
,
Alain Rouleau
1
and Annie Frelet-Barrand
1
1
Université de Franche-Comté, CNRS, institut FEMTO-ST, F-25000 Besançon, France
2
Centre Hospitalier Universitaire de Besançon, Centre d’Investigation Clinique, INSERM CIC 1431,
25000, Besançon, France
3
MedInnPharma, 4 rue Charles Bried, 25000 Besançon France
Keywords: White Light Spectroscopy, Mammalian Cells, Viability, Car T-Cells.
Abstract: CAR T-cells are highly promising medical products for personalized medicine, but their long production is
complex and require extensive quality controls, which result in prohibitive costs for most patients. These
controls include monitoring of cell concentration, viability, and possible contamination detection. To simplify
CAR T production, these controls should ideally be conducted online in a closed system, without sampling
from the bioreactor. Recently, we proposed white light spectroscopy as a method for online monitoring of cell
concentration. In this paper, we demonstrate that this optical method can also assess cell viability. We define
a cell suspension "quality value" which shows a linear relationship with cell viability estimated by
conventional methods. This relationship varies depending on the techniques used and the dominant T-cell
death process induced. We then hypothesise that the quality score could serve as a general indicator of cell
suspension health, as it is not dependent on any biophysical-chemical interaction or instrument. Overall, the
correlation between conventional and optical methods, together with previously published results on cell
concentration monitoring, suggests that white light spectroscopy is a promising on-line and sample-free option
for monitoring CAR T production.
1 INTRODUCTION
CAR T-cells are promising advanced therapy drugs.
Their manufacturing process is quite complex (Wang,
2016; Wang, 2023) and quality control is daily
performed at each step and especially during the
expansion phase. Quality control reside mostly in
monitoring cell concentrations, assessing cell
viability, and detecting potential contamination. We
have recently proposed a proof of concept for a
potentially sampling-less white light spectroscopy
system for monitoring T-cell concentrations
(Wacogne 2020, 2021, 2022). The goal of our current
work is to explore the potential of white light
spectroscopy for assessing cell viability. Indeed, cell
viability measurement is a critical technique in
biological research, drug development, and clinical
applications used to assess cell health, proliferation,
and survival under various experimental conditions.
However, cell viability assessment remains a
challenge for label-free and online applications. A
wide range of methods have been developed to
quantify/measure cell viability, based on specific cell
type, experimental objectives, and available
resources.
Traditional Techniques
The trypan blue dye exclusion assay is the historical
technique of assessing cell viability (Macklin, 1920).
It distinguishes live cells from dead ones based on
membrane integrity. Viable cells exclude the dye,
while dead cells retain it (Louis, 2011). In some cases,
trypan blue may also have an effect on cell
morphology and viability depending on dye
concentration (Tsaouis, 2013). Cell sampling is
required as cells must be collected from the culture,
Wacogne, B., Codjiova, C., Palvair, J., Vaccari, N., Couturier, M., Rouleau, A. and Frelet-Barrand, A.
White Light Spectroscopy for Mammalian Cell Viability/Quality Assessment: Towards an Online, Label-Free and Sampling-Less System to Simplify Quality Control in CAR T-Cells Production.
DOI: 10.5220/0013149400003911
Paper published under CC license (CC BY-NC-ND 4.0)
In Proceedings of the 18th International Joint Conference on Biomedical Engineering Systems and Technologies (BIOSTEC 2025) - Volume 1, pages 53-64
ISBN: 978-989-758-731-3; ISSN: 2184-4305
Proceedings Copyright © 2025 by SCITEPRESS – Science and Technology Publications, Lda.
53

mixed with the dye, and then manually counted using
a hemocytometer or automated cell counter. Although
cost-effective, its low sensitivity and manual counting
introduce limitations, particularly for high-
throughput or highly accurate experiments (Stoddart,
2011). However, the use of Ni
2+
or Co
2+
salts may
help improving the assay sensitivity (Sarma, 2000).
Other techniques could be used. The MTT and
MTS assays measure mitochondrial reduction of
tetrazolium salts into formazan by viable cells. Cells
do not need to be sampled from the culture for
immediate analysis but, at the end of the assay, the
cell medium is sampled to measure the color change
associated with formazan production using a
spectrophotometer. This method, though easy to
perform, depends on mitochondrial activity, which
can vary with cell type and condition (Berridge,
2016). In the case of irradiated HepG2 cells (Chung,
2015), a decrease of cell viability was observed using
trypan blue while no significant changes could be
detected using MTT assay. This indicates that the
viability detection principle should be adapted to the
cell death process.
LDH assays can also quantify cell death by
measuring LDH released by damaged cells into the
medium (Zou, 2013). Sampling of cell supernatant is
required to analyse extracellular LDH levels,
typically performed after an incubation period to
allow sufficient LDH release. While this method is
sensitive to early cell death, it cannot distinguish
between apoptosis and necrosis. LDH and MTT
assays were compared to study cytotoxicity of
cadmium chloride on HTC and HepG2 cells (Fotakis,
2006) and MTT assay exhibit a higher sensitivity
compared to LDH assay.
Advanced Techniques
Other methods have been developed. Among them,
flow cytometry enables precise identification of live,
apoptotic and dead cells by using reagents such as
fluorescent dyes, cell impermeant viability dyes or
leukocyte markers for example. Sampling of cell
suspension is required to collect and stain cells before
analysis through cytometer. This technique is a gold
standard for high-throughput applications due to its
precision in cell viability measurement (Shenkin,
2007) and allows detecting both apoptosis and
necrosis (Kumar, 2015).
Fluorescence microscopy assays use different
dyes to stain live cells (for example, AlamarBlue;
Hamalainen-Laanaya, 2012). Dyes are added to cell
culture, and after incubation, images are captured to
quantify cell viability. The accuracy of automated
image analysis and high-content screening provides
quantitative results, especially for high-throughput
studies. However, exposure to excitation light may
alter cell viability itself and tolerable light doses must
be employed (Schneckenburger, 2012). It was found
that the cell morphologic changes due to trypan blue
makes them difficult to count under microscope
generating an artificially higher viability compared to
fluorescence methods and could result in viability
measurement differences between these methods
(Chan, 2015).
Impedance-based methods can track cell viability
by measuring electrical impedance as cells attach and
spread on electrode-coated plates. It is label-free,
non-invasive and monitors cell continuously and in
real time, offering high sensitivity and accuracy
without disrupting the cells and does not require
sampling of cell solution. However, cells must spread
on coated plates or micromachined substrates which
makes it difficult to implement in conventional
laboratories (Optiz, 2019; Zhong, 2021; Yang, 2023).
Microfluidic devices enable high-throughput and
low-volume viability assays at single-cell level.
Sampling is not typically required as the fluidics
system controls cell and reagents introduction and
analysis is performed within microchannels. Cell
viability assay based on image processing of stained
cells was proposed for microfluidic 3D culture (Ong,
2020).
Commercially Available Systems
Several commercial systems for cell viability
measurement are available on the market, offering
various features in terms of sensitivity, throughput
and accuracy. Below are some of the most widely
used systems:
• The xCELLigence Real-Time Cell Analysis
(RTCA) System from ACEA Biosciences (Agilent) is
based on label-free impedance measurements. It
supports high-throughput applications with 96-well
plates but can hardly be implemented for online
measurements.
• The LUNA II (Logos Biosystems) and Vi-
CELLTM XR Cell Viability Analyzer (Beckman)
automate the trypan blue exclusion assay after
sampling of cell suspension.
• The Fluidlab-R-300 (System C Bioprocess) rely
on lens less imaging or holographic digital
microscopy. It also allows optical spectral recording.
• Specific kits can be purchased for
viability/cytotoxicity assessment. The
LIVE/DEAD™ Viability/Cytotoxicity Kit (Thermo
Fisher) allows fluorescence measurement which can
be measured by cytometers, fluorescence microscope
and automated plate readers.
BIODEVICES 2025 - 18th International Conference on Biomedical Electronics and Devices
54
In summary, the measurement of cell viability has
evolved significantly with methods ranging from dye
exclusion assays to advanced real-time label-free
technologies. Traditional techniques remain widely
used because of their simplicity, while new methods
such as impedance-based assays or microfluidics offer
improved accuracy and physiological relevance. The
choice of method depends on specific experimental
context, balancing cost, complexity and/or data
quality. It should be noted that the discrepancy between
methods is related to either predominant T-cell death
process and/or type of biophysical interaction
phenomena exploited for viability measurement. Most
of the methods presented above require sampling,
while others rely on mixing reagents with cell culture.
Therefore, they are not suitable for label-free, online
and/or real-time measurements.
In this paper, we propose a proof of concept for a
white light spectroscopy method to assess cell
quality/viability without specific reagents using
lymphocyte line and inducing cell death processes.
The method can be easily transferred to an online and
sampling less system. The materials and methods are
described in section 2, while the results are presented
in section 3. A discussion is then proposed including
some medico-economic considerations about CAR T-
cells before concluding.
2 MATERIAL AND METHODS
The CEM-C1 T lymphoblast line was used in this
study. Cell death was induced in two ways: X ray
irradiation and storage at a temperature between 4°C
and 37°C. Cell viability of both normal and
dying/dead cells was then measured using an
automated cell counting, flow cytometry, and white
light spectroscopy. The aim is to establish a
spectroscopic criterion that accounts for the loss of
cell integrity, and to correlate this criterion with
viabilities measured by conventional techniques.
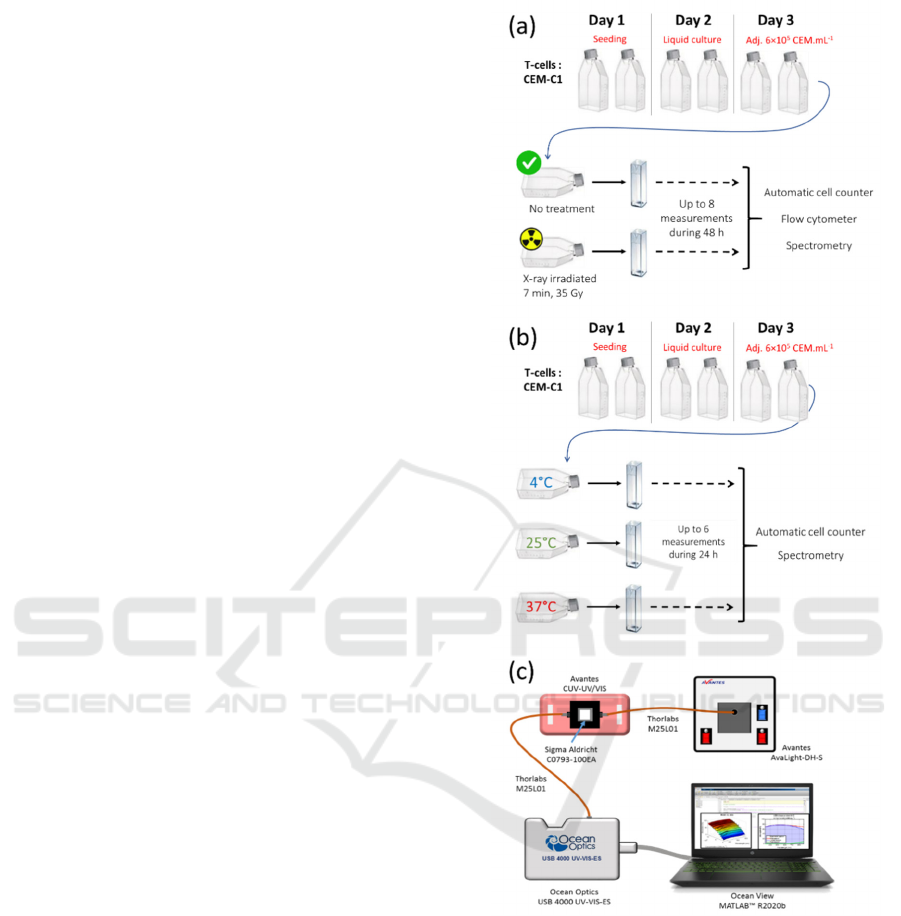
2.1 Design of the Experimental
Protocols
X-Ray Induced Cell Death
A total of 7 experiments were performed with both
normal and irradiated cells. The experimental
protocol is shown in figure 1(a).
Low Temperature -Induced Cell Death
A total of 3 experiments were performed with cells
stored at 4°C, 25 °C and 37°C for each experiment.
The protocol is presented in figure 1(b).
Figure 1: Design of the experimental protocols and spectra
measurement setup. (a) Cell death is induced by (a) X-ray
exposure (n = 7). (b) storage at low temperature (n = 3). (c)
Absorption spectra measurement setup (from (Wacogne,
2022)).
2.2 Cell Culture, Death Induction and
Viability Measurements
Cell Culture
The human T lymphoblast T-cell line CEM-C1
(ATCC® CRL-2265 TM) was cultured between
5×10
5
and 2×10
6
cells/mL in RPMI 1640 medium
without Phenol Red (Gibco #11835030) and
White Light Spectroscopy for Mammalian Cell Viability/Quality Assessment: Towards an Online, Label-Free and Sampling-Less System to
Simplify Quality Control in CAR T-Cells Production
55

supplemented with 10% FBS (Gibco #A5670701)
and 1% penicillin/streptomycin solution (PS, Gibco
#15140122) at 37 ℃ in a 5% CO
2
humidified
incubator. CEM-C1 were seeding at 6×10
5
cells/mL
in RPMI 1640 medium without Phenol + 10% FBS +
1% PS.
Cell Death Induction
For X-ray death induction, suspensions were
submitted to X-ray exposition for a total dose of 35Gy
for 7 min. Non-irradiated and irradiated cells were
then cultured at 37 ℃ in a 5% CO
2
humidified
incubator and monitored during 48h.
For low temperature death induction, suspensions
were simply stored at 4°C, 25°C and at 37°C. They
were monitored during 24 hours.
Viability and Quality Measurements
For X-ray death induction, cell viability was assessed
in three ways depending on equipment availability. (i)
A LUNA-II automated cell counter (Automated Cell
Counter, Logos Biosystems) was used on 5/7
experiments by mixing (V/V) cell suspensions and
Trypan Blue (15250061, Fischer Scientific). (ii)
Viability, apoptosis and necrosis were evaluated by
cell staining using Annexin-V coupled to FITC and
7-AAD according to provider’s instructions (Annexin
V Apoptosis Detection Kit, BD Bioscience #556547).
Viable (AnV-7AAD-), apoptotic (AnV+7AAD-) and
necrotic (AnV+7AAD+) cell percentages were
determined by flow cytometry (SP6800, Sony
Biotechnologies). (iii) White light spectroscopy was
used as detailed below and in section 2.3 on the 7
experiments.
For low temperature death induction, only
automated counting and spectroscopy were used.
2.3 Spectra Acquisition Setup and Data
Processing
The experimental setup for spectra acquisition is
simple as it only includes a white light source, a
cuvette holder and a compact spectrometer (figure
1(c) issued from (Wacogne, 2022)). Spectra were
acquired with 3647 data points between 177 nm and
892 nm wavelength. They were truncated to keep the
range between 350 and 850 nm wavelength where the
signal-to-noise ratio is higher.
Spectra were recorded in transmission and
converted to absorption spectra for mathematical
treatments. Trends of experimental data were
calculated suing the “Smoothing Spline” feature of
the Matlab
TM
Curve Fitting toolbox with a smoothing
parameter set to 2.25×10
-3
.
Spurious peaks due to strong emission lines from
the deuterium lamp (around 485 and 655 nm
wavelength) were mathematically removed, as well
as the still not fully understood additional signal at
410 nm wavelength (Wacogne, 2023). Pre-processing
and subsequent data processing were performed with
Matlab
TM
version R2020b.
For X-ray death induction, transmission spectra
were recorded every 2 hours on the first day and at
T=24, 30, and 48 hours thereafter. Some spectra were
missing due to experimental difficulties: T0 for
normal and irradiated cells exp. #4 and #5, T8 for
normal and irradiated cells exp. #6. 3 normal cell
spectra were not included due to too high cell
concentration resulting in saturated absorption
spectra: T48 exp. #2, T30 and T48 exp. 3. In total, 50
spectra were recorded with normal cells and 53 with
irradiated cells. They were processed to calculate
quality values (see below), which were compared
with viabilities measured by either the LUNA-II
automated cell counter or by cytometry.
For low temperature death induction,
experiments were performed in two ways: (i) cells
were prepared in the morning, stored at different
temperatures and transmission spectra were
recorded every 2 hours until the morning after
(except during the night), (ii) cells were prepared in
the evening, 1 transmission spectrum was recorded
in the evening and the others the next day. A total of
72 measurements were made.
3 RESULTS
3.1 Defining a Quality Value of Cell
Suspensions
The basic principle is based on a number of
observations. (i) Healthy cells divide efficiently and
few small particles (vesicles, apoptotic and necrotic
bodies…) are generated, leading to high viability.
Conversely, a culture with low cell viability contains
a high concentration of small particles. (ii) From an
optical point of view, a suspension of healthy cells
contains mainly cells (large particles), light
propagates mainly in a straight line, and light-matter
interaction results mainly in absorption. (iii) A low-
quality suspension contains a large number of small
particles that scatter light. This scattering increases
according to 1/λ for micron-sized particles. From this
we deduce that a high viability culture will have an
absorption spectrum that reflects only the absorption
of the cells, and whose shape is vaguely Gaussian,
figure 2(a). Conversely, a low viability culture will
BIODEVICES 2025 - 18th International Conference on Biomedical Electronics and Devices
56
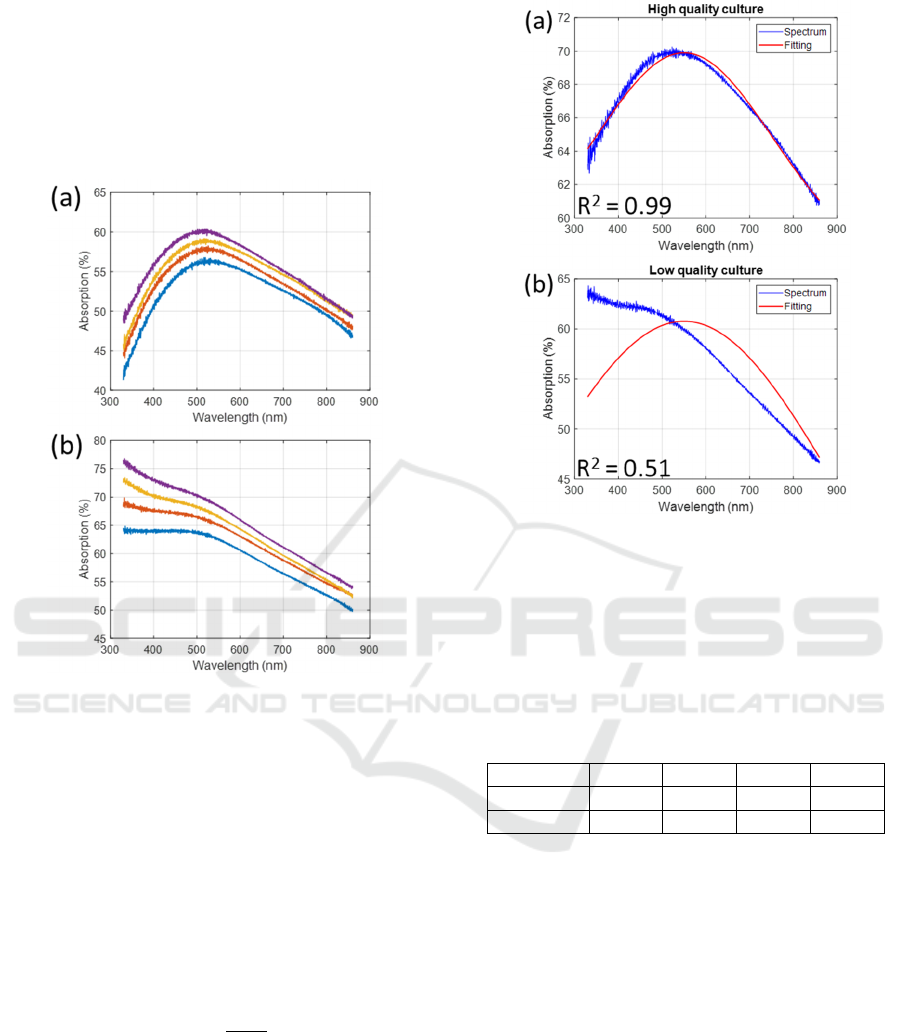
see the shape of its absorption spectrum distorted by
the 1/λ component of the scattering, figure 2(b). Thus,
the higher the quality of a culture, the more Gaussian
the shape of its absorption spectrum. Note that the
spectra shown in figure 2 and 3 correspond to
unpublished data and are used for illustrative
purposes.
Figure 2: Examples of cell suspensions with (a) high and
(b) low viability.
It must therefore be possible to estimate the
viability of a suspension by the more or less Gaussian
appearance of its absorption spectrum. One method is
to fit the absorption spectrum with a Gaussian
function. The R
2
of the fit then reflects the Gaussian
aspect of the spectrum and is therefore a measure of
the quality of the cell suspension. A suspension
quality value is defined by: Q=100*R
2
expressed in
%, R
2
resulting from the fitting of the absorption
spectrum by the following function:
𝑎𝑏𝑠
𝜆
𝑎.𝑒𝑥𝑝
𝜆𝑏
𝑐
𝑑
(1
)
In equation (1), 𝑎𝑏𝑠
𝜆
is the absorption
spectrum, a, b, c and d are the fitted coefficients.
Figure 3 shows examples of fitting obtained using
equation (1) on both types of suspensions.
Figure 3: Examples of Gaussian fitting with (a) high and (b)
low viability.
However, a few precautions need to be taken. If
no constraints are imposed on the fitting coefficients,
the algorithm always manages to find a quadruplet
leading to a high R
2
. The constraints imposed on the
coefficients in this work are shown in Table 1.
Table 1: Variation intervals of fitting coefficients.
Coeff.
a
(
%
)
b
(
nm
)
c
(
nm
)
d
(
%
)
Low. lim.
0 550 0 0
Upp. Lim.
200 700 500 200
3.2 Comparison of Viability and
Quality of Non-Irradiated and
Irradiated Cells
Figure 4 shows examples of spectra recorded with
non-irradiated and irradiated cells. For non-irradiated
cells, the concentration increased from 6×10
5
to
13×10
5
cell.mL
-1
during the 48-hours experiment.
The generation time was 44 hours, which was longer
than that measured in previous experiments due to
slight differences in the culture protocol.
Concentrations were measured by the method
described earlier (Wacogne, 2022). For irradiated
cells, the concentration decreased from 6×10
5
to
2×10
5
cell.mL
-1
, which was expected. In this case, the
concentration was measured spectrally using a more
advanced method than the one used in 2022.
White Light Spectroscopy for Mammalian Cell Viability/Quality Assessment: Towards an Online, Label-Free and Sampling-Less System to
Simplify Quality Control in CAR T-Cells Production
57
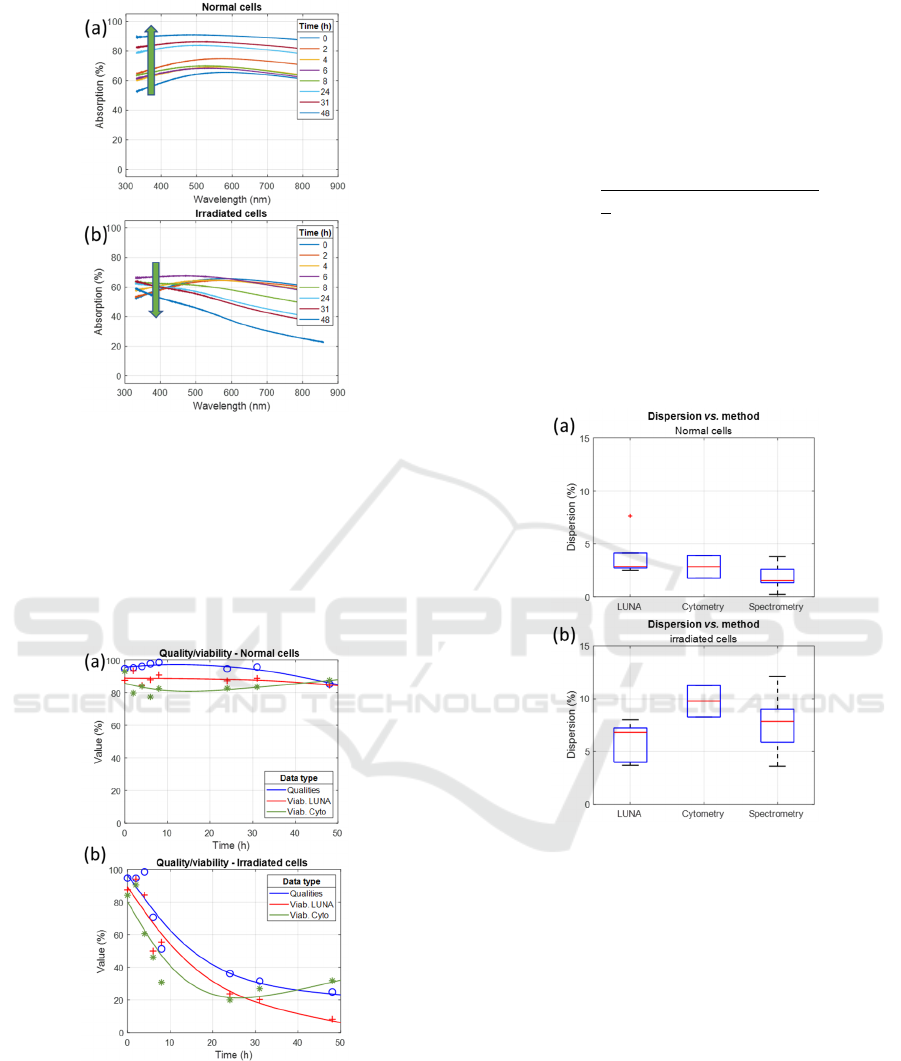
Figure 4: Examples of spectra recorded with (a) non-
irradiated cells and (b) irradiated cells. Green arrows show
either increasing or decreasing concentration.
Figure 5 shows quality values calculated from
absorption spectra and viabilities measured with the
automated counter and the cytometer, along with the
corresponding trends corresponding to the data
shown in figure 4.
Figure 5: Quality values and viabilities corresponding to
spectra of figure 4 for (a) non-irradiated cells and (b)
irradiated cells. Markers: experimental data. Lines: trends.
A correlation was observed between qualities
measured with white light spectroscopy and
conventionally measured viability. Trends show an
unexpected increase in viability as measured by
cytometry at the end of the experiment. This was
often observed and will be addressed in section 4.
Experimental data show dispersion around
corresponding trends. Dispersion was calculated
using a modified form of the standard deviation
calculation where the mean is replaced by the trend as
follows.
D
𝑖𝑠𝑝
∑
𝑉𝑎𝑙𝑢𝑒
𝑇𝑟𝑒𝑛𝑑
(2
)
In equation (2), Value
i
represents the i
th
data point
and Trend
i
is the value of the corresponding trend at
data i.
Dispersion was then calculated for each
measurement method for both non-irradiated and
irradiated cells (figure 6).
Figure 6: Boxplot of dispersion for the different
measurement methods for (a) non-irradiated and (b)
irradiated cells.
Dispersion was quite low for non-irradiated cells
(median less than 3%), while it was significantly
higher for irradiated cells (median over 6.5%).
Spectral measurements showed the lowest dispersion
for non-irradiated cells, while automated counting
was the best option for measuring the viability of
irradiated cells. Dispersion of viability measured by
cytometry was quite large with a median value close
to 10%. Considerations about dispersions will be
discussed in section 4.
The correlation between quality values and
viability, as measured by either the automated counter
or the cytometer was reported (figure 7). To avoid
cluttering the figure in the (100,100) coordinate
BIODEVICES 2025 - 18th International Conference on Biomedical Electronics and Devices
58
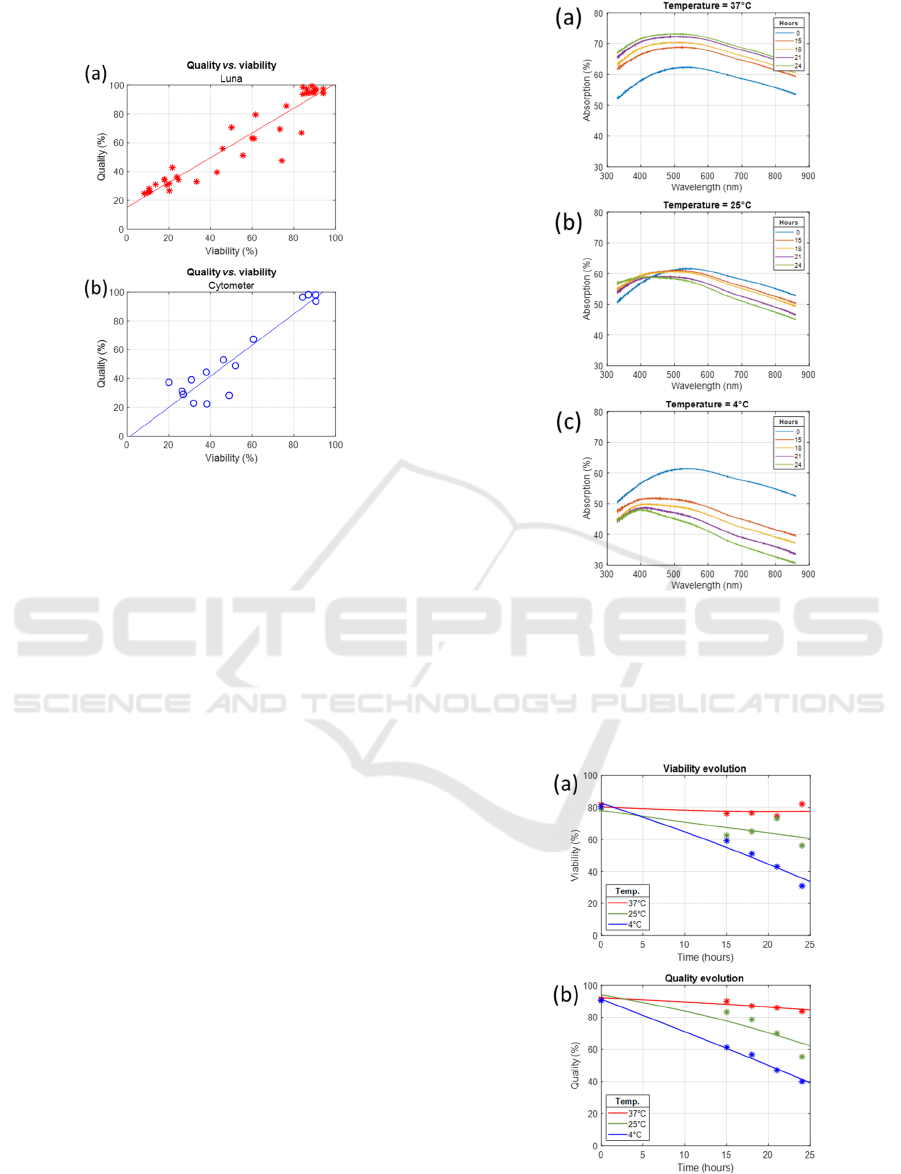
region, only data corresponding to irradiated cells
were showed in this figure.
Figure 7: Relation between quality and viability for (a)
automated counting and (b) cytometry.
Because of the dispersion shown in figure 6, the
data shown in figure 7 also showed a large dispersion.
The dispersion was 8.6% for the (quality/counter)
results and 10% for the (quality/cytometer) results.
This aspect will be discussed in section 4.
Nevertheless, linear regressions could be calculated
with acceptable R
2
around 0.9. The linear regressions
for both cases are given below.
𝑄𝑢𝑎𝑙𝑖𝑡𝑦0.86𝑉𝑖𝑎𝑏
15.3
(3
)
𝑄𝑢𝑎𝑙𝑖𝑡𝑦1.08𝑉𝑖𝑎𝑏
1.55
(4
)
The difference between these regressions will be
discussed in section 4.
3.3 Comparison of Viability and
Quality of Cells Stored at Low
Temperature
Figure 8 shows examples of spectra recorded at
different temperatures. At 37°C, the concentration
normally increases from 5.6×10
5
to 7.6×10
5
cell.mL
-
1
in 24 hours (generation time: 35 hours). The shape
of the spectra remains constant over time. At 25°C,
the concentration decreases slightly from 5.5×10
5
to
5.1×10
5
cell.mL
-1
and the shape of the spectra starts
changing after 21 hours. At 4°C, the concentration
decreases sharply from 5.5×10
5
to 3.6×10
5
cell.mL
-1
while the shape of the spectra changes much earlier.
Figure 8: Examples of spectra recorded at (a) 37°C, (b)
25°C and (c) 4°C.
Figure 9 shows the evolution of the corresponding
viability and quality. The evolution of these values is
consistent with the spectra shown in figure 8.
Figure 9: Viability and quality evolution corresponding to
spectra shown in figure 7. (a) Viability measured with
automated counter, (b) Quality.
White Light Spectroscopy for Mammalian Cell Viability/Quality Assessment: Towards an Online, Label-Free and Sampling-Less System to
Simplify Quality Control in CAR T-Cells Production
59
Finally, figure 10 shows the linear correlation
between viability and quality for all data recorded at
25°C and 4°C (37°C was omitted to avoid cluttering
the figure in the (100,100) coordinate region).
Figure 10: Relation between viability (counter) and quality
(spectroscopy).
The data dispersion is high for the reasons
mentioned above. The linear regression is shown
below.
𝑄𝑢𝑎𝑙𝑖𝑡𝑦1.13𝑉𝑖𝑎𝑏
3.75
(5)
In conclusion, according to the results shown in the
above sections, a relationship exists between quality
measured spectrally and viability measured by either
conventional methods. This relationship is linear and
depends on both the conventional method used as a
gold standard and the death process the cells undergo.
White light spectroscopy can therefore be used to
measure the viability of a cell suspension but should
apparently be adapted to experimental conditions.
However, the quality value may also be an alternative
method to estimate the cell health as discussed in
section 4.
4 DISCUSSION
Data Format
The original experimental setup was used to measure
cell concentrations. A discussion of data format was
proposed to explain why spectra were presented in
terms of absorbance rather than other formats such as
transmission or optical densities (OD) (Wacogne,
2022). In the current work, spectra were recorded in
the same way to facilitate mathematical treatments.
Note that the word "absorption" can sometimes be a
misnomer when considering small size particles, as
discussed later on.
Temperature-Induced Death Data
Experiments were performed in two ways: (i) cells
were prepared in the morning, stored at different
temperatures and transmission spectra were recorded
every 2 hours until the next morning, (ii) cells were
prepared in the evening, one transmission spectrum
was recorded in the evening and the others the next
day. Since viability decreases quite slowly when cell
death is induced by temperature stress, nothing
happens on the first day if the experiment was started
in the morning. Therefore, the examples shown in
figures 8 and 9 correspond to experiments started in
the evening.
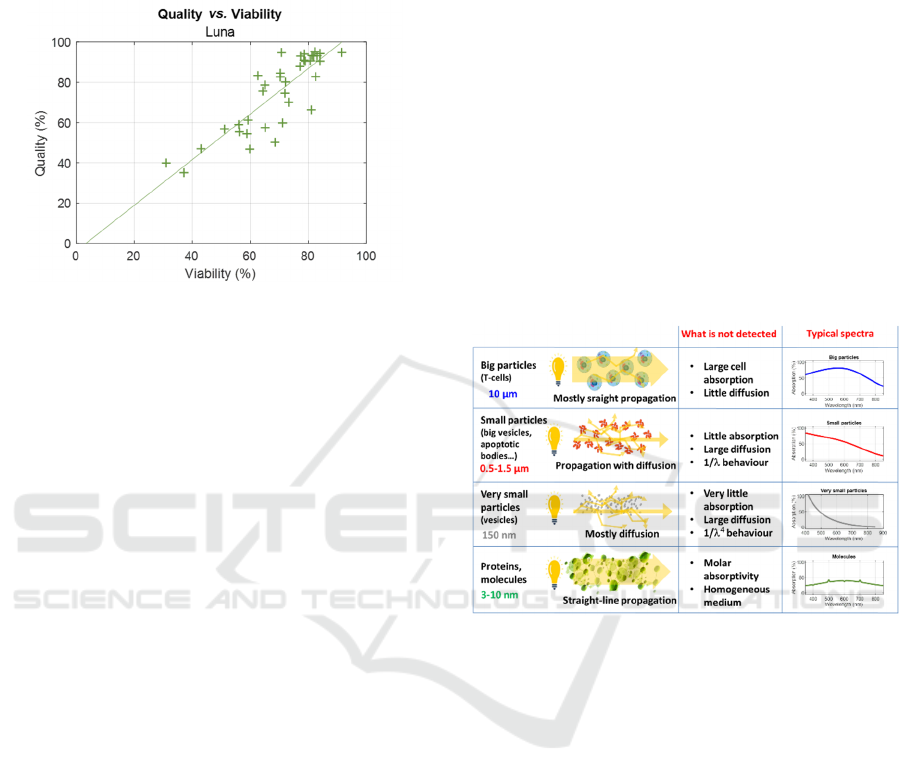
Light-Matter Interaction, Spectra Shapes and
Remarks Concerning Optical Densities
The light-matter interaction process depends on the
size of the illuminated particles (figure 11).
Figure 11: Light-matter interaction with particles.
When the particles are large (around 10µm), the
light propagates mostly straight and there is very little
diffusion. In this case, the dominant light-matter
interaction process is absorption by cell constituents.
Spectrally, the shape of the absorption spectrum is
approximately Gaussian, at least for T-cells (figure
2(a)).
For smaller particles (around 1 µm), there is little
absorption and diffusion predominates. In this case,
diffusion evolves according to 1/λ, which explains
the spectra shape when large and small particles are
present (figure 2(b)).
For even smaller particles, diffusion is clearly
dominant and evolves according to 1/λ
4
.
Finally, for molecular size events, the medium can
be considered homogeneous and only absorption
occurs according to the molar absorptivity of the
molecules.
In this work, cell suspensions with high viability
correspond to the first row of figure 11, while
BIODEVICES 2025 - 18th International Conference on Biomedical Electronics and Devices
60

suspensions with low viability (regardless of the
death induction method) correspond to the second
row of figure 11. It is therefore inappropriate to speak
of absorption when the dominant light-matter
interaction is diffusion. In fact, the light not incident
on the spectrometer has not only been absorbed, but
mainly diffused. In this case, the word attenuation
may be preferred (Wacogne, 2023).
Also, the term optical density theoretically refers
only to the absorption of homogeneous media (fourth
row in figure 11). In other situations, such as
measuring the concentration of a bacterial
suspensions using a plate reader, the term optical
density is inappropriate. Nevertheless, the Beer-
Lambert law can still be applied (especially the law
of OD additivity for reference taking), but a term
other than OD should be preferred.
Data Dispersion
Dispersion is clearly observed in viability and quality
measurements. Dispersion can have several causes, as
already mentioned (Wacogne, 2022, 2023) for cell
concentration measurements. With conventional
techniques, viability measurements are performed
with very small volumes (a few tens of µL), making
the measurement poorly representative of what is
actually present in the culture cuvettes. The low-cost
plastic cuvettes used in this work have variations in
their optical properties that lead to inaccuracies of a
few percent.
The results presented here suggest that the
dispersion was even greater when viability was
measured. This is probably due to the difficulty for
conventional systems to actually determine whether a
cell is alive or dead. This results in a large dispersion
of data when the relationship between quality and
viability measured by either conventional mean is
reported (figures 7 and 10). This dispersion is not due
to possible inaccuracies in the measurement of quality
by spectroscopy since optical spectroscopy proved to
be more accurate than automated counter for cell
concentration measurements (Wacogne, 2021). We
could have then thought that quality measurements
would have shown less dispersion than other
conventional means. It is not the case. One hypothesis
is that equation (1) used to fit spectra could be
improved and/or that fitting intervals reported in table
1 could be adjusted. Indeed, the equation describing
the shape of the absorption spectra of CEM-C1 cells
includes a wavelength dependent base line not
accounted for in equation (1) (equation (5); Wacogne,
2022).
Relationships Between Quality and Viability
Figure 7 shows the relationships between quality and
viability when cell death is induced by irradiation for
2 gold standard techniques: automated counting and
cytometry. The relationships differ in terms of linear
regression slopes and ordinates at the origin. Figure
10 shows the relationship between viability, as
measured by automated counting, and quality when
cell death is thermally induced. It differs from the
counting/spectroscopy (irradiation) relationship, but
is similar to the cytometry/spectroscopy (irradiation)
relationship.
Viability measurement depends on several
factors. The discrepancy between methods is related
to either the predominant T-cell death process and/or
the type of biophysical interaction phenomena used
for viability measurement (Chung, 2015, Fotakis,
2006 and Chan, 2015). In fact, it depends on the type
of cell death and the ability of the viability
measurement equipment to detect it.
When cells die, they can undergo either apoptosis
or necrosis (autophagy is not discussed here). In its
early stages, apoptosis is characterised by a slight
reduction in cell size (a few µm). Later, the cells
disappear, producing micro- and sub-micrometre-
sized apoptotic bodies and microvesicles. In its early
stages, necrosis is characterised by a slight swelling
of cells. Later, cell membranes rupture and release
micro- and sub-micrometre-sized necrotic bodies.
Cell membrane debris remains in the suspension.
In this paper, viability is measured by cytometry
or automatic counting. The cytometric markers used
in this study makes it possible to distinguish apoptosis
from necrosis. Every not marked and cell-sized event
is considered as a living cell. The automatic counter
is based on trypan blue staining. This dye penetrates
cells but is expelled by living cells. It therefore stains
cells undergoing early necrosis. Early apoptotic and
late and large necrotic bodies are either stained or not
depending on individual death state. Late apoptotic
and small necrotic bodies are not detected.
The quality measured spectrally reflects the extent
to which the shape of the measured spectrum deviates
from a Gaussian shape. A decrease in this quality
value therefore reflects the presence of particles
smaller than healthy cells in the suspension, whatever
the type of cell death. It is mostly late apoptotic and
necrotic bodies, including cell membrane debris, that
modify the shape of the measured spectrum.
Regarding X ray induced cell death and to
understand the differences between the relationships
shown in figure 7, it is important to distinguish
between the ability of conventional viability
White Light Spectroscopy for Mammalian Cell Viability/Quality Assessment: Towards an Online, Label-Free and Sampling-Less System to
Simplify Quality Control in CAR T-Cells Production
61

measurement methods to actually produce accurate
results when viability is either high or low.
High viability range. The automated counter,
based on trypan blue staining, easily detects early
necrotic cells and hardly detects late necrotic bodies.
Some early apoptotic cells are detected while no late
apoptotic bodies are seen. This leads to an
overestimation of viability by automated counting
when viability is high, already reported previously
(Cai, 2023). To account for this, the data shown in
figure 7(a) should be slightly shifted to the left in the
high viability range, thus increasing the slope of the
relationship and decreasing the ordinate at the origin.
Low viability range. In this case, cytometry barely
detects dead cells. In fact, cells at this stage of death
are weakly expressing targets for AnV and 7AAD
markers, and both late apoptotic and necrotic bodies
are barely detectable. This leads to an overestimation
of viability by cytometry when viability is low.
Indeed, this is the reason why the apparent viability
increased between 24 and 48 hours post-irradiation
(figure 5(b)). To account for this, the data shown in
figure 7(b) should be shifted slightly to the left in the
low viability range, thus decreasing the slope of the
relationship and increasing the ordinate at the origin.
Taking all these corrections into account should
reduce and perhaps eliminate the differences in the
relationships shown in Figure 7 and equations (3) and
(4).
With regard to the effect of temperature, it is
difficult to interpret the relationship shown in figure
10 and equation (5) without comparison with other
measurement methods. The fact that the slope is equal
to 1 and the ordinate at the origin is equal to 0 does
not lead to any conclusion at this stage. It is not
possible to estimate the predominant T-cell death
process occurring at low temperature from these data.
However, it was reported that hypothermia mainly
induces apoptosis (Rauen, 1999; Wang, 2017).
Quality as a More General Alternative to Viability?
The measurement of viability remains open to
question since it depends on type of cell death and of
biophysical interaction phenomenon used in the
different measurement techniques. This explains the
differences observed in the literature when different
techniques are compared.
Apart from specific applications where the cell
death process is being studied, viability
measurements are mainly used to assess the health of
cell cultures, to evaluate experimental effects or to
optimise culture conditions. High cell viability
indicates a healthy and robust culture, whereas low
viability indicates problems with the culture
conditions or possible contamination. In these cases,
the spectrally measured quality value could provide a
more general alternative to viability measurement.
Indeed, the quality value indicates the extent to which
the cell suspension deviates from an ideal situation
where all cells are viable without relying to any bio-
physical-chemical interactions or equipment
specificity. Noted that early apoptotic and necrotic
bodies do not alter the spectra shape as much as late
bodies. An adjustment of equation (1) and/or table (1)
may be necessary to account for these slight spectral
changes.
Medico-Economic Considerations about CAR T-Cells
This study may have applications into the field of
CAR T-cell production and in particular the
expansion phase of several days, with each additional
day increasing their cost. Quality controls are
currently used to follow cell expansion but requires
frequent sampling, increasing risk of contamination.
The results outlined above are particularly
noteworthy because they enable quality control
without the need for sampling and allow for a rapid
termination of the expansion phase if issues arise.
CAR T therapy, designed to treat patients with
currently incurable diseases, has the potential to
revolutionize treatment in the coming years.
However, it remains still challenging to predict the
range of diseases these therapies may address or how
many patients might ultimately benefit from them.
Currently, there are several CAR T therapies on
the market (Wang, 2023; Bogert, 2021), each with
high price tags due to the complexity of treatment and
production. Some of the prominent FDA-approved
CAR T therapies include:
• Kymriah (tisagenlecleucel): Used to treat acute
lymphoblastic leukemia (ALL) and certain
types of lymphoma. It costs approximately
$475,000 per dose.
• Yescarta (axicabtagene ciloleucel): Primarily
used for large B-cell lymphoma, with a cost of
around $373,000 per dose.
• Tecartus (brexucabtagene autoleucel):
Approved for mantle cell lymphoma, priced
similarly to Yescarta at around $373,000.
• Breyanzi (lisocabtagene maraleucel): Treats
large B-cell lymphoma and has a list price of
about $410,000 per dose.
• Abecma (idecabtagene vicleucel): Approved for
multiple myeloma, costing around $419,500 per
dose.
These therapies, while promising in treating
various blood cancers, also incur additional costs
BIODEVICES 2025 - 18th International Conference on Biomedical Electronics and Devices
62

related to hospitalization and managing side effects
like cytokine release syndrome (CRS). This often
pushes the total cost per patient toward or beyond $1
million (Bogert, 2021; The ASCOP Post, 2018).
Automating CAR-T-cell production could
significantly reduce costs by lowering the need for
specialized labour and minimizing errors, thus
addressing the high price of treatments. It would also
improve scalability, enabling faster production and
wider accessibility. Standardizing the process could
enhance consistency, leading to better therapeutic
outcomes. Automation would also shorten the
turnaround time, allowing patients to start treatment
sooner, reducing need for costly interim therapies.
Finally, automating production could lower
healthcare burdens and make CAR T more accessible.
Online Integration Possibilities
White light spectroscopy can be easily integrated into
an online system (Wacogne, 2020). This is directly in
line with the advantages of automating the
manufacture of CAR T mentioned above. In addition,
the use of extremely compact light sources (Yujileds)
and spectrometers of fingernail size (Hamamatsu)
should facilitate and accelerate the integration of this
method.
Thus, having an online, real-time system for
monitoring cell expansion, quality of cells produced
and, potentially, real-time detection of any
contamination would represent a definite added value
for the development of these production systems.
5 CONCLUSIONS
In this paper, white light spectroscopy is used to
estimate the viability of T-cell line suspensions using
a “quality value” determined from the shape of the
absorption spectra of cell suspensions. A direct
relationship is observed between this quality value
and the viability measured by various conventional
methods. However, this relationship depends on the
conventional system used and the way in which cell
death is induced. These discrepancies in viability
measurements has already been mentioned in the
literature when comparing different conventional
methods.
Measuring the “quality value” could provide an
alternative to viability assessment less dependent on
equipment and type of cell death involved because it
is based solely on analysis of spectra shape and
independent from complex biophysical-chemical
interactions.
The measurement of a single absorption spectrum
of lymphocyte suspensions makes it possible to
monitor cell concentration and possibly detect any
contamination, but also to assess quality/viability of
cell cultures during the production of CAR T
therapies, leading to the possible online integration of
white light interferometry. This possibility of
automation would then be a step towards reducing the
price of these innovative therapies and making their
use more democratic.
ACKNOWLEDGEMENTS
This work was supported by the MiMedI project
(Grant N° DOS0060162/00) and the BioIMP project
(Grant N° BFC000802) funded by EU through the
European Regional Development Fund of the Region
Bourgogne Franche-Comté.
REFERENCES
Agilent: https://www.agilent.com/en/product/cell-analysis/
real-time-cell-analysis/rtca-analyzers/xcelligence-rtca-
esight-imaging-impedance-741228?gad_source=1&gc
lid=Cj0KCQjw3vO3BhCqARIsAEWblcCSop2Rma9n
WV2mnlpm1rzBEmhuFsxR3WFYtNWWCzbMyZ6v
GHjDzBcaAtSMEALw_wcB&gclsrc=aw.ds
Beckman: https://www.beckman.fr/cell-counters-and-anal
yzers/vi-cell-xr
Berridge, M. V., et al, 2016. Tetrazolium dyes as tools in
cell biology: New insights into their cellular reduction.
Biotechnology Annual Review, Vol. 11, pp.127-152
Bogert, R. 2021. Improving Outcomes and Mitigating Costs
Associated With CAR T-Cell Therapy. Supplement to
the American Journal of Managed Care, Vol. 27, pp.
S253-S261
Cai, Y., et al, 2024. Assessment and comparison of viability
assays for cellular products, Cytotherapy, Vol. 26, pp.
201-209
Chan, L.L., et al, 2015. Morphological observation and
analysis using automated image cytometry for the
comparison of trypan blue and fluorescence-based
viability detection method, Cytotechnology, Vol. 67,
pp. 461-473
Chung, D.M., et al, 2015. Evaluation of MTT and Trypan
Blue assays for radiation-induced cell viability test in
HepG2 cells. Int J Radiat Res, Vol. 13, pp. 331-335
Fotakis, G., et al, 2006. In vitro cytotoxicity assays:
Comparison of LDH, neutral red, MTT and protein
assay in hepatoma cell lines following exposure to
cadmium chloride, Toxicology Letters, Vol. 160, pp.
171-177
Fuente-Jiménez, J.L., et al, 2023. A comparative and
Critical Analysis for In Vitro Cytotoxic Evaluation of
Magneto-Crystalline Zinc Ferrite Nanoparticles Using
White Light Spectroscopy for Mammalian Cell Viability/Quality Assessment: Towards an Online, Label-Free and Sampling-Less System to
Simplify Quality Control in CAR T-Cells Production
63

MTT, Crystal Violet, LDH, and Apoptosis Assay. Int.
J. of Mol. Sci., Vol. 24, PP. 12860
Hamalainen-Laanaya, H.K., et al, 2012. Analysis of cell
viability using time-dependent increase in fluorescence
intensity. Analytical Biochemistry, Vol. 429, pp. 32-38
Hamamatsu: https://www.hamamatsu.com/eu/en/product/
optical-sensors/spectrometers/mini-spectrometer.html
Kumar, G., et al, 2015. Flow cytometry evaluation of in
vitro cellular necrosis and apoptosis induced by silver
nanoparticles, Food and Chemical Toxicity, Vol. 85,
pp. 45-51
Logos Biosystems: https://logosbio.com/
Louis, K.S., et al. 2011. Cell Viability Analysis Using
Trypan Blue: Manual and Automated Methods.
Stoddart, M. (eds) Mammalian Cell Viability. Methods
in Molecular Biology, Vol. 740, pp. 7-12
Macklin, C.C., et al, 1920. A study of brain repair in the
ratby the use of trypan blue: with special reference to
the vital staining of the macrophages. Archives of
Neurology and psychiatry, Vol. 7, pp. 353-NP
Ong, L.J.Y., et al, 2020. Quantitative Image-Based Cell
Viability (QuantICV) Assay for Microfluidic 3D Tissue
Culture Applications. Micromachines, Vol.11, pp. 669
Optiz, C., et al, 2019. Rapid determination of general cell
status, cell viability, and optimal harvest time in
eukaryotic cell cultures by impedance flow cytometry.
Applied Microbiology and Biotechnology, Vol. 103, pp.
8619-8629
Rauen, U., et al, 1999. Cold-induced apoptosis in cultured
hepatocytes and liver endothelial cells: mediation by
reactive oxygen species. Faseb journal, Vol. 13,
pp.155–168
Sarma, K.D., et al, 2000. Improved sensitivity of trypan
blue dye exclusion assay with Ni2+ or Co2+ salts.
Cytotechnology, Vol. 32, pp. 93–95
Schneckenburger, H., et al, 2012. Light exposure and cell
viability in fluorescence microscopy. Journal of
Microscopy, Vol. 245, pp. 311-318
Shenkin, M., et al, 2007. Accurate assessment of cell count
and viability with a flow cytometer. Cytometry Part B:
Clinical Cytometry, Vol.72B, pp. 427-432
Stoddart, M. J. 2011. Cell Viability Assays: Introduction.
Methods in Molecular Biology, Vol. 740, pp. 1-6
System C Bioprocess: https://www.system-c-bioprocess.
com/produit/fluidlab-r-300/
The ASCO Post: https://ascopost.com/issues/may-25-
2018/weighing-the-cost-and-value-of-car-t-cell-
therapy/
Thermofisher: https://www.thermofisher.com/order/cata
log/product/L3224
Tsaouis, K., et al, 2013. Time-dependent morphological
alterations and viability of cultured human trabecular
cells after exposure to Trypan blue. Clinical &
Experimental Ophthalmology, Vol. 41, pp. 484-490
Wacogne, B.; et al, 2020, Optical Spectroscopy for the
Quality Control of ATMP fabrication: A new method
to monitor cell expansion and to detect contaminations,
In Proceedings of the 13th International Joint
Conference on Biomedical Engineering Systems and
Technologies (BIOSTEC 2020), Springer Vol. 1, pp.
64-72
Wacogne, B. et al, 2021. White light spectroscopy for T-
cell culture growth monitoring: towards a real-time and
sampling free device for ATMPs production. Journal of
Translational Science, Vol. 7, pp. 1-10
Wacogne, B., et al, 2022. Absorption Spectra Description
for T-Cell Concentrations Determination and
Simultaneous Measurements of Species during Co-
Cultures, Sensors, Vol. 22, art. 9223
Wacogne, B., et al, 2023. Absorption/attenuation spectra
description of ESKAPEE bacteria: application to
seeder-free culture monitoring, mammalian T-cell and
bacteria mixture analysis and contamination
description, Sensors, Vol. 23, art. 4325
Wang, J., et al, 2017. The analysis of viability for
mammalian cells treated at different temperatures and
its application in cell shipment. PLoS ONE 12, Vol.4,
pp. e0176120
Wang J.Y,, et al, 2023. CAR-T-cell therapy: Where are we
now, and where are we heading?, Blood Sci., Vol. 5, pp.
237-248.
Wang, X., et al, 2016. Clinical manufacturing of CAR T-
cells: Foundation of a promising therapy, Mol. Ther.
Oncolytics, Vol. 3, pp. 16015
Yang, B., et al, 2023. Label-Free Sensing of Cell Viability
Using a Low-Cost Impedance Cytometry Device.
Micromachines, Vol. 14, pp. 407
YUJILEDS : https://store.yujiintl.com/products/yujileds-
hyperspectral-350nm-1000nm-0-4w-led-smd-2835
Zhong, J., et al, 2021. Multi-frequency single cell electrical
impedance measurement for label-free cell viability
analysis. Analyst, Vol. 146, pp. 1848-1858
Zou, Y., et al. 2013. Application of LDH-Release Assay to
Cellular-Level Evaluation of the Toxic Potential of
Harmful Algal Species, Bioscience, Biotechnology, and
Biochemistry, Vol. 77, pp. 345–352
BIODEVICES 2025 - 18th International Conference on Biomedical Electronics and Devices
64
