
Evaluation of Resin Molds Change in Design and Polymerization by
Using a Wavefront Sensor
Kazumasa Tatsumi
1,2 a
, Kentaro Saeki
1b
,Shin Kubota
1
, Yoshikatsu Kaneda
1
, Kenji Uno
1,3
,
Kazuhiko Ohnuma
1,3
and Tatsuo Shiina
2c
1
SEED CO., LTD, 2-40-2 Hongo, Bunkyo-ku, Tokyo, 369-0131, Japan
2
Chiba University, 1-33 Yayoi-cho, Inage-ku, Chiba-shi, Chiba, 263-8522, Japan
3
Laboratorio de Lente Verde, 98-1 Nozomino, Sodegaura, Chiba, 299-0251, Japan
Keywords: Wavefront Sensor, Wavefront Shape, Contact Lenses, Resin, Mold.
Abstract: Advances in molding technology have made it possible to produce plastic molded products with complex
shapes. In contact lens manufacturing, a double-sided molding method using resin molds is employed, where
the front and back designs are replicated through injection molding. However, shape changes in the resin
molds caused by heat treatment (polymerization) during the manufacturing process affect lens characteristics.
This study proposes a method using optical techniques to clarify the influence of mold design and
polymerization on resin mold shapes. Five types of resin molds were measured using a wavefront sensor,
which allows for high-accuracy, non-contact measurement. Wavefront aberrations and radii of curvature were
evaluated, and results showed that polymerization caused slight deviations from the design values and changes
in shrinkage rates. This method demonstrated its effectiveness in measuring and evaluating resin molds for
contact lens production. Furthermore, the proposed method has wide-ranging applications, including quality
control in lens manufacturing and evaluating the transfer accuracy of metal molds.
1 INTRODUCTION
Injection molding technology, which has been rapidly
advancing in recent years, is one of the most
important technologies in the plastics industry. Since
John W. Hyatt invented the vertical celluloid molding
machine in 1872, laying the foundation for injection
molding, the technology has seen significant growth,
especially in the latter half of the 20th century
(Rosato, 2000). Innovations in both injection molding
techniques and plastic materials have greatly
enhanced production efficiency (Ciofu, 2013). The
introduction of automatic control systems using
microprocessors has made it possible to manufacture
parts with even greater complexity and precision.
Since the 1990s, injection molding has become more
refined and has evolved into a technology widely
used in fields such as medical devices and electronic
components.
a
https://orcid.org/0009-0008-2975-7695
b
https://orcid.org/0000-0002-4902-3110
c
https://orcid.org/0000-0001-9292-4523
Contact lenses are one of the medical devices
manufactured using injection molding technology. In
a world where myopia is increasing due to the
widespread use of smartphones and other tiny small
display devices, the global demand for contact lenses
is rising year by year. Consequently, there is a need
to mass-produce and high-quality contact lenses. The
concept of contact lenses was first introduced by
Leonardo da Vinci in 1508, and later in 1888, Adolf
Fick developed a glass scleral lens, marking the first
step toward their practical use (Oswald, 2008).
Similar to the advancements in injection molding, the
development of plastic materials also had a
significant impact on contact lenses, leading to the
creation of plastic scleral lenses, which greatly
reduced their weight and improved their durability
(Ciofu, 2013). In the 1960s, soft contact lenses made
from hydrogel materials, developed by Otto
Wichterle and Drahoslav Lim, were introduced and
remain popular today (Oswald, 2008).
20
Tatsumi, K., Saeki, K., Kubota, S., Kaneda, Y., Uno, K., Ohnuma, K. and Shiina, T.
Evaluation of Resin Molds Change in Design and Polymerization by Using a Wavefront Sensor.
DOI: 10.5220/0013150400003902
In Proceedings of the 13th International Conference on Photonics, Optics and Laser Technology (PHOTOPTICS 2025), pages 20-27
ISBN: 978-989-758-736-8; ISSN: 2184-4364
Copyright © 2025 by Paper published under CC license (CC BY-NC-ND 4.0)

Injection molding technology and contact lens
manufacturing are closely related. While glass lenses
are hand-polished, plastic soft contact lenses are
produced using a cast molding method that utilizes a
mold created through injection molding (Chen,
2017). A metal mold is made to replicate the front and
back designs, and a resin mold is then produced
through injection molding. The contact lenses are
formed by pouring the lens material into two resin
molds and fitting them together.
In the cast molding method, the surface of the
resin mold must be precisely and smoothly formed to
improve the quality of contact lenses (Chen, 2017).
Since the raw material for contact lenses is liquid, a
solid lens is formed through a heat treatment
(polymerization). Polymerization is carried out by
pouring the raw material into the resin mold and
sealing it. The space within the fitted resin mold
determines the shape of the contact lens, making the
precision of the mold surface crucial. Therefore, both
the mold design and the molding conditions during
manufacturing are key factors in producing high-
quality contact lenses, and research has been
conducted to optimize these conditions (Chen, 2017)
(Chang, 2001).
In mass production, resin molds are created under
nearly identical basic molding conditions, but
differences in precise design should still be evaluated.
Additionally, the influence of the polymerization on
the resin mold during the manufacturing process must
also be considered. This is because plastic, the
primary material for resin molds today, is more prone
to deform than glass or metal, and can change shape
when exposed to high temperature, around 100°C.
Resin molds are typically evaluated by using a
compact laser interferometer, but since the
measurements rely on the person interpreting the
interference fringes displayed during the
measurement, quantitative assessments are not
possible, and differences among them can arise.
In this study, we propose a method for evaluating
resin molds using a wavefront sensor to quantitatively
perform high-precision inspections. The wavefront
sensor allows for highly accurate wavefront
measurements at the sub-nanometer level using
Zernike polynomials. Additionally, it can acquire
aberration data within a few milliseconds, allowing
the detection of aberration changes real-time
(Atchison, 2005). Zernike coefficients can be
displayed as numerical parameters, providing
detailed measurements of the resin mold's
aberrations. Additionally, the radius of curvature can
be measured simultaneously, making the wavefront
sensor a promising alternative to interferometers.
Previous research has demonstrated that
measurements obtained from wavefront sensors
function effectively as evaluation indices for aspheric
lenses (Cheng, 2020). Given the high precision of the
measurement parameters, this study utilizes the
wavefront sensor to measure both the aberrations and
the radius of curvature of the resin molds. This study
aims to clarify how the design and polymerization
during the manufacturing process affect changes in
the aberration and radius of curvature of the resin
molds. It enables measurements with the same
accuracy as conventional measurement of
interferometer, while also providing real-time, stable
measurements. Therefore, it is innovative not only for
contact lens manufacturing but also for quality
control in medical devices and precision molded
products.
2 EXPERIMENTS
2.1 Experimental Equipment
Table 1 shows an overview of the wavefront sensor
used in this study. This device was specifically
designed to measure the reflected wavefront of resin
molds (Pulstec Industrial Co., Ltd.: LUCAS). Figure
1 illustrates the measurement principle. It employs
the Shack-Hartmann principle, using either a Charge
Coupled Device (CCD) or a Complementary Metal
Oxide Semiconductor (CMOS) as the imaging
element, which is composed of many microlenses
(Atchison, 2005). A laser is irradiated from the light
source, and the reflected light from the measurement
object passes through the microlenses and is directed
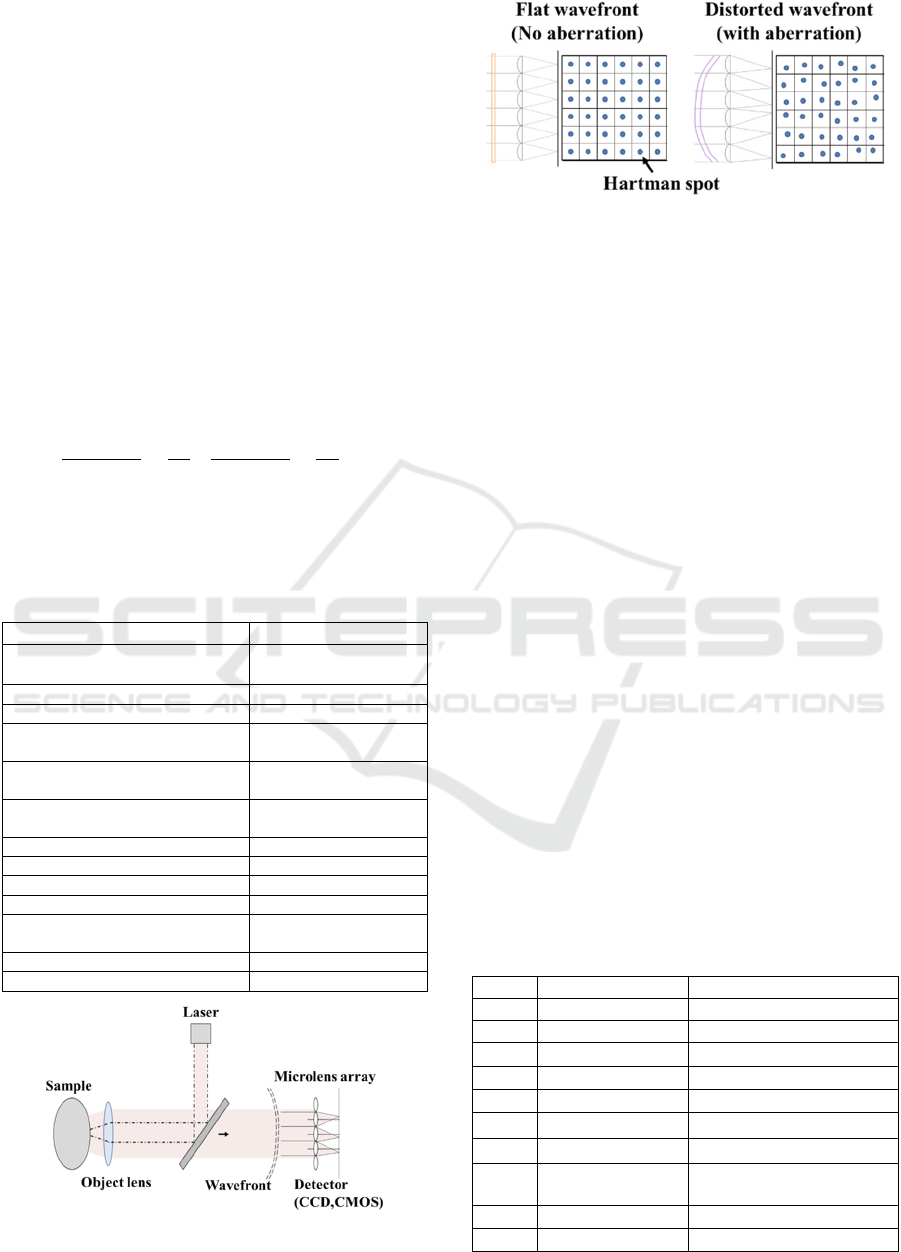
to the imaging element. As shown in Figure 2, if there
is no distortion in the wavefront of the measurement
object, equally spaced focused spots are formed on
the imaging surface according to the arrangement of
the microlenses. On the other hand, if the wavefront
is disturbed due to a phase change caused by the
measurement object, the incident direction of the light
beam changes due to the arrangement of each lens,
resulting in irregular Hartmann spot positions.
Information about the shape of the incident wavefront
can be obtained from this change in position. Its
information of the Hartmann spots is then expressed
using Zernike polynomials, which are orthogonal
polynomials defined on a unit circle. Each Zernike
polynomial represents an independent wavefront
shape, corresponding to a specific type of aberration
(Matsuyama, 2004).
Evaluation of Resin Molds Change in Design and Polymerization by Using a Wavefront Sensor
21
Using Zernike polynomials 𝑍
𝑛
𝑚
𝑋,𝑌 , the
incident equiphase surface is expressed as shown in
Equation (1).
𝑊
𝑋,𝑌
𝑐
𝑖
2
𝑗
1
𝑖
𝑗
0
𝑛
𝑖0
𝑍
𝑖
2
𝑗
1
𝑋,𝑌
(1)
𝑐
𝑖
2𝑗1
represents the coefficients corresponding to
each term of the Zernike polynomials. These
coefficients indicate the contribution of each term to
the wavefront aberration. The larger the value of
𝑐
𝑖
2𝑗1
is, the greater the influence of the corresponding
Zernike term on the shape of the wavefront is.
If the displacement of the Hartmann spot is
represented by
∆𝑥,∆𝑦
and the focal length of the
microlens array is 𝑓, the relationship of the wavefront
position shift is expressed in Equation (2).
𝜕𝑊𝑋,𝑌
𝜕𝑋
∆𝑥
𝑓
𝜕𝑊𝑋,𝑌
𝜕𝑌
∆𝑦
𝑓
(2)
The wavefront can be reconstructed by
substituting Equation (1) into Equation (2) to obtain
the Zernike coefficients.
Table 1: Specification of the wavefront sensor.
Index Paramete
r
Manufacturer
Pulstec Industrial Co.,
Ltd.
Model LUCUS
Measurement wavelength 589 nm
Measurement range of
concave surface
4.3 mm~46.5 mm
Measurement range of
convex surface
5.7 mm~9.5 mm
Tolerance of wavefront
incident angle
±1.1 deg
Wavefront measurement accuracy 1/100
λ
Repeatability 1/200
λ
Radius measurement accuracy ±10
μ
m
Number of microlens array 108×80
The focal length of
the microlens array
4 mm
Data update rate 6 Hz
Focal lens NA 0.81
Figure 1: Wavefront sensor principle.
Figure 2: Relationship between wavefront and Hartmann
spot.
2.2 Zernike Polynomials
In this study, the resin mold was evaluated using
Zernike coefficients. The device can output 36 Zernike
coefficients, but this study focused on the unique ones.
Zernike coefficients are widely used in ophthalmic
optics and are often employed to assess ocular
aberrations (Salmon, 2006). The Zernike polynomials
were standardized by fringe order (Niu, 2022). Among
the Zernike coefficients shown in Table 2, "Z04" and
"Z07" exhibited the largest changes.
"Z04" indicates astigmatism, which is one of the
five types of Seidel aberrations (spherical aberration,
coma aberration, astigmatism, field curvature, and
distortion aberration) (Carvalho, 2005). When the
orthogonal coordinates in an optical system are
defined as the horizontal and vertical planes,
astigmatism occurs when there is a shift between the
focal positions of the light beam in these planes. The
resulting image can be an ellipse, a circle, or a line. In
optical lenses, astigmatism arises when the horizontal
and vertical radii of curvature differ.
"Z07" indicates coma aberration, which occurs
when light incident at an angle does not converge to
a single point on the image plane, resulting in a
conical image. This aberration is influenced by the
distance from the optical axis, significantly affecting
how the image appears through the lens.
Table 2: Zernike polynomials.
Term Pol
y
nomial Aberration
Z01
ρ𝑐𝑜𝑠θ
x-Tilt
Z02
ρ𝑠𝑖𝑛θ
y-Tilt
Z03
2ρ
2
1
Defocus
Z04
ρ
2
𝑐𝑜𝑠2θ
0°Primary astigmatism
Z05
ρ
2
𝑠𝑖𝑛2θ
45°Primary astigmatism
Z06
3ρ
2
2ρ𝑐𝑜𝑠θ
Primary x-coma
Z07
3ρ
2
2ρ𝑠𝑖𝑛θ
Primary y-coma
Z08
6ρ
4
6ρ
2
1
Primary spherical
aberration
Z09
ρ
3
𝑐𝑜𝑠3θ
Secondary x-trefoil
Z10
ρ
3
𝑠𝑖𝑛3θ
Secondary y-trefoil
PHOTOPTICS 2025 - 13th International Conference on Photonics, Optics and Laser Technology
22
Both of these aberrations are critical components
in the creation of contact lenses, and the
manufacturing process must be designed to minimize
their presence. By understanding that these
aberrations exist in resin molds, their relationship to
contact lens aberrations can be clarified.
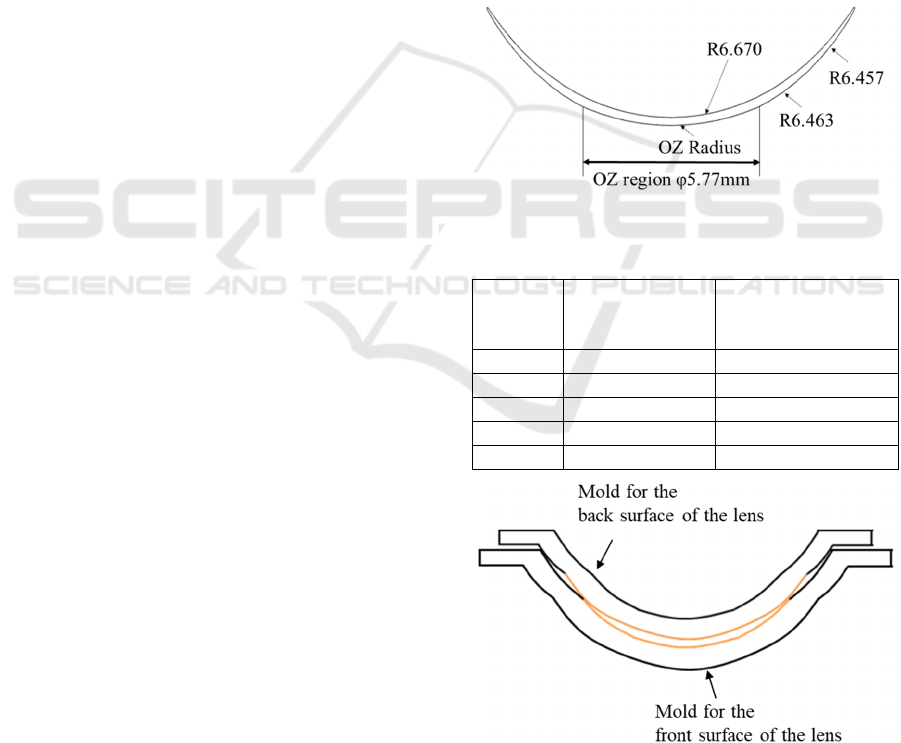
2.3 Measurement Sample
2.3.1 Contact Lens
Figure 3 shows an o
verview of the contact lens.
In this
study, the contact lens and the resin mold were
measured. The refractive power of the lens is adjusted
by designing the radius of curvature. This range is
called the Optical Zone (OZ) and plays an important
role in vision correction with contact lenses. The lens
made in this study was designed with an OZ of φ5.77
mm, and the radius of curvature was variable (OZ
radius). The five different curvature radii were
prepared in Table 3. The design outside the OZ was
common to all patterns, with the radius of curvature
changed in two stages. The back surface was designed
with a single radius of curvature, R = 6.670[mm],
which was also common to all patterns.
The contact lenses were measured using the
NIMO TR1504 manufactured by Lambda-X
Ophthalmic. This device employs a technology that
combines interferometry and phase-shifting
technology using the Phase-Shifting Schlieren (PSS)
method (Joannes, 2003). It can measure the power
profile and wavefront aberration of contact lenses.
Although this device can’t measure wavefront
measurement of resin molds, it’s useful for evaluating
contact lenses.
2.3.2 Resin Mold
Figure 4 shows an overview of the fitted state of the
resin molds. The design of the concave side for the
lens front (the orange part in the figure) was valuable
as shown in Table 3. And the measurement results
with the interferometer are presented as well. The OZ
radius was adjusted in 0.500 mm increments. The
measurement range was diameter of 5 mm from the
center of the concave surface. All resin molds for the
back surface maintained the same design. The
measurement range of the convex surface was the
same as the concave one. The reflectivity of the mold
may potentially affect the measurements taken by the
wavefront sensor. Adjusting the laser power on the
measurement device, it is possible to eliminate the
influence of reflectivity. In this study, the saturated
pixels of the Hartmann spot were defined, and the
laser power was adjusted to ensure that the number of
pixels was within the specified range.
2.3.3 Polymerization
Contact lens raw materials are liquid, so solid contact
lenses are formed through polymerization.
Polymerization is carried out after pouring the raw
materials into a resin mold and fitting it into the mold.
The shape of a contact lens is defined by the gap
between two resin molds. However, if the molds
deform during polymerization, it can greatly impact
the final lens shape.
The polymerization is crucial in forming contact
lenses, and since it’s closely related to their quality,
polymerization was conducted in nitrogen at 105±5℃
for 120 minutes, which simulates the conditions
during actual polymerization.
Figure 3: Overview of the contact lens.
Table 3: Specification of resin molds.
Sample
No.
Value of OZ
radius[mm]
Measurement of
Interferometer
[m
m
]
A 6.500 6.476
B 7.000 6.975
C 7.500 7.441
D 8.000 7.899
E 8.500 8.378
Figure 4: Overview of the resin mold.
Evaluation of Resin Molds Change in Design and Polymerization by Using a Wavefront Sensor
23

3 RESULT
3.1 Zernike Coefficients
Wavefront measurements were performed on five
samples with different OZ radius design values. Five
measurements were taken for each sample. As a result,
for Z07, the design-dependent changes in the Zernike
coefficients were confirmed before and after
polymerization. The comparison results before and
after polymerization are presented shown in Figure
5(a) ~ (c).
Figure 5(a) shows the measurement results before
polymerization. The horizontal axis represents the
Zernike coefficient terms, and the vertical axis
displays the Zernike coefficient values. This device
can output 36 Zernike coefficients. However, since
there is almost no change from Z10 onwards, they
were judged to be unnecessary for evaluating the
resin mold. It was found that Z04 exhibited different
values depending on the OZ radius design. Similarly,
the difference in Z07 represented different designs.
Although the difference in the measurement results
due to the design for Z06 was small, it was still
possible to observe the variation in the results, while
Z10 didn’t change regardless of the design.
Figure 5(b) shows the measurement results for the
resin mold after polymerization. The sample shown
in Figure 5(a) was heat-treated under the conditions
specified in Section 2.3.3, and after the
polymerization, it was measured again using a
wavefront sensor. The absolute values of each
coefficient became larger than before the
polymerization. Z07 changed regularly. Z04 and Z05
changed significantly, but the results showed a large
variance.
Figure 5(c) shows the changes in each coefficient
before and after polymerization. The changes were
calculated by subtracting the Zernike coefficient
values before polymerization from after
polymerization. It was found that the coefficient
values were generally larger after polymerization.
Z04's values shifted in the negative direction,
although there was some variance. Z07's values
increased overall, showing a tendency for the amount
of change in value to depend on the OZ radius design.
For the other values, Z05 exhibited a larger variance,
while the other coefficients showed that the Zernike
coefficients increased in absolute values.
Figure 5(a): Zernike coefficients before polymerization.
Figure 5(b): Zernike coefficients after polymerization.
Figure 5(c): Change in subtraction for Zernike coefficients.
PHOTOPTICS 2025 - 13th International Conference on Photonics, Optics and Laser Technology
24
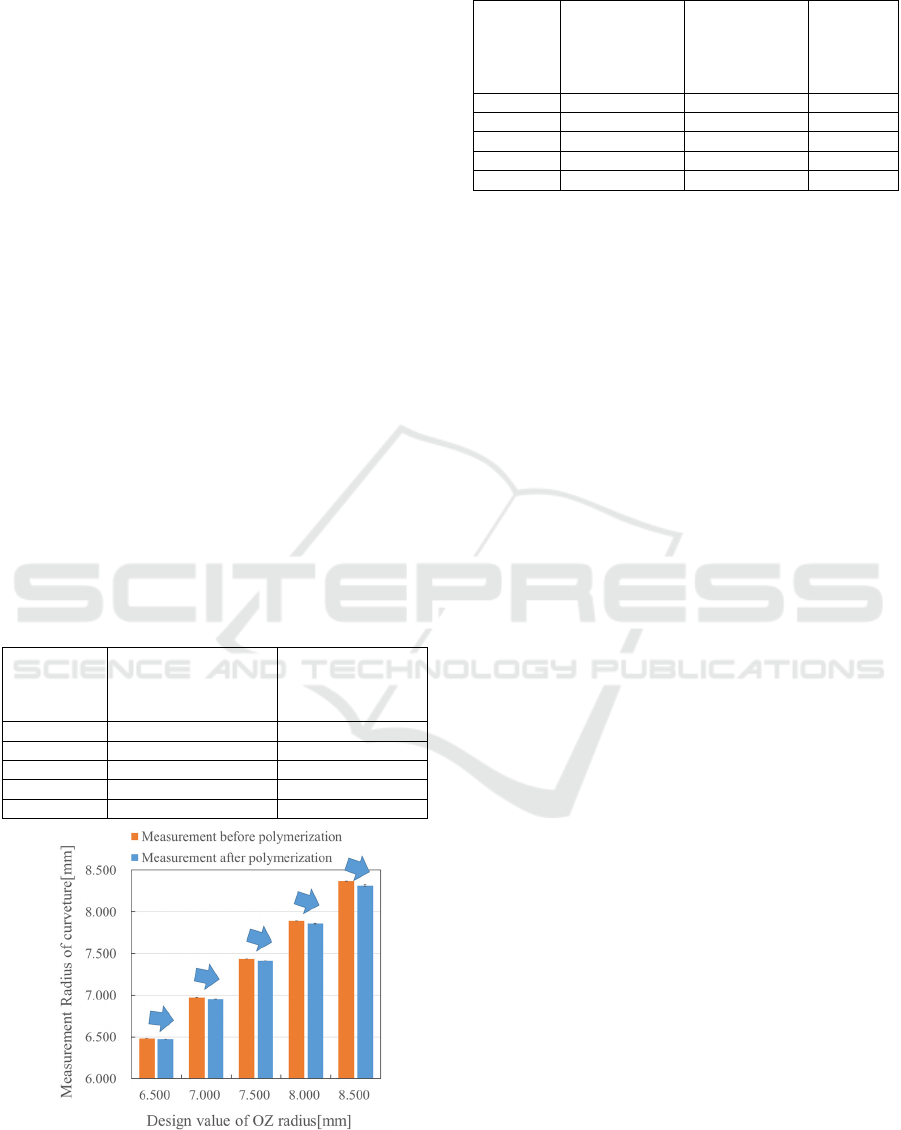
3.2 Oz Radius
Figure 6 shows the measurement results of the radius
of curvature compared to the design value of the OZ
radius of the resin mold. The horizontal axis
represents the design value, while the vertical axis
represents the measured value. This comparison
illustrates the differences before and after
polymerization for each design.
Table 4 presents the measurement results and
deviations from the design value. The radius of
curvature was consistently smaller than the design
value, with the deviation increasing as the design
value of OZ radius increased.
Table 5 shows the measurement results and
shrinkage rates of the radius of curvature before and
after polymerization. The radius of curvature before
polymerization was equivalent to the values with the
interferometer shown in Table 3. And it was found
that the radius of curvature shrank further after
polymerization compared to before polymerization.
The measurement results also indicated that the larger
the design value of the OZ radius is, the greater the
shrinkage rate is, too. The polymerization-induced
shrinkage further increased the difference between
the radius of curvature of the resin mold and the
design value.
Table 4: Difference in design value.
Value of
OZ radius
[mm]
Measurement
OZ radius before
polymerization
[mm]
Difference from
design value [%]
6.500 (A) 6.482 0.3%
7.000 (B) 6.976 0.3%
7.500 (C) 7.439 0.8%
8.000 (D) 7.895 1.3%
8.500 (E) 8.371 1.5%
Figure 6: Change in each measurement radius.
Table 5: Shrinkage rate due to polymerization.
Value of
OZ radius
[mm]
Measurement
OZ radius
before
polymerization
[mm]
Measurement
OZ radius after
polymerization
[mm]
Shrinkage
Rate
[%]
6.500 (A) 6.482 6.471 0.17%
7.000 (B) 6.976 6.956 0.29%
7.500 (C) 7.439 7.411 0.38%
8.000 (D) 7.895 7.858 0.47%
8.500 (E) 8.371 8.313 0.69%
4 DISCUSSION
In this study, we proposed the method using the
wavefront sensor to evaluate resin molds used in
contact lens manufacturing. Specifically, we
measured the Zernike coefficients and radius of
curvature for five types of resin molds with different
curvature radii in the OZ range, to assess the impact
of each design difference on aberrations. We also
compared the measurement results before and after
the polymerization performed during the
manufacturing process to observe changes in
aberrations and the radius of curvature.
The difference in the curvature radius of the OZ
range caused a significant change in Z07 (coma
aberration), clearly indicating that design variations
affect aberrations. In contrast, changes in Z04
(astigmatism) will be largely influenced by
polymerization conditions, likely due to the
characteristics of the material.
Furthermore, after comparing the changes in
Zernike coefficients, we found the overall increase in
aberration values with the most significant change
observed in Z07. This means that the interaction
between design and polymerization has an influence
on the aberrations of the resin mold. As similar study,
Cheng et al. (Cheng, 2020) also used a wavefront
sensor to evaluate aberrations and analysed the
impact of molding errors on the optical performance
of lenses. Both studies share the common approach of
evaluating molding errors based on Zernike
coefficients and are considered effective methods for
quantitatively assessing molding errors during the
manufacturing process.
In addition, contact lenses were produced using
the resin molds made in this study, and their
measurements were performed using the NIMO
TR1504. The evaluation range was φ5.0 mm. Table 6
shows the measured radius of curvature of the resin
molds. Each lens refractive power was calculated
using that radius of curvature. Furthermore, each
power of contact lenses was measured by NIMO. The
Evaluation of Resin Molds Change in Design and Polymerization by Using a Wavefront Sensor
25
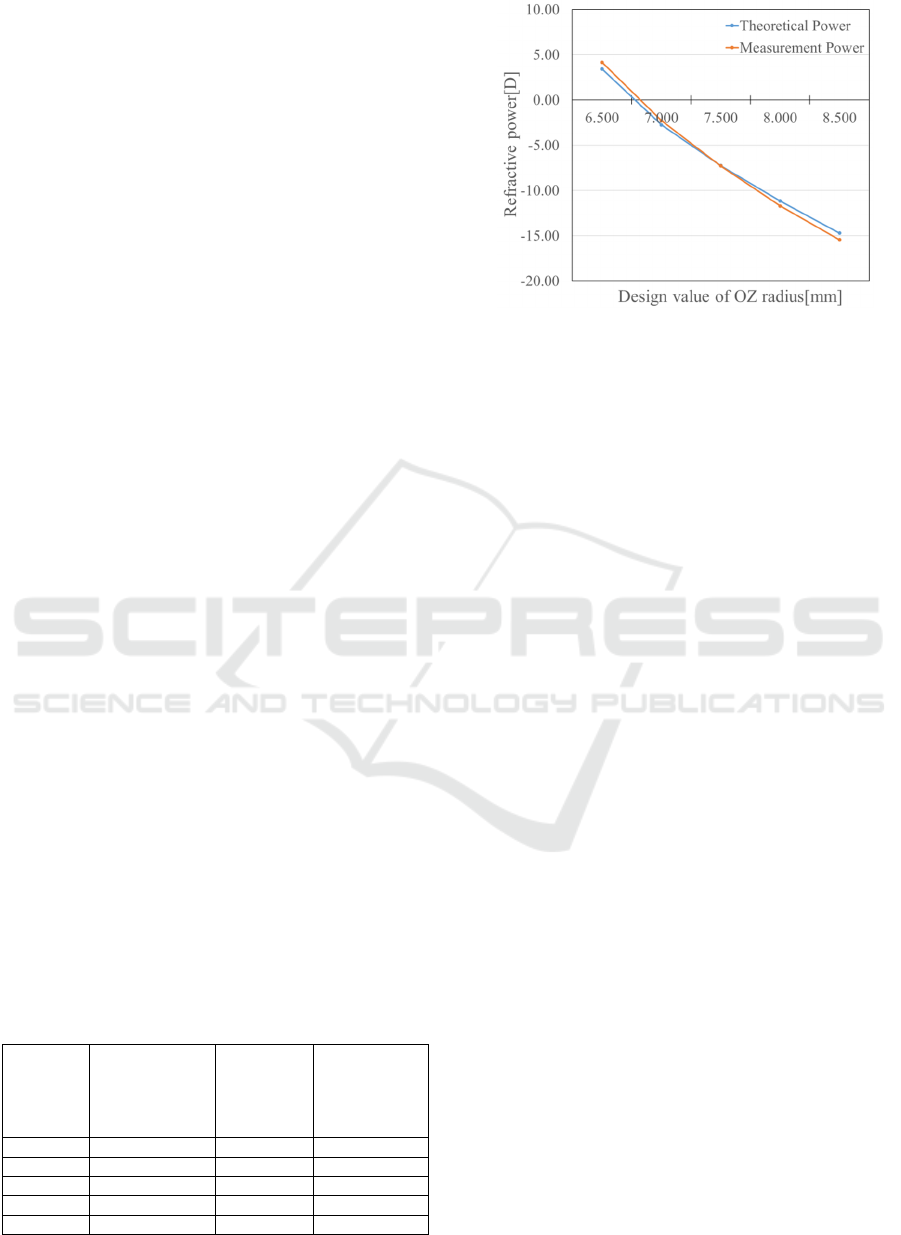
data on Table 6 are also plotted in Figure 7. The
horizontal axis represents the design value of the
radius of curvature, and the vertical axis is the
refractive power. Both the theoretical lens power and
the measured lens power were shown on the graph.
The results of this study indicate that sample C
had almost no error in lens power, confirming that the
lens was produced as designed. In contrast, samples
A and E showed differences from the design values.
The difference in the radius of curvature between the
front and back surfaces of the resin mold (maximum
and minimum values) likely caused an imbalance in
the resin thickness between the center and periphery,
which affected the shrinkage. On the other hand, the
resin thickness of sample C showed a thickness
difference of less than 10μm between the center and
periphery, which was more uniform compared to the
other samples. As a result, sample C was the most
accurately produced according to the design. Based
on these findings, to further investigate the effects of
polymerization, it is necessary to accurately measure
the thickness of the resin mold. As a method for
measuring transparent resin mold, there are some
reports about the measurement method of contact
lenses with Optical Coherence Tomography (OCT)
principles (Saeki, 2020, 2021). OCT measurements
can provide data on the thickness of the resin mold
and the front and back curvature radii inside and
outside the OZ range. While the wavefront sensor can
measure wavefront shape and curvature radius with
high precision, it cannot measure the thickness or the
shape of the back surface of the resin mold. The
impact of resin thickness is a factor in the inability to
manufacture the lenses as designed. Therefore, by
adding data on changes in resin thickness obtained
through OCT measurements, we can clarify the
influence of resin thickness on the lenses. By
combining the results of this study with OCT data, it
becomes possible to assess the impact of the non-
uniformity of resin thickness on shrinkage and lens
power. These results can provide appropriate
feedback into the design as manufacturing factors.
Table 6: Comparison of theoretical and measured values of
OZ radius and refractive power.
Value of
OZ radius
[mm]
Measurement
OZ radius after
polymerization
[mm]
Theoretical
value of
refractive
power
[D]
Measurement
refractive
power
[D]
6.500 (A) 6.471 +2.73 +4.16
7.000 (B) 6.956 -2.76 -2.28
7.500 (C) 7.411 -7.26 -7.29
8.000 (D) 7.858 -11.16 -11.72
8.500 (E) 8.313 -14.72 -15.44
Figure 7: Variation of theoretical and measured values of
OZ radius and refractive power.
In this study, the evaluation was limited to five
types of resin molds, but more diverse designs and
different molding conditions are necessary for a
comprehensive understanding. Additionally,
experiments under varying temperatures and
durations could provide more detailed insights into
the influence of polymerization. Although the
wavefront sensor used in this study enables highly
precise measurements, comparative verification with
other measurement methods remains a future
challenge.
It is anticipated that the evaluation method using
the wavefront sensor will be applied to other
materials and molding processes, further expanding
its general applicability. In particular, this method can
be applied to the evaluation of transfer accuracy in
precise resin molding such as medical devices. Cheng
et al.'s research (Cheng, 2020) evaluated aberrations
in the manufacturing process of mobile phone camera
lenses and contributed to the optimization of
manufacturing conditions. By optimizing the
manufacturing process based on the Zernike
coefficients obtained in this study, the mass
production of higher-quality contact lenses will
become feasible. In this way, the wavefront sensor-
based evaluation method can be applied to quality
control across various optical products, including
contact lenses.
5 SUMMARY
In this study, the wavefront sensor was used to
evaluate resin molds utilized in contact lens
manufacturing. Five types of resin molds that have
each different curvature radius in the OZ range were
measured. Wavefront measurements were also
PHOTOPTICS 2025 - 13th International Conference on Photonics, Optics and Laser Technology
26

conducted before and after polymerization to observe
their changes.
The clear trend was observed in the measurement
results due to differences of the radii of curvature in
the OZ range, and specific Zernike coefficients were
identified. It was also confirmed that the certain
Zernike coefficients Z04 and Z07 changed after
polymerization.
Additionally, the measurement results for the
radius of curvature showed values smaller than the
design values even before polymerization.
Polymerization caused the resin molds to shrink more,
making the radius of curvature even smaller. It was
found that the larger the design value is, the greater
the shrinkage rate is, too, which is leading to a larger
difference from the design value.
The results for the radius of curvature were shown
to be consistent with those obtained using a laser
interferometer, demonstrating that changes in
aberration due to differences in the resin mold design
could be effectively evaluated using Zernike
coefficients of Z01 - Z10 as parameters. This suggests
that the wavefront sensor is a useful new method for
evaluating those resin molds.
However, for the contact lenses produced using
the resin molds from this study, there was a difference
between the lens power derived from the measured
radius of curvature of the resin molds and the actual
lens power measured by NIMO. The exact cause
related to the transfer accuracy from the resin mold to
the contact lens remains unclear and will be a subject
of future investigation. There have already been
reports on methods for evaluating the shape of contact
lenses using OCT (Saeki, 2021). By combining the
results from these methods, further evaluation of the
lenses will be investigated the correlation between the
transfer accuracy of the resin mold and the final
contact lens.
REFERENCES
Rosato, D. V., Rosato, D. V., & Rosato, M. G. (2000).
Injection molding handbook. Kluwer Academic
Publishers.
Ciofu, C., & Mindru, D. T. (2013). Injection and micro
injection of polymeric plastics materials: A review.
International Journal of Modern Manufacturing
Technologies, 5(2), 21-30.
Oswald, T. A., Turng, L.-S., & Gramann, P. J. (2008).
Injection molding handbook (2nd ed.). Hanser Verlag.
Chen, C.-C. A., et al. (2017). Study on injection molding of
shell mold for aspheric contact lens fabrication.
Procedia Engineering, 184, 344–349.
Chang, T. C., & Faison, E. (2001). Shrinkage behavior and
optimization of injection molded parts studied by the
Taguchi method. Polymer Engineering and Science,
41(5), 703-709.
Atchison, D. A. (2005). Recent advances in measurement
of monochromatic aberrations of human eyes. Clinical
and Experimental Optometry, 88(1), 5-27.
Cheng, X., Yan, L., Liu, L., Cao, J., Lin, Y. J., & Hao, Q.
(2020). Fabrication-error analysis of injection-molded
aspheric elements using typical aberration terms
in transmitted wavefront with Shack–Hartmann
wavefront-sensing measurement. Optical Engineering,
59(12), 123102.
Matsuyama, T., & Ujike, T. (2004). Orthogonal aberration
functions for microlithographic optics. Optical review,
11(4), 199-207.
Salmon, T. O., & van de Pol, C. (2006). Normal-eye
Zernike coefficients and root-mean-square wavefront
errors. Journal of Cataract & Refractive Surgery,
32(12), 2064-2074.
Niu, K., & Tian, C. (2022). Zernike polynomials and their
applications. Journal of Optics, 24(12), 123001.
Carvalho, L. A. (2005). Accuracy of Zernike polynomials
in characterizing optical aberrations and the corneal
surface of the eye. Investigative ophthalmology &
visual science, 46(6), 1915-1926.
Joannes, L., Dubois, F., & Legros, J.-C. (2003). Phase-
shifting schlieren: High-resolution quantitative
schlieren that uses the phase-shifting technique
principle. Applied Optics, 42(25), 5046–5053.
Saeki, K., Huyan, D., Sawada, M., Sun, Y., Nakamura, A.,
Kimura, M., ... & Shiina, T. (2020). Measurement
algorithm for real front and back curved surfaces of
contact lenses. Applied Optics, 59(28), 9051-9059.
Saeki, K., Huyan, D., Sawada, M., Nakamura, A., Kubota,
S., Uno, K., ... & Shiina, T. (2021). Three-dimensional
measurement for spherical and nonspherical shapes of
contact lenses. Applied optics, 60(13), 3689-3698.
Saeki, K., Huyan, D., Nakamura, A., Kubota, S., Uno, K.,
Ohnuma, K., & Shiina, T. (2021). 2D and 3D
Measurement Algorithms for Real Front and Back
Curved Surfaces of Contact Lenses. In PHOTOPTICS
(pp. 73-80).
Evaluation of Resin Molds Change in Design and Polymerization by Using a Wavefront Sensor
27
