
Uncertainty Estimation for Super-Resolution Using ESRGAN
Maniraj Sai Adapa, Marco Zullich
a
and Matias Valdenegro-Toro
b
Department of AI, University of Groningen, Nijenborgh 9, 9747AG, Groningen, The Netherlands
manirajadapa@gmail.com, {m.zullich, m.a.valdenegro.toro}@rug.nl
Keywords:
Super Resolution, Uncertainty Estimation, Computer Vision.
Abstract:
Deep Learning-based image super-resolution (SR) has been gaining traction with the aid of Generative Adver-
sarial Networks. Models like SRGAN and ESRGAN are constantly ranked between the best image SR tools.
However, they lack principled ways for estimating predictive uncertainty. In the present work, we enhance
these models using Monte Carlo-Dropout and Deep Ensemble, allowing the computation of predictive un-
certainty. When coupled with a prediction, uncertainty estimates can provide more information to the model
users, highlighting pixels where the SR output might be uncertain, hence potentially inaccurate, if these esti-
mates were to be reliable. Our findings suggest that these uncertainty estimates are decently calibrated and can
hence fulfill this goal, while providing no performance drop with respect to the corresponding models without
uncertainty estimation.
1 INTRODUCTION
Super-Resolution (SR) is an important computer vi-
sion task, where a low-resolution image is upscaled
to a higher resolution one. It is fundamentally an in-
verse problem, where missing information needs to
be filled by making assumptions encoded in a model,
which can lead to errors, as shown in Figure 1.
Many efforts are made to improve SR models to
increase their accuracy, but any model will tend to
produce erroneous outputs if the input is outside the
training distribution. An important task is then pro-
vide feedback to a human user on which pixels or re-
gions of the SR output image are likely to be incorrect
or imprecise.
In this paper we combine two uncertainty esti-
mation methods with a state of the art SR model—
Super Resolution Generative Adversarial Network
(SRGAN) (Ledig et al., 2017) and Enhanced SR-
GAN (ESRGAN) (Wang et al., 2018)—, to build a SR
model with epistemic uncertainty estimation, which
outputs a SR image and a uncertainty map, indicating
which regions are likely to be incorrect. We evalu-
ate the performance of uncertainty estimation, noting
that an ensemble of 5 ESRGAN generators works the
best, and provide extensive quantitative and qualita-
tive results, showcasing the usefulness of uncertainty
estimation in the SR domain.
a
https://orcid.org/0000-0002-9920-9095
b
https://orcid.org/0000-0001-5793-9498
We posit our results show that uncertainty estima-
tion, in particular ensembles, can provide useful feed-
back to a human using SR results, and the standard
deviation produced by the model can work as a per-
pixel error proxy.
The contributions of this paper are: we build SR-
GAN and ESRGAN models with uncertainty estima-
tion, we evaluate uncertainty performance in several
well known datasets, and validate that model standard
deviation can be used as a proxy for test time error.
This work expands the state of the art by building
simple combinations of a state of the art SR model
(ESRGAN) with Monte Carlo Dropout and Ensem-
bles, with an explicit focus on qualitative and quan-
titative uncertainty estimation, showing that uncer-
tainty can be used as a proxy for error at inference
time, for natural color images. Note that our work is
not about improving the super-resolution task perfor-
mance, but we argue that fundamentally any super-
resolution model will make mistakes at some point,
especially with out of distribution images, and uncer-
tainty estimation is a key component to notify the end
user about these mistakes via higher per-pixel uncer-
tainty.
2 STATE OF THE ART
The literature for super resolution uncertainty is rel-
atively underexplored. Kar and Biswas (Kar and
Adapa, M. S., Zullich, M. and Valdenegro-Toro, M.
Uncertainty Estimation for Super-Resolution Using ESRGAN.
DOI: 10.5220/0013150700003912
Paper published under CC license (CC BY-NC-ND 4.0)
In Proceedings of the 20th International Joint Conference on Computer Vision, Imaging and Computer Graphics Theory and Applications (VISIGRAPP 2025) - Volume 2: VISAPP, pages
367-374
ISBN: 978-989-758-728-3; ISSN: 2184-4321
Proceedings Copyright © 2025 by SCITEPRESS – Science and Technology Publications, Lda.
367

Image SR Uncert Overlay Error vs Std Crop SR Crop Uncert
Image SR Uncert Overlay Error vs Std Crop SR Crop Uncert
Image SR Uncert Overlay Error vs Std Crop SR Crop Uncert
Figure 1: Ensemble Results using ESRGAN with Uncertainty, including error vs standard deviation plots. This figure shows
how SR uncertainty correlates with SR reconstruction errors and can be used to detect possible errors at inference time. Error
vs Std plots show that uncertainty correlates very well with absolute errors at the pixel level.
Biswas, 2021) use stochastic Batch Normalization for
uncertainty estimation in deep SISR models. Liu et
al. (Liu et al., 2023) estimate uncertainty in spectral
domain instead of the common spatial domain for the
DDL-EDSR model.
SR Uncertainty outside of natural images is also
present. Tanno et al (Tanno et al., 2017) use varia-
tional dropout for SR of 3D Diffusion MRI brain im-
ages, while Song and Yang (Song and Yang, 2023)
use Bayesian Neural Networks for SR in wave array
imaging and making separate predictions of aleatoric
and epistemic uncertainty.
Most previous research on SR uncertainty focuses
on improving SR accuracy using uncertainty estima-
tion ((Kar and Biswas, 2021) and (Liu et al., 2023)),
or are applied to domains outside of natural images.
There is often not a deep focus on uncertainty quan-
tification for SR and its consequences.
We perform a deep evaluation of uncertainty qual-
ity for SR, as we assume that SR models will always
make errors in out of distribution settings, and per-
pixel output uncertainty can guide the human user to
detect these errors.
3 ESRGAN WITH UNCERTAINTY
3.1 Image SR Using GAN-Based Models
SRGAN (Ledig et al., 2017) and ESRGAN (Wang
et al., 2018) have emerged as industry-standard ar-
chitectures for image super-resolution. Both tech-
niques make use of a Generative Adversarial Network
(GAN) framework, whereas a generator is trained
to super-resolve low-resolution images, while a dis-
criminator is simultaneously trained to distinguish
between real high-resolution images and the output
of the generator. SRGAN demonstrates the potential
of GANs for super-resolution by utilizing an adver-
sarial loss versus the discriminator. Building upon
these foundations, ESRGAN further enhances the ap-
proach with improvements in both generator and dis-
criminator architecture, focusing on optimizing per-
ceptual quality. The success of SRGAN and ESR-
GAN has made them widely adopted baseline ap-
proaches, with code and pre-trained models readily
available. While these pre-trained GAN models offer
strong performance, training customized models from
scratch can provide advantages when exploring spe-
cific techniques like uncertainty estimation and also
provide architectural similarity.
Formally, we call D the discriminator and G the
generator. Each training data point is composed by
a high-resolution image Y ∈ R
h×w
acting as ground
truth and its low-resolution equivalent X ∈ R
h
′
×w
′
,
with h > h
′
, w > w
′
, acting as input. Depending on
the specific dataset employed, X is usually obtained
from Y by applying a specific downsampling tech-
nique, such as bicubic interpolation. The generator
G takes as input X and produces a super-resolved im-
age
ˆ
Y ∈ R
h×w
. The discriminator D is fed a high-
resolution image (either Y or
ˆ
Y ) and outputs a scalar
r ∈ (0, 1), which can be interpreted as a probability
VISAPP 2025 - 20th International Conference on Computer Vision Theory and Applications
368

value of that image being a real high-resolution im-
age.
3.1.1 SRGAN
The discriminator of the SRGAN plays a crucial role
in adversarial training. As the discriminator becomes
effective in distinguishing the super-resolved images,
the adversarial process forces the generator to pro-
duce images that are increasingly realistic.
The discriminator is a simple convolutional neural
network classifier that consists of a series of strided
convolution layers that are responsible for extracting
hierarchical features and a final classification layer
which produces the scalar output.
SRGAN uses a loss function for the generator
l
SRGAN
G
for improving the perceptual quality of super-
resolution results. It is composed of two objectives:
l
SRGAN
G
= l
SRGAN
perc
| {z }
perceptual loss
+10
−3
· l
SRGAN
adv
| {z }
adversarial loss
. (1)
The perceptual loss is computed on a VGG19 (Si-
monyan and Zisserman, 2014) network which is pre-
trained on Imagenet(Deng et al., 2009). The goal of
this component is to enforce a realistic output which
can be identified as realistic by the VGG19 model. It
is defined as the Euclidean distance between the fea-
ture representations from deeper layers of this model
for the super-resolved image and the original high-
resolution image was termed the content loss. If we
call the backbone of the VGG19 model f
VGG
, the per-
ceptual loss is:
l
SRGAN
perc
(X,Y ) = || f
VGG
(G(X))− f
VGG
(Y )||
2
2
. (2)
The intuition is that f
VGG
will project plausible
generator outputs close to the embedding of the cor-
responding ground truth image.
The adversarial loss is inspired by the original
GAN loss (Goodfellow et al., 2014), which is based
off of the binary cross entropy loss on the discrimi-
nator output. In this case, it acts only on the super-
resolved images, disregarding the real ones:
l
SRGAN
adv
(X) = − log D
θ
D
(G
θ
G
(X)). (3)
The discriminator loss is, instead, the same pro-
posed by Goodfellow et al. (Goodfellow et al., 2014)
in the original GAN paper.
3.1.2 ESRGAN
ESRGAN builds upon SRGAN, implementing sev-
eral enhancements to the generator and discrimina-
tor. Since its introduction, ESRGAN has consistently
achieved state-of-the-art results on standard bench-
marks and is regarded as one of the top-performing
single-image super-resolution methods.
The main improvement is the introduction of
residual-in-residual dense blocks (RRDBs) in the
generator to extract more image details. Each RRDB
consists of several Residual Dense Blocks (RDB). In
an RDB, the output of each convolutional layer is con-
catenated with the inputs of all subsequent layers, pro-
moting feature reuse and the learning of fine texture
details.
The features learned through each RRDB are ag-
gregated, and a global residual learning connection
is added to form the final high-dimensional feature
maps. These feature maps are then up-scaled to
higher resolution using pixel-shuffle (Shi et al., 2016).
The discriminator in ESRGAN follows the design
of a standard GAN discriminator but with some mod-
ifications. The discriminator applies the principles
of Relativistic GAN (RGAN) (Jolicoeur-Martineau,
2018) for stabilizing the training. RGANs improve
on the GAN objective by comparing the likelihood
of the super-resolved image relative to the real high-
resolution counterpart. In GANs, instead, the (abso-
lute) likelihood of the real image is used as objective
instead.
The loss function of ESRGAN utilizes a weighted
combination of three components to optimize the
tradeoff between pixel-level accuracy and perceptual
similarity. These components are, respectively, the
perceputal loss, the adversarial loss, and the percep-
tual loss:
l
ESRGAN
= λ
cont
l
ESRGAN
cont
+ λ
adv
l
ESRGAN
adv
+ λ
perc
l
ESRGAN
perc
(4)
The adversarial loss relies on the RGAN princi-
ple, thus comparing the discriminator behavior when
evaluating real and super-resolved images to the cor-
responding super-resolved or real counterpart, respec-
tively.
The content loss is now defined as a L1-norm re-
construction loss:
l
ESRGAN
cont
(X,Y ) = ||G(X) −Y ||
1
. (5)
The perceptual loss is modified from Equation (2)
by considering the L1 norm of the VGG19 embed-
dings instead of the L2 norm.
3.2 Uncertainty Estimation for
Super-Resolution
In the current work, we make use of two popular
techniques for uncertainty estimation, namely Monte-
Carlo Dropout (MCD) and Deep Ensembles (DEs).
Uncertainty Estimation for Super-Resolution Using ESRGAN
369

3.2.1 Monte Carlo Dropout
MCD (Gal and Ghahramani, 2016) is a framework
for training approximate Bayesian Neural Networks
by modifying the behavior of the regularization tech-
nique dropout (Srivastava et al., 2014). While dropout
randomly zeroes out, with a given probability p
drop
,
certain activations in a specific feature maps dur-
ing the training phase, the main intuition behind
MCD is to keep this behavior active during inference,
thus obtaining a stochastic output. Samples from
the posterior predictive distribution can be obtained
by performing M stochastic forward passes through
the model with different randomly sampled dropout
masks. The standard deviation of the predictions can
be computed as an estimate of uncertainty. A major
appeal of MCD is its ease of implementation—if the
deterministic model is already equipped with dropout
layers, no changes are needed to the underlying archi-
tecture or training process. In the case of SR, given
the M outputs
ˆ
Y
(1)
, . . . ,
ˆ
Y
(M)
, we aggregate them into
a mean output image:
µ(
ˆ
Y )
i, j
=
1
M
M
∑
m=1
ˆ
Y
(m)
i, j
,
i ∈ {1, . . . , h}, w ∈ {1, . . . , w}. (6)
With
ˆ
Y (X) = G(X) being one forward pass of the gen-
erator. Similarly, we can compute a per-pixel standard
deviation:
σ(
ˆ
Y )
i, j
=
s
1
M
2
M
∑
m=1
(
ˆ
Y
(m)
i, j
− µ(
ˆ
Y )
i, j
)
2
,
i ∈ {1, . . . , h}, w ∈ {1, . . . , w}. (7)
3.2.2 Deep Ensembles
DEs are composed of M models with the same ar-
chitecture, trained on the same dataset, but starting
from different random initializations of the parame-
ters. At inference time, the predictions can be ag-
gregated analogously to MCD, as shown in Equa-
tions (6) and (7) by taking into consideration that
the number of samples is now equivalent to the num-
ber of components in the ensemble. Despite not be-
ing approximate Bayesian Neural Networks—the out-
put of the M components are always deterministic—
, DEs are often treated as the most reliable Deep
Learning method for uncertainty estimation (Laksh-
minarayanan et al., 2017). This is especially true for
the detection of Out-of-Distribution (OOD) data: for
familiar, in-distribution data, the M components will
likely agree on their prediction, while, for OOD data,
the predictions will likely be random; even in case
Table 1: Comparison of Baseline and Uncertainty Estima-
tion Techniques on Set 5 and Set 14 datasets.
Set 5 Set 14
Uncert PSNR SSIM PSNR SSIM
SRGAN
None 29.10 0.8289 25.59 0.7232
MCD 28.25 0.8117 24.72 0.7156
Ensemb 29.25 0.8244 25.81 0.7245
ESRGAN
None 32.02 0.8923 27.11 0.7784
MCD 32.23 0.8972 26.85 0.7611
Ensemb 32.68 0.8997 27.23 0.7692
of highly-confident single predictions, µ(
ˆ
Y ) will be a
high-entropy, smooth simplex.
3.3 Data
In the current work, we made use of several dataset
for training and evaluating SRGAN and ESRGAN.
For training, we made use of a combination of the
following datasets, which are common choices for
SR tasks: DIV2K (Agustsson and Timofte, 2017)
(1000 images), UHDSR4K (Zhang et al., 2021) (5999
images in the training split), and Flickr2K (Timofte
et al., 2017) (2650 images). For evaluating the model,
we make use of additional datasets: Microsoft COCO
(Lin et al., 2014), Set5 (Bevilacqua et al., 2012),
Set14 (Zeyde et al., 2012), Urban100 (Huang et al.,
2015), and BSD100 (Martin et al., 2001). The latter
four are small-scale, high-resolution datasets. We use
a selection of images for qualitative evaluation from
COCO, BSD100 and Urban10, and we perform quan-
titative evaluation on Set5 an Set14.
To enforce consistency in the image size, for all
datasets, we cropped the images to a common reso-
lution of 256 × 256 px to obtain a ground truth im-
age, while, to obtain the corresponding low-resolution
input, we used bicubic interpolation downsampling
with a target size of 64 × 64 px. While usually the
original data in these datasets is of much higher res-
olution (normally above 1000 px per side), we had to
reduce this to the much more achievable 256 × 256 to
limit the computational requirements of training and
running inference using MCD and DEs.
4 EXPERIMENTS
4.1 Model and Uncertainty Evaluation
We operated the evaluation of the SR quality accord-
ing to two popular metrics, Peak Signal-to-Noise Ra-
tio (PSNR) and Structural Similarity Index (SSIM).
VISAPP 2025 - 20th International Conference on Computer Vision Theory and Applications
370

The former evaluates the reconstruction quality, while
the latter is an attempt at computing a perceptual sim-
ilarity based upon structural information, luminance,
and contrast. Both of these metrics have their limita-
tions ecc ecc...
For what concerns the evaluation of the uncer-
tainty estimates, we make use of error vs. standard
deviation plots. Considering a test dataset of n units,
we compute the mean standard deviation across each
of these images. Given a generic image k ∈ {1, . . . , n},
˜
σ
(k)
=
1
h·w
∑
i, j
σ
(k)
i, j
, where i, j represent generic pixels
of this image.
We can proceed to bin the various
˜
σ’s in the
test set, calculating a corresponding error metric for
each of the images in the bin. The underlying idea
is that uncertain predictions (i.e., predictions with a
high standard deviation) should have, on average, a
high error, while confident predictions (with low stan-
dard deviation) should have a corresponding low er-
ror. This can be visualized in a chart, whereas, by
plotting the various values of error and standard devi-
ation, a clear linear ascending trend should be visible.
In our specific case, we decided to use the
per-pixel Mean Absolute Error (MAE) between the
ground truth and super-resolved image as error met-
ric.
In addition to the quantitative evaluation, we pro-
vide a qualitative assessment, both of the model per-
formance and the uncertainty estimation.
4.2 Experimental Setup
4.2.1 SRGAN
For SRGAN, we trained the generator and discrimina-
tor networks from scratch using the Kaiming normal
initialization (He et al., 2015) for the convolutional
layers. We used the Adam optimizer (Kingma and Ba,
2014) with momentum terms β
1
=0.9 and β
2
=0.999.
We set the initial learning rate to 0.0001. We also
employed data augmentation by means of (a) random
cropping, (b) random rotation by an angle of 90°,
180°, or 270°, (c) random horizontal flip, and (d) ran-
dom vertical flip. We trained both the discriminator
and the generator for a total of 300 epochs with a
batch size of 16, for a total of approximately 40 hours
of wall-time.
4.2.2 ESRGAN
The training process consisted of two phases. First,
we pre-trained the generator on lower-resolution im-
ages using the L1 reconstruction loss from Equa-
tion (5) to optimize Peak Signal-to-Noise Ratio
(PSNR). We initialized the learning rate at 0.0001.
Next, we proceed to train alternatively the dis-
criminator and generator for a total of 200 epochs,
with a batch size of 16. For this phase, we use the
Adam optimizer with learning rate 0.0001, with decay
factor of 2 after 25, 50, 100, and 150 epochs. Analo-
gously to SRGAN, we also employed data augmenta-
tion.
4.2.3 MCD and DE
In order to apply MCD for uncertainty estimation, we
modified the baseline SRGAN and ESRGAN models
by incorporating dropout layers, since these were not
included in the original implementations. We added
4 (for SRGAN) and 5 (for ESRGAN) dropout lay-
ers throughout the generator architecture with p
drop
=
0.1. In order to reduce computational requirements,
we opted for M = 10 for MCD and M = 5 for DEs.
For training the models, we used the same optimiz-
ers, hyperparameters, and data augmentation routines
employed in the original models, as illustrated in the
previous paragraphs.
4.3 SRGAN vs ESRGAN SR
Comparison
In this experiment we propose a visual compari-
son between our SRGAN and ESRGAN implemen-
tations, without applying uncertainty estimation. Fig-
ure 2 presents these results on three randomly selected
images, showcasing that ESRGAN is still superior to
SRGAN, with less artifacts and overall higher quality
super-resolution results. For all future visual experi-
ments, we will only show ESRGAN results, in partic-
ular for uncertainty estimation.
4.4 Quantitative Uncertainty Analysis
For SRGAN and ESRGAN, we compare the super-
resolution performance after applying uncertainty es-
timation, we measure the peak signal to noise ratio
(PSNR) and the structural similarity index (SSIM),
as they are standard metrics for super-resolution, over
the Set 5 and Set 14 datasets. Note that in this exper-
iment we evaluate only the mean µ(
ˆ
Y ), we evaluate
uncertainty estimation performance in the coming ex-
periments.
Table 1 shows our results. In both SR models, it is
clear that Ensembles obtains the best performance in
terms of PSRN, increasing task performance slightly
on both datasets, but this is not always reflected on
SSIM, as in some cases the baseline model without
uncertainty estimation obtains a slightly better SSIM.
In Figure 1, we use error vs standard deviation
Uncertainty Estimation for Super-Resolution Using ESRGAN
371

Orig Image +
Crop
HR
SR-
GAN
ESR-
GAN
Orig Image +
Crop
HR
SR-
GAN
ESR-
GAN
Orig Image +
Crop
HR
SR-
GAN
ESR-
GAN
Figure 2: Visual comparison of SRGAN vs ESRGAN without uncertainty estimation. “HR” indicates the 256 × 256 high-
resolution crop which is used as ground truth. ESRGAN looks qualitatively much more impressive than SRGAN: the latter’s
output is very blurry and seems unable to reconstruct fine-grained details. Conversely, the former is perceptually much closer
to the original image and displays generally fewer artifacts.
plots to evaluate uncertainty quality of ESRGAN en-
semble models. We built these plots by thresholding
the model’s standard deviation
˜
σ(
ˆ
Y ) from minimum
to maximum value across a predicted SR output, and
then computing the mean absolute error of the pixels
passing the threshold. This measures how uncertainty
predicts possible errors in the SR output and acts as a
proxy for errors for each pixel.
All examples in Figure 1 show the error increasing
with standard deviation (uncertainty), indicating that
model uncertainty is a reliable proxy for SR output
errors. This results is visually confirmed in the same
figure, as we additionally show per-pixel uncertainty
maps, where higher uncertainty values visually cor-
respond to SR results that are incorrect, like warped
text, object boundaries, and small regions on which
there is not enough information (pixels) to reconstruct
correctly.
4.5 Qualitative Uncertainty Analysis
This experiments makes a qualitative analysis of ES-
RGAN, comparing MC-Dropout and Ensembles. Fig-
ures 3, 4, and 5 display these results.
Figure 3 is particularly challenging, as upscaling
the scalp hair and beard is very difficult as it is fine
detail that is not fully present in the low-resolution
input, and both MC-Dropout and Ensembles indicate
higher uncertainty in the scalp hair and beard areas,
corresponding to more erroneous predictions.
Figures 4 and 5 show full size uncertainty maps
and crops detailing high uncertainty regions, show-
ing how upscaling made by MC-Dropout and Ensem-
bles differs, in particular ensembles seems to produce
slightly blurrier regions, but the focus crops corre-
spond to regions that are very hard to upscale (like
Baboon hair or Tennis Racket and Ball overlap), in-
cluding high frequency details that cannot be upscaled
correctly given a low-resolution image.
4.6 SR Error Detection Examples
Finally, in Figure 6, we showcase some selected ex-
amples where output uncertainty maps are particu-
larly useful to detect erroneous upscaling results. In
particular the SR algorithms struggle with fine details
like text and high frequency regular patterns. These
results complement our previous findings, from which
there is a clear conclusion: uncertainty maps pro-
duced by Ensembles can provide additional informa-
tion to a human user, to determine which SR regions
are reliable (low pixel error) and which ones are not
(high pixel error), and uncertainty maps can be used
as additional information for further use of a SR re-
sult.
5 CONCLUSIONS AND FUTURE
WORK
In the present paper we built SRGAN and ESR-
GAN models with uncertainty estimation for super-
resolution, using MC-Dropout and Ensembles. The
aim was to detect SR output regions in which these
models are more uncertain, indicating that they might
correspond to incorrect upscaling outputs. We ex-
tensively validated our proposed approach on several
datasets and over multiple facets, including a qualita-
tive analysis of SR outputs and uncertainty maps, and
quantitative metrics like error vs standard deviation
plots.
Overall, we believe our results show that un-
certainty estimation has good potential for super-
resolution applications, as human users can use uncer-
tainty maps together with the SR output to decide if
they should trust the SR image in a region-by-region
basis, as uncertainty is a proxy for super-resolution
correctness.
Limitations. Our work is limited by the selection
of uncertanity estimation methods (MC-Dropout and
Ensembles), and for datasets we used for training and
evaluation. Our aim was not to build the most precise
SR model, but to evaluate the possibilities of building
SR models with uncertainty estimation.
VISAPP 2025 - 20th International Conference on Computer Vision Theory and Applications
372
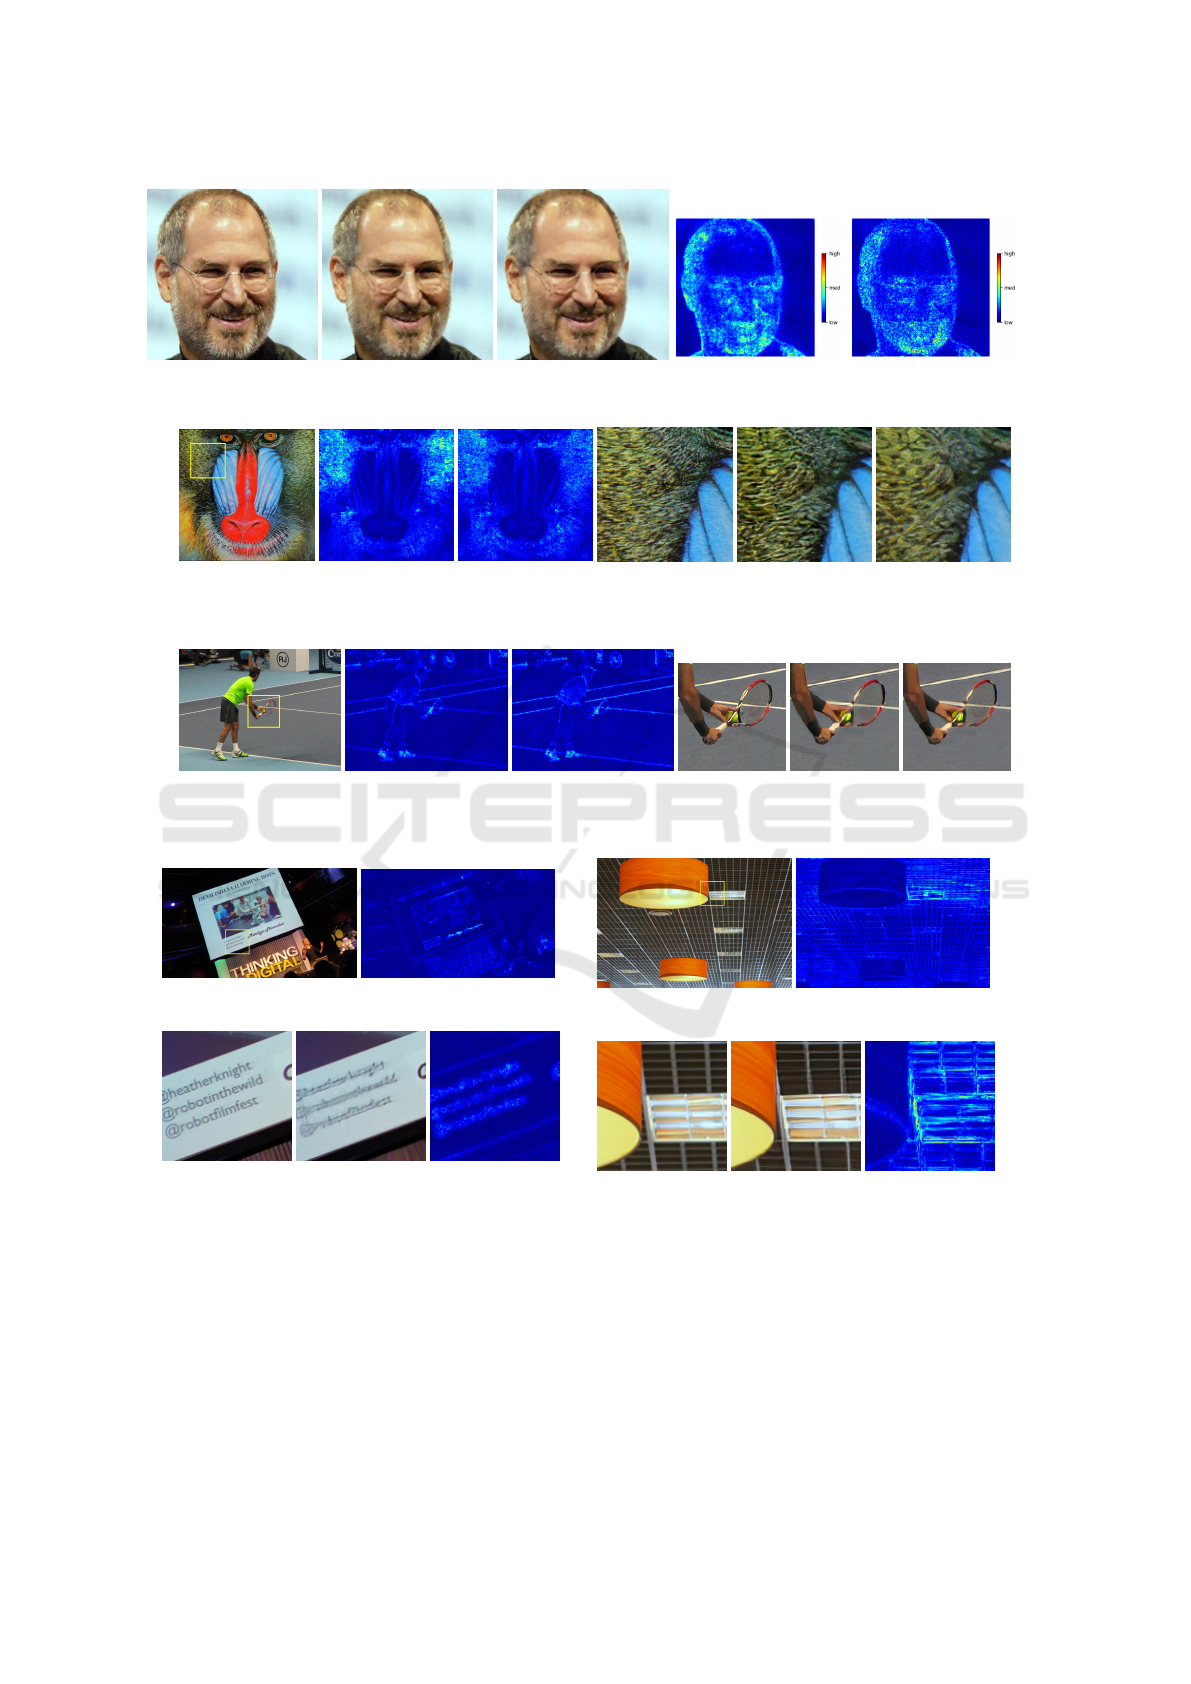
(a) Ground truth (b) MCD SR (c) Ens SR (d) MCD Uncert (e) Ens Uncert
Figure 3: Comparison of SR and its uncertainty between Ensembles and MC-Dropout.
(a) Baboon (b) MCD (c) Ensembles
(d) Crop
(PSNR/SSIM)
(e) MCD
(15.90/0.31)
(f) Ensembles
(17.72/0.36)
Figure 4: Visual comparison of Super-Resolution output and Uncertainty maps for baboon.png in Set14.
(a) COCO Image (b) MCD (c) Ensembles
(d) Crop
(PSNR/SSIM)
(e) MCD
(26.43/0.81)
(f) Ensembles
(27.14/0.84)
Figure 5: Visual comparison of Super-Resolution output and Uncertainty maps for COCO Tennis image.
(a) Image (b) SR
(c) Crop (d) SR (e) Unc Map
(f) Image (g) SR
(h) Crop (i) SR (j) Unc Map
Figure 6: Two examples of uncertainty pointing to improper reconstructions/errors.
Broader Societal Impact. SR for images and video
has a especial place in the public due to series
like Crime Scene Investigation (CSI) that popular-
ized magical thinking about super-resolution (Allen,
2007); SR models are, however, imperfect and can-
not correctly upscale every possible input, especially
when there is a large amount of missing information.
We expect that SR models with uncertainty can signal
to the user when the SR outputs are not reliable, im-
proving societal understanding of these methods and
directly indicating that models can make mistakes and
should not be trusted blindly.
Uncertainty Estimation for Super-Resolution Using ESRGAN
373

REFERENCES
Agustsson, E. and Timofte, R. (2017). Ntire 2017 challenge
on single image super-resolution: Dataset and study.
In Proceedings of the IEEE conference on computer
vision and pattern recognition workshops, pages 126–
135.
Allen, M. (2007). Reading’CSI’: Crime TV Under the Mi-
croscope. Bloomsbury Publishing.
Bevilacqua, M., Roumy, A., Guillemot, C., and Alberi-
Morel, M. L. (2012). Low-complexity single-image
super-resolution based on nonnegative neighbor em-
bedding.
Deng, J., Dong, W., Socher, R., Li, L.-J., Li, K., and Fei-
Fei, L. (2009). Imagenet: A large-scale hierarchical
image database. In 2009 IEEE conference on com-
puter vision and pattern recognition, pages 248–255.
Ieee.
Gal, Y. and Ghahramani, Z. (2016). Dropout as a bayesian
approximation: Representing model uncertainty in
deep learning. In international conference on machine
learning, pages 1050–1059. PMLR.
Goodfellow, I., Pouget-Abadie, J., Mirza, M., Xu, B.,
Warde-Farley, D., Ozair, S., Courville, A., and Ben-
gio, Y. (2014). Generative adversarial nets. Advances
in neural information processing systems, 27.
He, K., Zhang, X., Ren, S., and Sun, J. (2015). Delv-
ing deep into rectifiers: Surpassing human-level per-
formance on imagenet classification. In Proceedings
of the IEEE international conference on computer vi-
sion, pages 1026–1034.
Huang, J.-B., Singh, A., and Ahuja, N. (2015). Single image
super-resolution from transformed self-exemplars. In
Proceedings of the IEEE conference on computer vi-
sion and pattern recognition, pages 5197–5206.
Jolicoeur-Martineau, A. (2018). The relativistic discrimina-
tor: a key element missing from standard gan. arXiv
preprint arXiv:1807.00734.
Kar, A. and Biswas, P. K. (2021). Fast bayesian uncertainty
estimation and reduction of batch normalized single
image super-resolution network. In Proceedings of
the IEEE/CVF Conference on Computer Vision and
Pattern Recognition, pages 4957–4966.
Kingma, D. P. and Ba, J. (2014). Adam: A
method for stochastic optimization. arXiv preprint
arXiv:1412.6980.
Lakshminarayanan, B., Pritzel, A., and Blundell, C. (2017).
Simple and scalable predictive uncertainty estimation
using deep ensembles. Advances in neural informa-
tion processing systems, 30.
Ledig, C., Theis, L., Husz
´
ar, F., Caballero, J., Cunningham,
A., Acosta, A., Aitken, A., Tejani, A., Totz, J., Wang,
Z., et al. (2017). Photo-realistic single image super-
resolution using a generative adversarial network. In
Proceedings of the IEEE conference on computer vi-
sion and pattern recognition, pages 4681–4690.
Lin, T.-Y., Maire, M., Belongie, S., Hays, J., Perona, P.,
Ramanan, D., Doll
´
ar, P., and Zitnick, C. L. (2014).
Microsoft coco: Common objects in context. In Com-
puter Vision–ECCV 2014: 13th European Confer-
ence, Zurich, Switzerland, September 6-12, 2014, Pro-
ceedings, Part V 13, pages 740–755. Springer.
Liu, T., Cheng, J., and Tan, S. (2023). Spectral bayesian un-
certainty for image super-resolution. In Proceedings
of the IEEE/CVF Conference on Computer Vision and
Pattern Recognition, pages 18166–18175.
Martin, D., Fowlkes, C., Tal, D., and Malik, J. (2001). A
database of human segmented natural images and its
application to evaluating segmentation algorithms and
measuring ecological statistics. In Proceedings Eighth
IEEE International Conference on Computer Vision.
ICCV 2001, volume 2, pages 416–423. IEEE.
Shi, W., Caballero, J., Husz
´
ar, F., Totz, J., Aitken, A. P.,
Bishop, R., Rueckert, D., and Wang, Z. (2016). Real-
time single image and video super-resolution using an
efficient sub-pixel convolutional neural network. In
Proceedings of the IEEE Conference on Computer Vi-
sion and Pattern Recognition (CVPR), pages 1874–
1883.
Simonyan, K. and Zisserman, A. (2014). Very deep con-
volutional networks for large-scale image recognition.
arXiv preprint arXiv:1409.1556.
Song, H. and Yang, Y. (2023). Uncertainty quantification
in super-resolution guided wave array imaging using
a variational bayesian deep learning approach. NDT
& E International, 133:102753.
Srivastava, N., Hinton, G., Krizhevsky, A., Sutskever, I.,
and Salakhutdinov, R. (2014). Dropout: a simple way
to prevent neural networks from overfitting. The jour-
nal of machine learning research, 15(1):1929–1958.
Tanno, R., Worrall, D. E., Ghosh, A., Kaden, E., Sotiropou-
los, S. N., Criminisi, A., and Alexander, D. C. (2017).
Bayesian image quality transfer with cnns: exploring
uncertainty in dmri super-resolution. In Medical Im-
age Computing and Computer Assisted Intervention-
MICCAI 2017: 20th International Conference, Que-
bec City, QC, Canada, September 11-13, 2017, Pro-
ceedings, Part I 20, pages 611–619. Springer.
Timofte, R., Agustsson, E., Van Gool, L., Yang, M.-H., and
Zhang, L. (2017). Ntire 2017 challenge on single im-
age super-resolution: Methods and results. In Pro-
ceedings of the IEEE conference on computer vision
and pattern recognition workshops, pages 114–125.
Wang, X., Yu, K., Wu, S., Gu, J., Liu, Y., Dong, C., Qiao,
Y., and Change Loy, C. (2018). Esrgan: Enhanced
super-resolution generative adversarial networks. In
Proceedings of the European conference on computer
vision (ECCV) workshops, pages 0–0.
Zeyde, R., Elad, M., and Protter, M. (2012). On single im-
age scale-up using sparse-representations. In Curves
and Surfaces: 7th International Conference, Avignon,
France, June 24-30, 2010, Revised Selected Papers 7,
pages 711–730. Springer.
Zhang, K., Li, D., Luo, W., Ren, W., Stenger, B., Liu,
W., Li, H., and Yang, M.-H. (2021). Benchmarking
ultra-high-definition image super-resolution. In Pro-
ceedings of the IEEE/CVF international conference
on computer vision, pages 14769–14778.
VISAPP 2025 - 20th International Conference on Computer Vision Theory and Applications
374
