
OCT Image Inspections of Indicator Plant Leaves Under
Environmental Stresses
Hayate Goto
a
and Tatsuo Shiina
b
Graduate School of Science and Engineering, Chiba University,
1-33 Yayoi-cho, Inage-ku, Chiba-shi, Chiba, 263-8522, Japan
Keywords: Optical Coherence Tomography, Indicator Plant, Environmental Assessment, Water Stress, Ozone Stress.
Abstract: In recent years, environmental pollution has intensified, raising concerns about the health impacts on humans
and plants. In this study, we evaluate the indicator plants that can indicate environmental conditions by Optical
Coherence Tomography (OCT) which can make tomographic images quantitatively and non-invasively
observation. Trifolium repens, commonly known as white clover, which is prevalent in Japan, serves as an
indicator plant for ozone, suggesting that OCT measurements of Trifolium repens enabled the estimation of
ozone concentration. However, to evaluate whether the changes observed inside leaves are specific to ozone,
it is necessary to also differentiate other environmental stresses. In this study, we compared the OCT
measurement results of Trifolium repens grown under ozone stress and water stress. The analysis focused on
variations in tissue thickness, interference light intensity, and texture of the OCT images, while also
considering the stability of the analytical parameters. Differences were observed in the trends of changes in
palisade tissue thickness and interference light intensity under ozone stress and water stress. Although
variations under those stresses were observed in the results of texture analysis, these were not as significant
as those in thickness and intensity. This result indicates that plants induce specific changes within their leaves
due to different stresses, confirming the potential of OCT measurements for environmental assessments.
1 INTRODUCTION
In recent years, the progression of environmental pollution
has become a problem in urban and industrial areas. In
particular, ozone, produced when gases emitted from
vehicles react with sunlight, can become concentrated
enough high to harm plants and animals in the present
automobile-advanced society. To estimate environmental
conditions, there is a method that involves observing
indicator plants that are sensitive to specific or multiple
environmental stress factors(Kitao et al., 2009; Oishi, 2018).
By measuring indicator plants, it is possible to infer the
stress conditions to which the plants are exposed, enabling
a comprehensive evaluation of the surrounding
environment. This approach provides critical data that can
be utilized for the effective control of both the quality and
quantity of crop production. The observation of indicator
plants typically relies on non-quantitative methods, such as
visual inspections or microscopic examinations, which
require pre-treatment that damages the plants. Although
these methods provide insights into environmental
conditions, the development of remote sensing techniques
a
https://orcid.org/0000-0001-5387-9109
b
https://orcid.org/0000-0001-9292-4523
capable of quantitatively assessing plant responses without
altering their internal states is essential. In this study, we
used OCT (Optical Coherence Tomography), which can
quantitatively measure and visualize the internal structure
of a sample in a non-invasive, non-contact, and non-
destructive manner(Fercher et al., 1996).
OCT has been studied and developed in the fields of
ophthalmology (Tewarie et al., 2012), dentistry(Colston et al.,
1998; Schneider et al., 2017), and dermatology (Liu et al.,
2020). Research has been especially active in the field of
ophthalmology, where the technology is useful for the
diagnosis of glaucoma through visualization of the retina. It
has also been studied in the field of agriculture and has been
used to diagnose fruit diseases (M. Li et al., 2021; Sharifi et
al., 2023), monitor seed germination (X. Li et al., 2022), and
monitor crops during storage (Srivastava et al., 2018). In
addition to measurements in the laboratory, research has also
been done to carry the devices to plant growth sites to measure
live plants without damaging them by cutting (Lee et al.,
2019). We have developed TD-OCT(Time-Domain OCT)
plant measurement system (Goto, Lagrosas, & Shiina, 2024;
Goto, Lagrosas, Galvez, et al., 2024; Goto & Shiina, 2023).
28
Goto, H. and Shiina, T.
OCT Image Inspections of Indicator Plant Leaves Under Environmental Stresses.
DOI: 10.5220/0013151100003902
In Proceedings of the 13th International Conference on Photonics, Optics and Laser Technology (PHOTOPTICS 2025), pages 28-34
ISBN: 978-989-758-736-8; ISSN: 2184-4364
Copyright © 2025 by Paper published under CC license (CC BY-NC-ND 4.0)
The objective of this study is to evaluate the ozone
status of the surrounding environment to which
Trifolium repens, an ozone indicator plant, is exposed
using feature extraction by OCT measurements.
When plant leaves are exposed to ozone gas, ozone
enters the leaf through the stomata, producing
reactive oxygen species that destroy the palisade
tissue (the regularly arranged tissue located inside the
leaf close to the adaxial epidermis, which is the front
side of the leaf)(Pell et al., 1997). In the case of water
stress, stomatal occlusion occurs to inhibit
transpiration from the stomata. As a result, the
amount of 𝐶𝑂
taken in through the stomata is
reduced and photosynthesis is suppressed(Osakabe et
al., 2014). Thus, when leaves are exposed to different
stresses, different responses are triggered within the
leaf. Therefore, in OCT measurements of stress-
injured leaves, OCT images will reflect different
characteristics for each stress. In this study, we
analyse OCT images of leaves exposed to ozone
stress and water stress, and discuss the feature
extraction that appeared in those leaves. This study
will verify that OCT measurements can provide a
comprehensive observation of the surrounding
environmental conditions to which leaves are
exposed.
2 METHOD
2.1 Optical Coherence Tomography
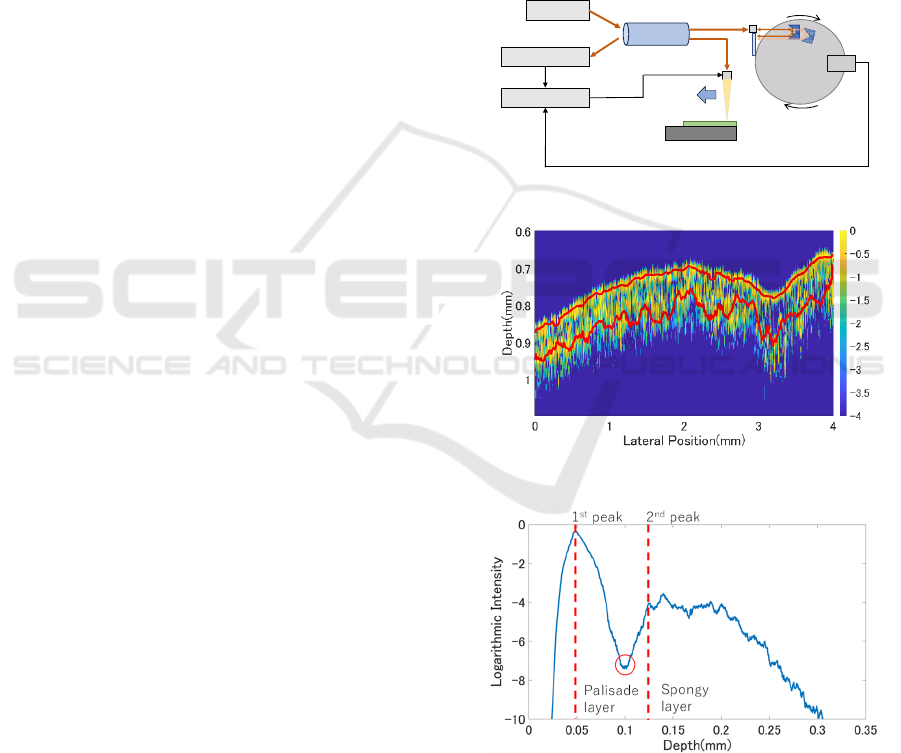
The OCT (Optical Coherence Tomography) system
developed in our laboratory for plant measurement is
shown in Fig. 1. The system is based on TD-OCT
with a Michelson interferometer configuration, and
OCT measures the relative distance between
interference points by identifying the backscattered
position of light within the sample. The light from the
SLD light source (central wavelength: 1310 nm,
wavelength width: 53 nm) is split into two paths
(reference path and sample path) by a fiber coupler.
In the reference path, the optical path length changes
at a constant speed due to a rotation mechanism and
returns to the fiber coupler. In the sample path, the
light backscattered at each layer of the sample returns
to the fiber coupler with an optical path length
corresponding to the backscattered position. The light
returning from both paths interferes, and the intensity
of the interference light is detected by an oscilloscope.
Since low-coherence light is used, the interference
light intensity is obtained only when the optical path
lengths of the two lights match within the coherence
length. The reflecting position of the light within the
sample is determined by the time difference between
interference points, and the scanning speed of the
optical path length of the reference arm(A-scan).
Additionally, by moving the probe that irradiates the
light parallel to the surface of the sample during
measurement, two-dimensional information
including internal information about the sample can
be obtained (B-scan). A two-dimensional
tomographic image can be created by mapping the
intensity information with colors.
Figure 1: OCT configuration.
Figure 2: Peak detection on OCT image.
Figure 3: Averaged A-line.
SLD
picoscope
Fiber coupler
Sample optical path
Reference optical path
PC
Trigger Signal
Stage Control
OCT Image Inspections of Indicator Plant Leaves Under Environmental Stresses
29
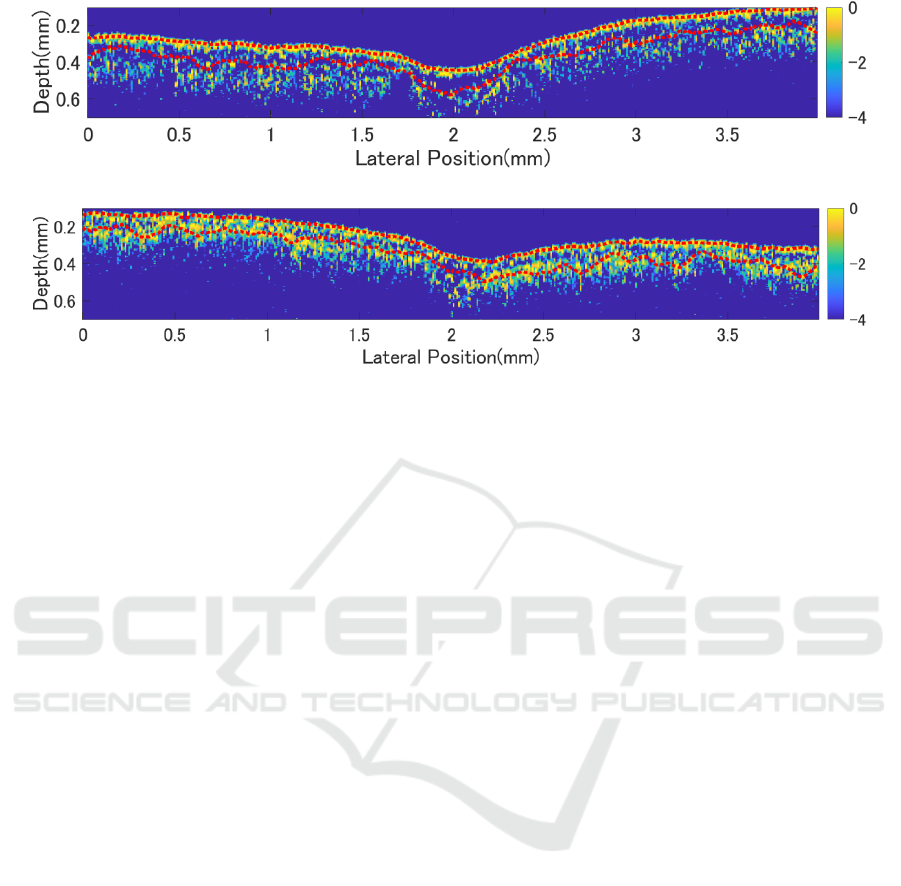
(a) Before exposure to water stress
(b) After exposure to water stress
Figure 4: OCT images of leaves under water stress.
The axial resolution of the OCT is determined by
the coherence length, which is determined by the
central wavelength and wavelength width. Although
the resolution increases as the central wavelength
becomes shorter, the absorption of chlorophyll
becomes stronger, resulting in a shallower depth.
Therefore, a wavelength of 1310 nm was selected.
The axial resolution calculated from the central
wavelength and wavelength width is 14.2 μm. The
output of the SLD is 15 μW, and the acquisition speed
of the A-line is 25 Hz. During measurement, the OCT
light is incident on the abaxial side of the leaf, and
each A-line is averaged from 16 measurements to
suppress noise. The B-scan image is created by
acquiring 400 A-lines at intervals of 10 μm.
2.2 Signal Analysis
The acquired A-line signals were performed
background light subtraction, intensity correction due
to focal distance displacement, moving average,
normalization, and logarithmic transformation. The
intensity correction due to focal distance was
performed to compensate for intensity attenuation
caused by deviations from the focal distance. This
correction applies the inverse of the focal intensity
distribution that shows the interference light intensity
changes due to the displacement from the focal
position to the A-line.
Based on the analysis of the thickness, intensity,
and texture of the palisade tissue from the B-scan
image, comparisons of measurement results for each
leaf were conducted. Initially, to obtain the location
of the palisade tissue within the B-scan images, peak
detection was performed for each A-line. The results
of the peak detection are indicated by the red lines in
Fig. 2. In the OCT image of leaves in Fig. 2, the
vertical axis represents the depth direction of the leaf
and the horizontal axis indicates the lateral position.
The peak detection identified the first peak (the
interface between the adaxial epidermis and the
palisade tissue) and the second peak (the interface
between the palisade tissue and the spongy tissue).
The distance between the first and second peaks
(representing the thickness of the palisade tissue) was
calculated for each A-line, and the average thickness
across the entire B-scan image was estimated. To
acquire the intensity in the palisade tissue, all A-lines
within the B-scan image were averaged to create a
single A-line (Fig. 3). The minimum intensity
obtained at the location of the palisade tissue from the
peak detection was recorded as the intensity of the
palisade tissue. Texture analysis was performed using
the Gray Level Co-occurrence Matrix (GLCM). In
GLCM, the number of pairs of intensity differences
between adjacent pixels is counted to create a matrix,
thereby extracting local variations within the image.
From the constructed matrix, Contrast, Correlation,
Energy, and Homogeneity were calculated. Contrast
increases as the number of pixel pairs with large
intensity differences in the image. Correlation
becomes larger when pixel pairs have values closer to
the matrix mean. Energy increases with a higher
frequency of identical intensity pairs, while
Homogeneity grows as the number of pixel pairs with
similar intensities increases.
PHOTOPTICS 2025 - 13th International Conference on Photonics, Optics and Laser Technology
30
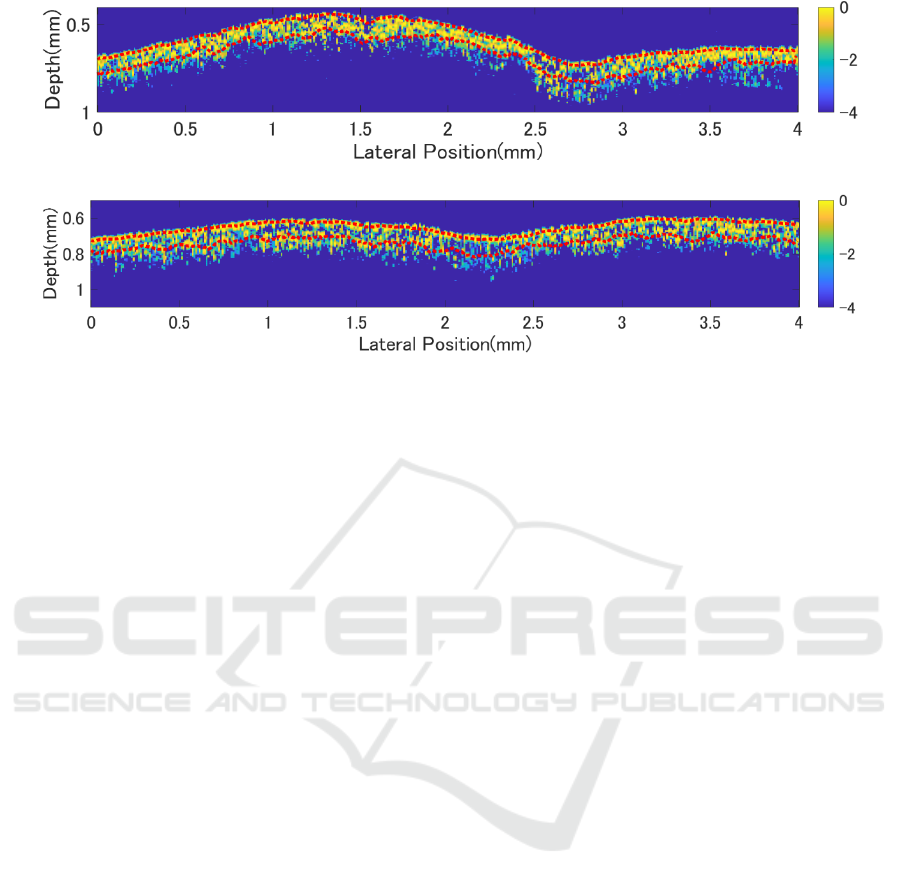
(a) Before exposure to ozone gas
(b) After exposure to ozone gas
Figure 5: OCT images of leaves under ozone stress.
2.3 Leaf Samples
The sample used in this study was the five leaves of
Trifolium repens (White Clover), an indicator plant
for ozone gas. The leaves were grown in an incubator
maintained at a constant temperature of 25°C, with 12
hours of light exposure during the day.
In the water stress experiment, an automatic
watering system was used. OCT measurements were
taken for 11 days after stopping watering until the
Trifolium repens wilted. Once the plants had wilted
for 14 days, watering was resumed, and the leaf
recovery process was observed by OCT.
For the ozone stress experiment, an ozone gas
generator was placed in the incubator, and the plants
were grown in an environment with an ozone
concentration of approximately 0.2 ppm during the
measurement period. This concentration can have
significant influences on both humans and plants.
Measurements were taken several times over 10 days
after the ozone generator was introduced to monitor
changes over time.
3 RESULT
3.1 Stress Influences on Leaves
The measurement results before and after applying
water stress to the Trifolium repens leaves are shown
in Fig. 4. In contrast, the results before and after
ozone stress are shown in Fig. 5. In these images, the
horizontal axis represents the lateral position of the
OCT probe, and the vertical axis shows the depth of
the sample. The measurements were taken from the
adaxial side of the leaves, representing the results
when light was illuminated from the top of the images.
In Fig. 4(a), from top to bottom, the adaxial
epidermis, palisade layer, and spongy layer are visible.
The adaxial epidermis appears as a region of stronger
signal intensity around a depth of 0.2 mm in Fig. 4(a).
Below the epidermis, there is a region where the
signal disappears and then reappears, indicating the
presence of the palisade tissue, which is situated
above the spongy layer.
After applying water stress, an increase in signal
density is observed in the spongy layer. In Fig. 4(b),
on the left side, the originally visible palisade tissue
layer appears to have thinned, causing the signals
from the adaxial epidermis and the spongy layer to
merge. It seems to be little change in the main vein.
In contrast, after applying ozone stress, the signal
density decreases in Fig.5(b), and the palisade layer
becomes more distinct, showing changes opposite to
those caused by water stress. Additionally, the main
vein becomes less defined. Since OCT images make
it difficult to perform quantitative assessments or
objectively evaluate small changes, the variations in
the images were quantified by analyzing the intensity,
and thickness of the palisade tissue, and texture using
GLCM (Gray Level Co-occurrence Matrix).
3.2 Intensity Change in Palisade Tissue
Figure 6 illustrates the changes in the intensity of the
palisade tissue (red circles in Fig. 3) under the
stresses. The horizontal axis of Fig. 6 represents the
number of days since each type of stress was applied.
The vertical axis represents the absolute intensity
OCT Image Inspections of Indicator Plant Leaves Under Environmental Stresses
31
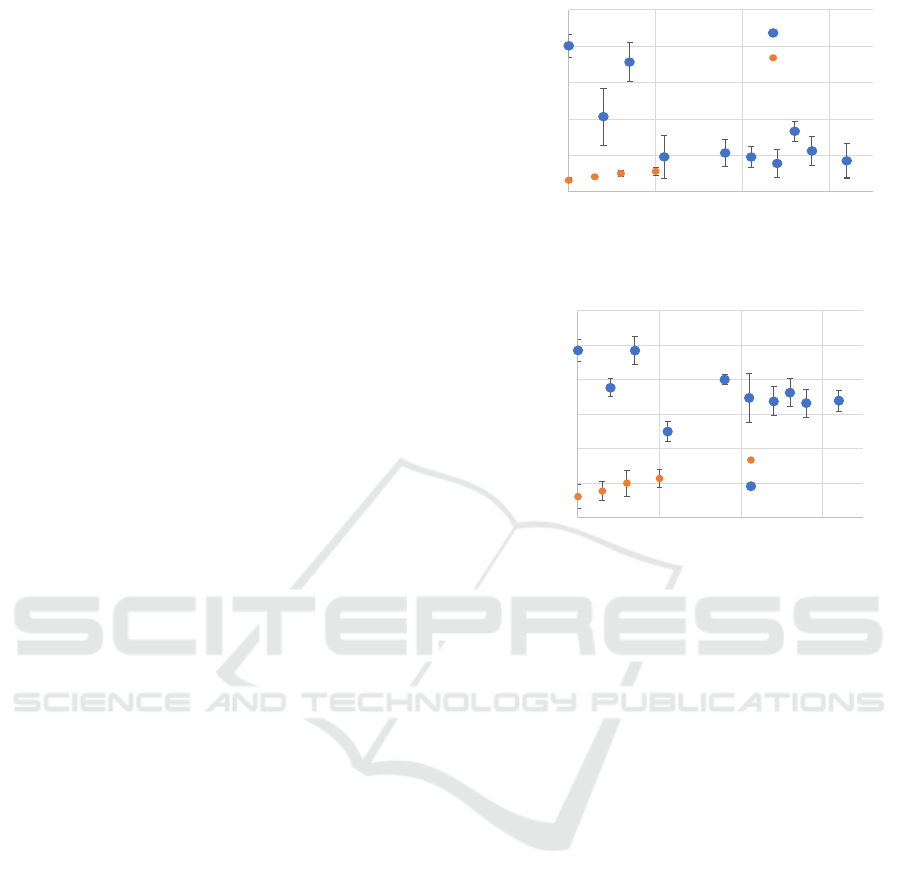
value in the palisade tissue, where a higher value
indicates less reflection from the palisade tissue. The
blue dots represent the results of the water stress
experiment, where the leaves wilted from day 11, and
watering was resumed on day 14. The orange dots
show the results of the ozone stress experiment(up to
10 days).
In the case of water stress, the values decreased
during the period from when watering was stopped
until the leaves wilted. Even after watering was
resumed and the leaves recovered, the intensity of the
palisade tissue remained unchanged, maintaining a
nearly constant value. In contrast, the ozone stress
experiment showed a gradual increase, although the
change was not as significant as in the water stress
experiment.
Under water stress, the cell walls likely hardened
as a response to minimize the effects of the stress,
which resulted in stronger reflections within the cells.
Even after watering resumed, it is possible that the
hardened cell walls did not fully recover during the
measurement period. On the other hand, under ozone
stress, ozone penetrated and damaged the cell walls,
disrupting the organized structure of the palisade
tissue, which likely reduced the amount of light
reflected in the probe. The two types of stress caused
different changes within the leaves, allowing us to
evaluate these differences using OCT.
3.3 Thickness Change in Palisade
Tissue
Figure 7 illustrates the changes in the thickness of the
palisade tissue (between the two red lines in Fig. 2)
under the stresses. The vertical axis of Fig. 7
represents the average thickness of the palisade tissue.
During the water stress period, a decrease in
thickness was observed until wilting(day 11). This
reduction is due to a decrease in internal water content,
reducing cell volume. After watering was resumed,
the thickness approached its original value, but there
were few changes after that. These few changes,
similar to the intensity measurements in the palisade
tissue, indicate that the cell condition did not fully
recover during the measurement period.
In contrast to water stress, the ozone stress
experiment showed a gradual increase in thickness.
This increase will be attributed to water filling the
intercellular spaces by the disruption of the palisade
tissue, resulting in swelling through osmotic pressure.
As with the intensity measurements, the two types of
stress resulted in distinct changes in the palisade
tissue.
Figure 6: Intensity of palisade tissue.
Figure 7: Thickness of palisade layer.
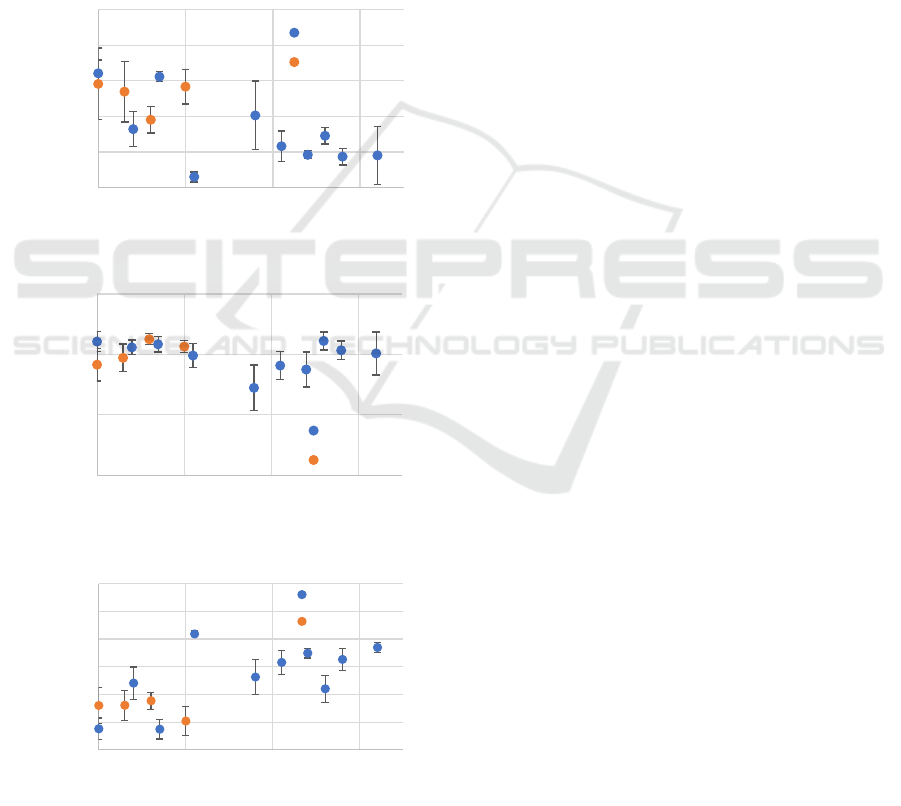
3.4 Texture Change in Palisade Tissue
Figure 8 shows the GLCM measurement results
before and after water stress and ozone stress. The
horizontal axis indicates the number of days, while
the vertical axis shows (a) Contrast, (b) Correlation,
and (c) Homogeneity values, respectively.
During water stress, the Contrast decreased until
wilting occurred(Fig.8(a)). After watering was
resumed, the Contrast temporarily returned to a value
close to its original level but then decreased again,
stabilizing at a certain value. The Contrast value is
higher when there is a greater difference in intensity
between adjacent pixels. In the case of water stress,
the reduction in thickness of the palisade tissue in
Fig.7 led to fewer regions with low signal intensity
within the palisade tissue, resulting in a smaller
intensity difference in Fig.4. The temporary increase
in thickness after resuming watering will have
contributed to the similar trend observed in the
Contrast. In contrast, under ozone stress, the Contrast
initially decreased but returned to its original value
after 10 days. Ozone stress destroys the palisade
tissue, causing light scattering within it to become
random. This randomness contributed to the decrease
in the signal from the palisade tissue. Additionally,
when the leaf is damaged partially by ozone, it will be
0.5
2.5
4.5
6.5
8.5
10.5
0 102030
Intensity of palisade tissue
Day
Water stress
Ozone stress
0.04
0.05
0.06
0.07
0.08
0.09
0.1
0102030
Thickness of palisade layer
Day
Ozone stress
Water stress
PHOTOPTICS 2025 - 13th International Conference on Photonics, Optics and Laser Technology
32
increased the intensity differences, which causes the
rise in Contrast observed after 10 days.
The Correlation values showed little change for
both water stress and ozone stress(Fig.8(b)). After
resuming watering, there was a temporary significant
decrease in the value compared to other periods, but
it returned to a level similar to the original within a
few days. The Correlation value increases when there
are similar structures in the image. Within the leaf,
similar structures are repeated in the horizontal
direction, causing this value to approach nearly equal
to 1. Immediately after resuming watering, the partial
recovery of only certain areas of the leaf can
introduce some heterogeneity, resulting in a
temporary decrease in the Correlation value.
(a)Contrast
(b) Correlation
(c) Homogeneity
Figure 8: The result of GLCM.
Homogeneity increased during water
stress(Fig.8(c)), while it showed little change under
ozone stress. After watering was resumed, the value
remained relatively constant. The Homogeneity value
rises when adjacent pixels have similar intensity pairs.
During water stress, the Homogeneity value changes
due to similar reasons as those affecting Contrast.
The GLCM values exhibited different trends of
change between the two types of stress, similar to the
variations observed in the intensity and thickness of
the palisade tissue; however, these changes were not
as significant. Therefore, to enhance the visibility of
changes in the texture analysis using GLCM related
to the intensity and thickness change, it is necessary
to apply specific image processing techniques such as
preprocessing. Nevertheless, the results indicate that
the internal changes in the leaves of Trifolium repens
exposed to environmental stress can be categorized
according to the type of stress experienced.
4 CONCLUSION
In this study, we apply OCT (Optical Coherence
Tomography) measurement as a method for
evaluating indicator plants to estimate the state of
environmental pollution. To monitor the ozone
pollution, which has been exacerbated by the
development of automobile-based societies, we
conducted OCT measurements on the leaves of
Trifolium repens grown under different conditions.
To quantify changes specific to ozone stress
evaluated in OCT images, we also measured changes
due to water stress for comparison. For quantitative
analysis, we analyzed the interference light intensity,
thickness, and texture (Contrast, Correlation,
Homogeneity) in the palisade tissue.
Although differences between each type of stress
were not clearly visible in the OCT images, changes
in the intensity and thickness of the palisade tissue
were estimated quantitatively. Changes were also
observed in the texture analysis results (Contrast,
Correlation, Homogeneity), but these changes were
not as significant as those in intensity and thickness.
It is possible that more distinct changes could be
deduced by applying image processing techniques to
make the intensity differences within the image
clearer or by changing the direction in which the
GLCM (Gray Level Co-occurrence Matrix) analysis
is performed.
From these results, it can be concluded that
different changes occur in the palisade tissue due to
ozone stress and water stress, and that it is possible to
classify these changes using OCT measurements. By
0.00
5.00
10.00
15.00
20.00
25.00
0 102030
Contrast
Day
Water stress
Ozone stress
0.97
0.98
0.99
1.00
0 102030
Correlation
Day
Water stress
Ozone stress
0.70
0.75
0.80
0.85
0.90
0.95
1.00
0 102030
Homogeneity
Da
y
Water stress
Ozone stress
OCT Image Inspections of Indicator Plant Leaves Under Environmental Stresses
33

further advancing detailed research on the influence
of different stresses on leaves, it will become possible
to accurately identify the cause of stress using OCT.
OCT can be taken to the on-site where plants are
grown for measurements, allowing for quick, real-
time, and in vivo estimation of the environmental
conditions on the site. This study demonstrates the
potential to estimate the environmental conditions to
which plants are exposed, which could be beneficial
in agricultural production environments.
ACKNOWLEDGMENTS
This work was supported by JST SPRING, Grant
Number JPMJSP2109
REFERENCES
Colston, B. W., Sathyam, U. S., DaSilva, L. B., Everett, M.
J., Stroeve, P., & Otis, L. L. (1998). Dental OCT. Optics
Express, 3(6), 230.
Fercher, A. F., Drexler, W., & Hitzenberger, C. K. (1996).
OCT techniques (R. Birngruber, A. F. Fercher, & P.
Sourdille, Eds.; pp. 164–174).
Goto, H., Lagrosas, N., Galvez, M. C., Vallar, E., & Shiina,
T. (2024). Depth enlargement and homogenization
from plant-OCT observations by using optical clearing.
Optik, 316, 172065.
Goto, H., Lagrosas, N., & Shiina, T. (2024). OCT Image
Analysis of Internal Changes in Leaves due to Ozone
Stresses. Proceedings of the 12th International
Conference on Photonics, Optics and Laser
Technology, 65–71.
Goto, H., & Shiina, T. (2023). Environmental Pollution
Assessment with Indicator Plant Under Ozone Gas
Atmosphere by Using OCT. Proceedings of the 11th
International Conference on Photonics, Optics and
Laser Technology, 34–39.
Kitao, M., Löw, M., Heerdt, C., Grams, T. E. E., Häberle,
K.-H., & Matyssek, R. (2009). Effects of chronic
elevated ozone exposure on gas exchange responses of
adult beech trees (Fagus sylvatica) as related to the
within-canopy light gradient. Environmental Pollution,
157(2), 537–544.
Lee, J., Lee, S.-Y., Wijesinghe, R. E., Ravichandran, N. K.,
Han, S., Kim, P., Jeon, M., Jung, H.-Y., & Kim, J.
(2019). On-Field In situ Inspection for Marssonina
Coronaria Infected Apple Blotch Based on Non-
Invasive Bio-Photonic Imaging Module. IEEE Access,
7, 148684–148691.
Li, M., Rivera, S., Franklin, D., Nowak, E., Hallett, I.,
Kolenderska, S., Urbańska, M., Vanholsbeeck, F., &
East, A. (2021). Use of optical coherence tomography
and light microscopy for characterisation of mechanical
properties and cellular level responses of ‘Centurion’
blueberries during weight loss. Journal of Food
Engineering, 303, 110596.
Li, X., Yang, X., Li, X., Zhao, Z., Zhang, Z., Lin, H., Kang,
D., & Shen, Y. (2022). Nondestructive in situ
monitoring of pea seeds germination using optical
coherence tomography. Plant Direct, 6(7).
Liu, Y., Zhu, D., Xu, J., Wang, Y., Feng, W., Chen, D., Li,
Y., Liu, H., Guo, X., Qiu, H., & Gu, Y. (2020).
Penetration-enhanced optical coherence tomography
angiography with optical clearing agent for clinical
evaluation of human skin. Photodiagnosis and
Photodynamic Therapy, 30, 101734.
Oishi, Y. (2018). Comparison of moss and pine needles as
bioindicators of transboundary polycyclic aromatic
hydrocarbon pollution in central Japan. Environmental
Pollution, 234, 330–338.
Osakabe, Y., Osakabe, K., Shinozaki, K., & Tran, L.-S. P.
(2014). Response of plants to water stress. Frontiers in
Plant Science, 5.
Pell, ‐Eva J., Schlagnhaufer, C. D., & Arteca, R. N. (1997).
Ozone‐induced oxidative stress: Mechanisms of action
and reaction. Physiologia Plantarum, 100(2), 264–273.
Schneider, H., Park, K.-J., Häfer, M., Rüger, C., Schmalz,
G., Krause, F., Schmidt, J., Ziebolz, D., & Haak, R.
(2017). Dental Applications of Optical Coherence
Tomography (OCT) in Cariology. Applied Sciences,
7(5), 472.
Sharifi, F., Naderi-Boldaji, M., Ghasemi-Varnamkhasti,
M., Kheiralipour, K., Ghasemi, M., & Maleki, A.
(2023). Feasibility study of detecting some milk
adulterations using a LED-based Vis-SWNIR
photoacoustic spectroscopy system. Food Chemistry,
424, 136411.
Srivastava, V., Dalal, D., Kumar, A., Prakash, S., & Dalal,
K. (2018). In vivo automated quantification of quality
of apples during storage using optical coherence
tomography images. Laser Physics, 28(6), 066207.
Tewarie, P., Balk, L., Costello, F., Green, A., Martin, R.,
Schippling, S., & Petzold, A. (2012). The OSCAR-IB
Consensus Criteria for Retinal OCT Quality
Assessment. PLoS ONE, 7(4), e34823.
PHOTOPTICS 2025 - 13th International Conference on Photonics, Optics and Laser Technology
34
