
Evaluating Time-Constant Models in Electrodermal Activity Using
Continuous Multi-Frequency Impedance Spectroscopy
Emeric Desmazure, Bertrand Massot, Amalric Montalibet and Claudine Gehin
INSA Lyon, Ecole Centrale de Lyon, CNRS, Universite Claude Bernard Lyon 1, CPE Lyon, INL UMR5270,
69100 Villeurbanne, France
Keywords: Electrodermal Activity, Bioimpedance, Multi-Frequency, Spectroscopy, Cole Parameters, Autonomic
Nervous System.
Abstract: A continuous multi-frequency impedance spectroscopy sensor, capable of measuring 16 frequencies, was
developed to investigate electrodermal activity. Data was collected from a healthy volunteer over a 30-minute
resting period, minimizing interference from the autonomic nervous system. The resulting data were
processed with a custom Python algorithm utilizing the ImpedanceFitter library, enabling comparison across
models incorporating one, two, and three Cole behaviours. A significant enhancement in accuracy was
achieved with the two Cole behaviours over the single Cole behaviour approach, while no additional
improvement was observed with a third Cole behaviour. These findings suggest that the two Cole behaviours
model provides optimal performance in capturing the complexity of electrodermal activity. Future research
will extend this analysis to a larger cohort, exploring how variations in protocol, electrode type, and stimulus
may refine the modelling and interpretation of bioimpedance data.
1 INTRODUCTION
Electrodermal activity (EDA) is a physiological
function regulated by the autonomic nervous system
and is specifically related to signals arising from the
activity of sweat glands (Sharkey & Pittman, 1996;
Tremblay, 2005). When the autonomic system is
activated, it stimulates the sweat glands, which are
particularly concentrated in the palmar (hands) and
plantar (feet) areas (Matsunaga et al., 1998). This
activation leads to increased sweat production within
the excretory ducts of the glands (Figure 1), resulting
in a greater amount of sweat on the surface of the skin
(Goldsmith, 1991). The increase in sweat levels
enhances skin conductivity, providing measurable
data associated with electrodermal activity
This measurement provides valuable information
relevant to psychological state, including conditions
such as stress and cognitive load, or
psychopathologies such as schizophrenia (Edelberg,
1972). Electrodermal activity is typically measured
by placing two electrodes on the palmar or plantar
areas, specifically on the distal or middle phalanx or
the thenar eminence (Tronstad et al., 2010). A low-
intensity, fixed- or zero-frequency alternating or
continuous current is passed through the electrodes,
with the resulting signal corresponding to skin
conductivity. This process is known as exosomatic
recoding of electrodermal activity (Fowles et al.,
1981) .
Figure 1: Diagram of skin structure.
A sensor employing impedance spectroscopy
in continuous, multi-frequency mode has been
developed and validated to comprehensively model
skin properties. The device is capable of measuring 8
spectra per second across 16 simultaneous
frequencies (f = [12, 28, 32, 36, 44, 68, 84, 108, 136,
196, 256, 342, 400, 484, 576, 724] Hz) continuously.
The primary objective is to analyse the data collected
by the sensor to enable more accurate model of skin
Desmazure, E., Massot, B., Montalibet, A. and Gehin, C.
Evaluating Time-Constant Models in Electrodermal Activity Using Continuous Multi-Frequency Impedance Spectroscopy.
DOI: 10.5220/0013151400003911
Paper published under CC license (CC BY-NC-ND 4.0)
In Proceedings of the 18th International Joint Conference on Biomedical Engineering Systems and Technologies (BIOSTEC 2025) - Volume 1, pages 157-162
ISBN: 978-989-758-731-3; ISSN: 2184-4305
Proceedings Copyright © 2025 by SCITEPRESS – Science and Technology Publications, Lda.
157
properties. This approach is based on the assumption
that it is possible to differentiate between the various
signals present in the data, such as the electrode-skin
interface, tissues and sweat channels. This makes it
possible to model electrodermal activity more
accurately and faithfully. The signals obtained are in
the form of circle, consistent with the classical Cole
diagram observed in bioimpedance. Building on this
observation and supporting by the literature,
modelling incorporating one, two or even three Cole
behaviours could refine the analysis (Freeborn et al.,
2014). Such a method would facilitate better
discrimination between the different components of
the signals, thereby optimising the accuracy and
fidelity of the modelling.
2 MATERIALS AND METHODS
Data were collected from a volunteer participant in
the laboratory. The sensor was positioned on the wrist
of the subject's non-dominant hand, while two
medium-sized (2.18 x 3.18 mm²) Softrace CONMED
electrodes were placed on the distal phalanges of the
same hand (Tronstad et al., 2010). The electrodes
were connected to the sensor using wires and held in
place with adhesive plasters to minimise the
electrode-skin interface and ensure optimal contact
(Figure 2). No electrode adaptation phase was
performed before recording commenced. The subject
was invited to lie on a mattress and relax with his eyes
closed for approximately 30 minutes. At the end of
the protocol, the data were retrieved in the form of
CSV files containing temporal information, as well as
the real and imaginary parts for the 16 frequencies.
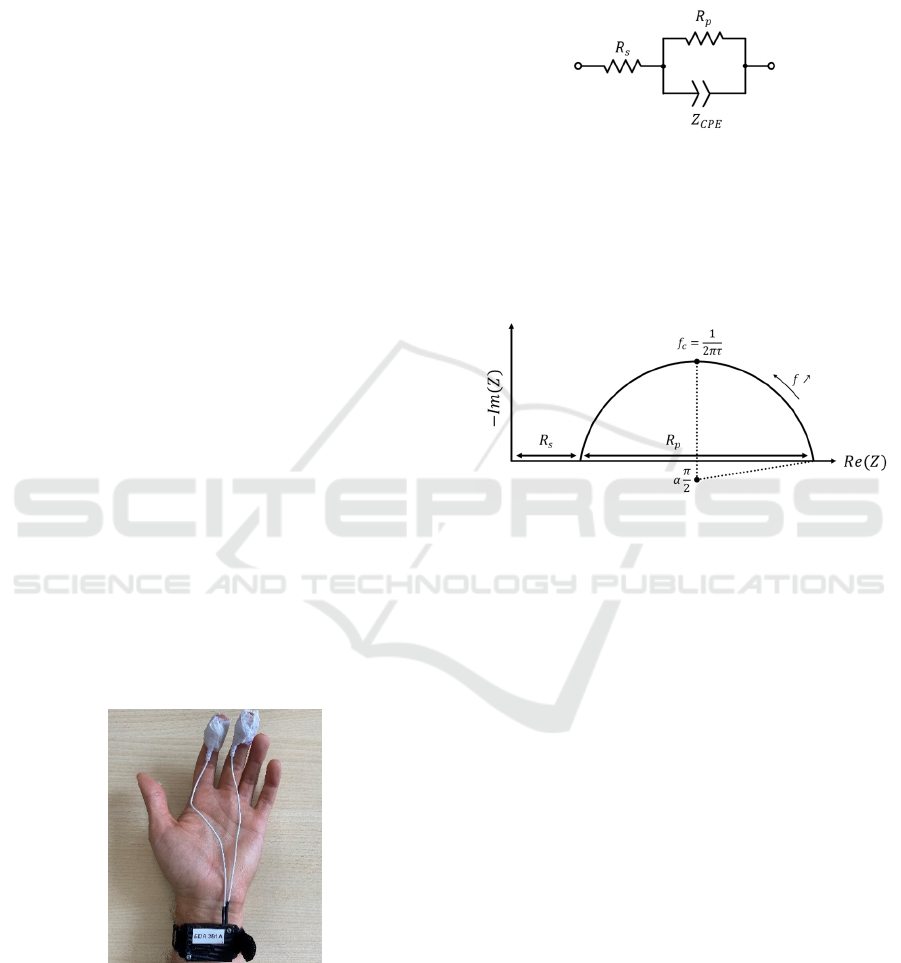
Figure 2 : Sensor and positioning of electrodes on the hand.
2.1 Cole Model
The curves were fitted using the Cole model, which
is widely employed in the field of bioimpedance
when a Cole diagram is observed. This model is based
on an electrical circuit a series resistor (𝑅
), followed
by a parallel combination of a resistor (𝑅
) and a
constant phase element (𝑍
) (Figure 3). It can be
used to model various structures, such as tissue, the
electrode-skin interface, and sweat ducts.
Figure 3: Cole Model.
Cole's diagram provides key parameters,
including 𝑅
(resistance at high frequency), 𝑅
(resistance at low frequency), 𝜏 (time constant), and
𝛼 (dispersion factor, which describe how the circle is
depressed below the y-axis) (Figure 4).
Figure 4: Cole diagram with all Cole parameters.
The aim was to accurately model this system to
extract relevant observations. To refine this
modelling, the data
w
ere analysed by applying one,
two or three Cole behaviours to assess their impact
and relevance.
The Modelling was carried out using the Python
programming language, in conjunction with the
ImpedanceFitter library, which allows data to be
fitted using models based on one or more of Cole's
behaviours. The first spectrum is initialized and fitted
using manual values. For all subsequent spectra, the
fit is performed automatically, taking the best fit of
the previous spectrum as the initial value. This
approach is based on the assumption that the variation
between successive spectra remains small, allowing
very close-fitting results to be obtained. The sensor,
as mentioned previously, collects 8 spectra per
second, generating several tens of thousands of data
points over the 30-minute protocol. An automatic
algorithm was developed in conjunction with
ImpedanceFitter, enabling the analysis of this vast
amount of data in just a few minutes. This algorithm
proved to be time saving comparing with manual
extraction from a commercial software such as Zview
(Scribner).
BIODEVICES 2025 - 18th International Conference on Biomedical Electronics and Devices
158
3 RESULTS
A total of 14,000 spectra were acquired as part of the
30-minute protocol. All the spectra were analysed
using one, two or three Cole behaviours. The graphs
showing the acquired data and the best fit represent
just one arbitrary spectrum from the entire signal. In
addition, the error plots show the average of the
fitting error over the whole signal for the 16
frequencies.
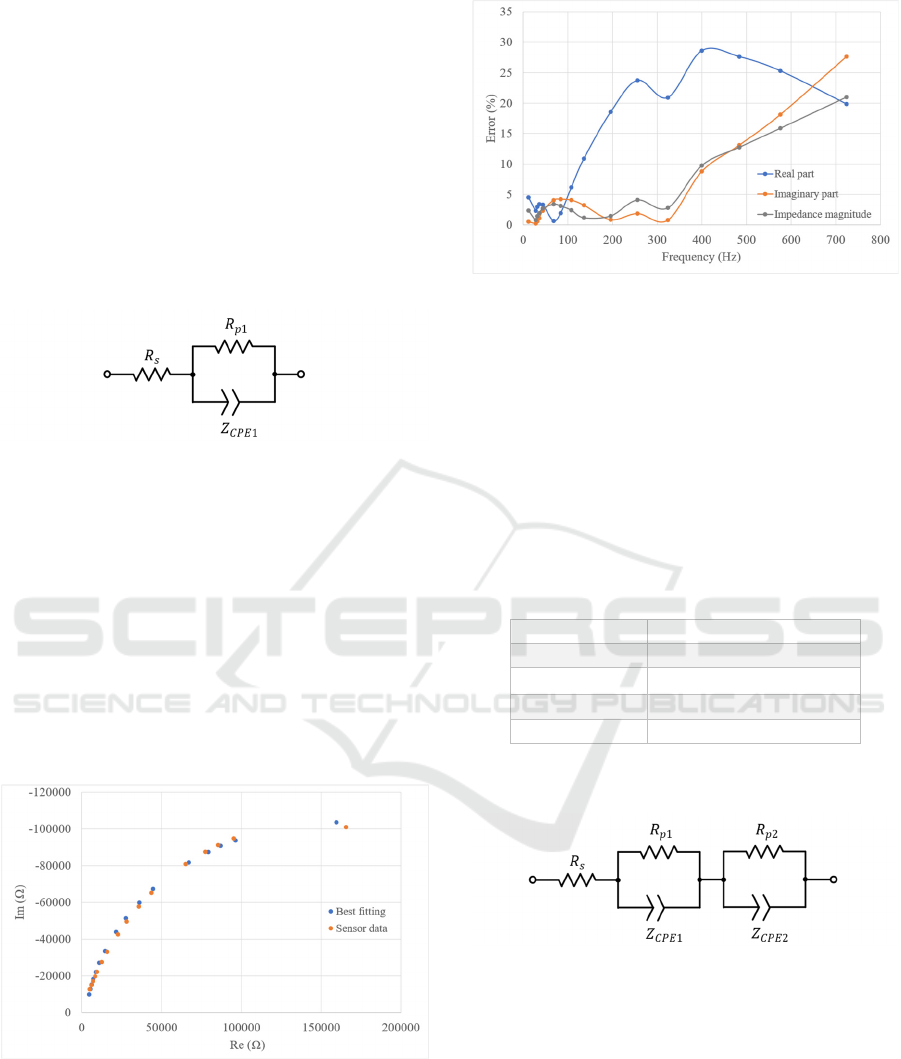
3.1 One Cole Model
Figure 5: Cole Model – 1 Cole behaviour.
Comparing the curve measured by the sensor with the
adjustment made using a single Cole model (Figure
5) for a spectrum, there is a noticeable shift between
the real part and the imaginary part at each frequency
(Figure 6). This shift results in a relatively high error
rate over the entire signal, particularly at high
frequencies, ranging from 1% to 30% depending on
the frequency (Figure 7). These results suggest the
possible presence of additional electrophysiological
behaviour in the signals, which justifies the
introduction of a second Cole model to improve the
fit.
Figure 6: Example of a Nyquist plot of an impedance
spectrum acquired (Sensor data) together with the result of
a single Cole model fitting.
Figure 7: Average error plot the for 1 Cole behaviours over
the entire signal.
During the execution of the algorithm, the Cole
parameters (𝑅
, 𝑅
, 𝜏 and 𝛼) were estimated. It was
observed that 𝑅
tended towards 0, a consequence of
the limitations of the software, which prevents
negative values for 𝑅
from being obtained, as these
are biologically impossible (Table 1). Although this
constraint is justifiable, it may nonetheless limit the
accuracy of the data fit and necessitate improvements
to better reflect actual biophysical properties.
Table 1: Cole parameters for one Cole behaviour.
Cole Parameters
𝑹
𝒔
2.37e
-24
Ω
𝑹
𝒑𝟏
286393
Ω
𝜶
𝟏
0.79
𝝉
𝟏
10.2 ms
3.2 Two Cole Model
Figure 8: Cole Model – 2 Cole behaviours.
For the same spectrum, the data was then processed
using two Cole behaviours (Figure 8). The measured
impedance curve, initial values and fit are shown in
the graph below (Figure 9). A significant
improvement was observed at all frequencies, with a
significant reduction in the errors for both the real and
imaginary parts. This improvement is further
confirmed by the error plot over the whole signal,
where the errors approach 0% at low frequencies and
14% at high frequencies, which is halved compared
to the fit with a single Cole's behaviour (Figure 10).
Evaluating Time-Constant Models in Electrodermal Activity Using Continuous Multi-Frequency Impedance Spectroscopy
159
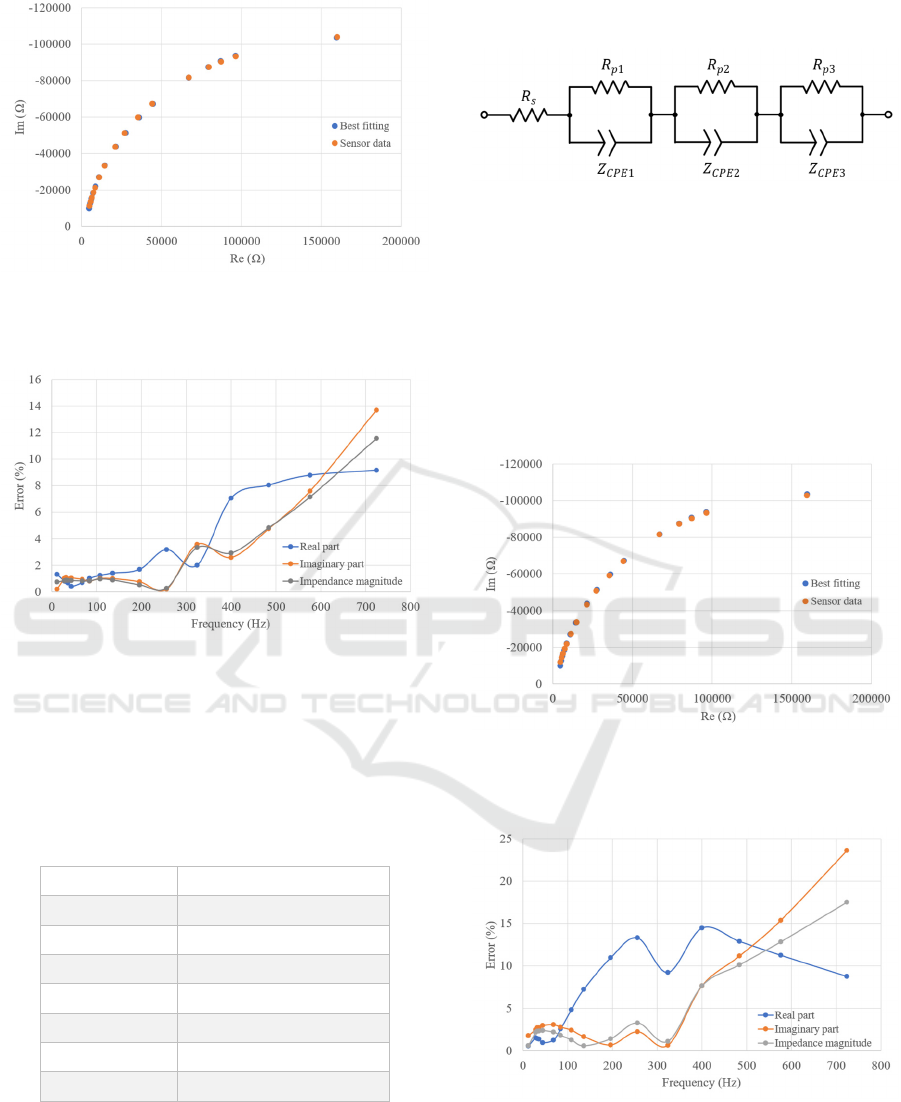
Figure 9: Example of a Nyquist plot of an impedance
spectrum acquired (Sensor data) together with the result of
a double Cole model fitting.
Figure 10: Average error plot the for 2-time constants over
the entire signal.
The Cole parameters obtained with two constants
showed positive 𝑅
values, consistent with the
expected physiological properties, demonstrating the
effectiveness of this approach (Table 2).
Table 2: Cole parameters for two Cole behaviours.
Cole Parameters
𝑹
𝒔
2137
Ω
𝑹
𝒑𝟏
117078 Ω
𝜶
𝟏
0.88
𝝉
𝟏
42.7 ms
𝑹
𝒑𝟐
190348 Ω
𝜶
𝟐
0.87
𝝉
𝟐
23 s
3.3 Three Cole Model
Figure 11: Cole model – 3 Cole behaviours.
Finally, an analysis using three Cole behaviours was
performed (Figure 11). However, no significant
improvement over the two-constant model was
observed (Figure 11). The error rate did not decrease
further at low frequencies but increased considerably
at high frequencies compared at the 2-time constants
(Figure 12). Although the adjustment was always
more effective than that obtained with a single time
constant (Table 3).
Figure 12: Example of a Nyquist plot of an impedance
spectrum acquired (Sensor data) together with the result of
a triple Cole model fitting.
Figure 13: Average error plot the for 3 Cole behaviours over
the entire signal.
BIODEVICES 2025 - 18th International Conference on Biomedical Electronics and Devices
160

Table 3: Cole parameters for three Cole behaviours.
Cole Parameters
𝑹
𝒔
1158
Ω
𝑹
𝒑𝟏
134181 Ω
𝜶
𝟏
0.86
𝝉
𝟏
5 ms
𝑹
𝒑𝟐
1349 Ω
𝜶
𝟐
0.79
𝝉
𝟐
15.5 ms
𝑹
𝒑𝟑
183733 Ω
𝜶
𝟑
0.82
𝝉
𝟑
28.3 ms
4 DISCUSSION
The results obtained confirmed the effectiveness of
using two Cole behaviours to accurately model skin
conductivity assessed on palms, as performed in the
frame of electrodermal activity analysis. When the fit
was based on a single Cole behaviour, a significant
error rate was observed, particularly at high
frequencies, where the differences between the real
and imaginary parts were pronounced. This
observation suggests that the underlying phenomena,
especially at the electrode-skin interface, cannot be
fully captured with a single Cole behaviour. These
results align with the literature, which indicates that
heterogeneous biological systems do not conform to
a single Cole model (Lazović et al., 2014). The
addition of a second Cole behaviour significantly
improved the accuracy of the fit, with a marked
reduction in the error rate across all frequencies. In
particular, the 𝑅𝑠 values, which were close to 0 in the
one Cole model due to software constraints, showed
a better alignment with physiological realities in the
two Cole model. However, a persistent higher error
superior at 4% for the high frequency indicates a
potential limitation of the device at high frequency.
This could be due to interference or hardware
artefacts, necessitating further investigation to
optimise the device’s accuracy at these frequencies.
The application of a model with three Cole
behaviours showed no significant improvement over
the model with two Cole behaviours. This suggests
that the use of two Cole behaviour is sufficient to
capture the majority of information related to
electrodermal activity in this context. However, it
remains possible that increasing the precision of the
device or exploring more complex experimental
contexts could reveal additional electrophysiological
phenomena with a three Cole model.
Compared with conventional methods of
analysing electrodermal activity, which are limited to
the use of a fixed or zero frequency, multi-frequency
spectroscopy, combined with dual Cole behaviour
modelling, offers a superior capability in analysing
skin conductivity. The multi-frequency approach
enhances resolution and enables a more accurate
analysis of the different electrophysiological
components. In the future, it will be investigated if the
use of dual Cole behaviour modelling could not only
improve the accuracy of skin conductivity modelling
in the frame of electrodermal activity analysis, but
also provide a better understanding of the underlying
physical and physiological mechanisms. By varying
the electrodermal stimuli, the duration of the protocol,
the subjects studied, or the size and type of electrodes,
this approach could provide a more comprehensive
view of the system's behaviour. It will be studied if
these variations could reveal additional information
and refine the interpretation of the electrodermal
responses.
5 CONCLUSION
A sensor using continuous multifrequency
spectroscopy was designed and validated, enabling
more accurate modelling of skin conductivity on
palms. Data analysis, based on the assumption of a
Cole diagram, was conducted using a Python
algorithm built on the ImpedanceFitter library, with
fits to one, two and three Cole behaviours. The results
demonstrated a significant improvement with two
Cole behaviours compared with one, while adding a
third behaviours yielded no additional benefit. For
future work, the aim will be to collect and analyse
new data from different subjects, modifying the
protocol to include more stimuli, varying the type or
size of electrodes, or adjusting the duration of the
protocol, to further refine the modelling of
electrodermal activity.
REFERENCES
EDELBERG, R. (1972). Electrical activity of the skin : Its
measurement and uses in psychophysiology. Handbook
of psychophysiology, 367‑418.
Fowles, D. C., Christie, M. J., Edelberg, R., Grings, W. W.,
Lykken, D. T., & Venables, P. H. (1981). Publication
Recommendations for Electrodermal Measurements.
Psychophysiology, 1.
Freeborn, T. J., Maundy, B., & Elwakil, A. S. (2014).
Extracting the parameters of the double-dispersion Cole
Evaluating Time-Constant Models in Electrodermal Activity Using Continuous Multi-Frequency Impedance Spectroscopy
161

bioimpedance model from magnitude response
measurements. Medical & Biological Engineering &
Computing, 52(9), 749‑758.
Goldsmith, L. A. (1991). Physiology, biochemistry, and
molecular biology of the skin (Second edition). Oxford
University Press.
Lazović, G., Vosika, Z., Lazarević, M., Simic-Krstić, J., &
Koruga, D. (2014). Modeling of Bioimpedance for
Human Skin Based on Fractional Distributed- Order
Modified Cole Model. FME Transactions Faculty of
Mechanical Engineering, Belgrade, 42, 74‑81.
Matsunaga, K., Uozumi, T., Tsuji, S., & Murai, Y. (1998).
Sympathetic skin responses recorded from non-palmar
and non-plantar skin sites : Their role in the evaluation
of thermal sweating. Electroencephalography and
Clinical Neurophysiology/Evoked Potentials Section,
108(5), Article 5.
Sharkey, K. A., & Pittman, Q. J. (1996). The Autonomic
Nervous System : Peripheral and Central Integrative
Aspects. In R. Greger & U. Windhorst (Éds.),
Comprehensive Human Physiology : From Cellular
Mechanisms to Integration (p. 335‑353). Springer.
Tremblay, J.-M. (2005, février 2). Claude Bernard,
Introduction à l’étude de la médecine expérimentale
(1865).
Tronstad, C., Johnsen, G., Grimnes, S., & Martinsen, Ø.
(2010). A study on electrode gels for skin conductance
measurement. Physiological measurement, 31,
1395‑1410.
BIODEVICES 2025 - 18th International Conference on Biomedical Electronics and Devices
162
