
Analysis of the Relationship Between Intelligence, Sensory Processing
Sensitivity and the Digital Tree Drawing Test: A Feasibility Study
Johanna Emelie Heger
1,2
, Dorothea Isselstein-Mohr
2
, Sebastian Unger
1a
and Thomas Ostermann
2b
1
Department of Psychology and Psychotherapy, Witten/Herdecke University, Witten, Germany
2
ENergietankstelle, Hattingen, Germany
Keywords: Digitalization, Attitudes, Questionnaires, Personality Assessment, Software Validation.
Abstract: The personality trait of intelligence has a research history rich in psychometric tradition, whereas sensory
processing sensitivity is a young construct, which in its conceptualization shows similarities with other
psychological and psychopathological concepts such as introversion, autism spectrum disorder, but also
various giftedness concepts. The digital tree drawing test recently achieved good results in the diagnostics of
cognitive performance losses in adults. The present study investigates whether the characteristics of
intelligence and sensitivity are related and can be mapped in a second step using the digital tree test in the
drawing process. For this purpose, 19 children and adolescents with existing intelligence and sensitivity
diagnoses underwent the digital tree test. The results were evaluated using correlation analyses. Hardly any
significant correlations were found between intelligence and sensitivity. Contrary to the previous assumption,
the correlations found were negative. Drawing parameters, on the other hand, showed clear correlations with
both traits, but here primarily with the sensitivity facets, so that drawing process variables could be identified
which appear to be relevant for the personality traits. Future research could investigate in greater depth the
direction and predictive value of these correlations in order to expand the diagnostic repertoire of
psychological practitioners using the digital tree drawing test.
1 INTRODUCTION
Sensitivity is generally understood as a sensitivity in
one's own experience of feelings and in dealing with
other people. Early descriptions of the characteristic
go back to the psychoanalyst Carl Gustav Jung (1875-
1961), who wrote about sensitivity and introversion
in his typology of characters (Jung, 1913). The
developmental psychologist Jerome Kagan and its
team also contributed the first indications of the
characteristics of high sensitivity: they found, for
example, that a certain percentage of babies appear to
be more open to stimuli than the rest (Kagan et al.,
1994). After following his participants for many
years, he found that these more open babies develop
into more “inhibited” children and adolescents. They
are more cautious, reserved and deliberate (Kagan et
al., 1994), which is reminiscent of today's
descriptions of highly sensitive people, or HSP for
short (Aron & Aron, 1997).
a
https://orcid.org/0009-0000-6251-2923
b
https://orcid.org/0000-0003-2695-0701
It is only in recent years that this temperamental
trait has become the focus of scientific research
alongside social discourse, which is reflected in a
rapid increase in publications. Leading researchers in
the field of sensitivity predominantly use the term
sensory processing sensitivity (SPS) in their studies,
which highlights the connection between sensitivity
and the underlying processing (Greven et al., 2019).
This makes SPS, alongside differential susceptibility
(Belsky & Pluess, 2009) and biological context
sensitivity (Ellis & Boyce, 2011), one of the theories
of environmental sensitivity, an umbrella term for the
perception and processing of environmental stimuli
and the individual characteristics of these abilities
(Pluess, 2015). According to Jagiellowicz et al.
(2016), highly sensitive people are characterized by
deeper stimulus processing and attention to detail, a
tendency to overstimulation and emotional reactivity.
Twin studies have shown a genetic variance
explanation of 47%, which means that almost half of
Heger, J. E., Isselstein-Mohr, D., Unger, S. and Ostermann, T.
Analysis of the Relationship Between Intelligence, Sensory Processing Sensitivity and the Digital Tree Drawing Test: A Feasibility Study.
DOI: 10.5220/0013152400003911
Paper published under CC license (CC BY-NC-ND 4.0)
In Proceedings of the 18th International Joint Conference on Biomedical Engineering Systems and Technologies (BIOSTEC 2025) - Volume 2: HEALTHINF, pages 515-522
ISBN: 978-989-758-731-3; ISSN: 2184-4305
Proceedings Copyright © 2025 by SCITEPRESS – Science and Technology Publications, Lda.
515

the inter-individual sensitivity differences can be
explained genetically and the other half by common
and different environmental influences and the
measurement error, answering the question of
etiology (Assary et al., 2021).
A study examining brain activity found that
people with a high SPS had slower reaction times
(Jagiellowicz et al., 2011). Brain regions associated
with visual processing and attention were
significantly more activated in these individuals, so
that more subtle stimuli and changes could be
perceived.
Another fMRI study found connections between
SPS and attention, empathy, action planning and
situational awareness through altered activity in the
insula, which is responsible for the integration of
sensory stimuli and consciousness, and the medial
temporal gyrus, which is associated with the
recognition of faces (Acevedo et al., 2014).
A connection was also found with the premotor
cortex, where the mirror neurons are located, which
are responsible for recognizing the emotions of other
people, thus enabling empathy (Greven et al., 2019).
A recent study also showed that SPS is associated
with increased resting-state connectivity (Acevedo et
al., 2021). Another finding by Aron et al. (2010) was,
that SPS acts as a moderator for cultural differences
in the processing of visual-spatial tasks and that
people with high SPS therefore show fewer problems
in solving non-culturally congruent tasks.
While SPS was initially conceptualized as a
unidimensional construct, we now know about its
three-dimensional structure: Aesthetic Sensitivity,
AES for short, describes openness and appreciation
for aesthetic and positive stimuli. The Low Sensory
Threshold, LST for short, stands for the perception of
subliminal and detailed stimuli and the associated
attention to things that other people do not notice.
Ease of Excitation, or EOE for short, refers to rapid
overstimulation by extra- and intrapersonal stimuli
and thus relates to the intensity of perception (Pluess
et al., 2018; Smolewska et al., 2006).
Although sensitivity is a continuous trait, people
can be divided into sensitivity groups, where the less
sensitive make up about 20-25%, the moderately
sensitive about 41-47% and the highly sensitive about
20-35% (Lionetti et al., 2018). As a disjunctive
personality trait, high sensitivity is not pathological;
neither high nor low sensitivity are problematic on
their own. However, in combination with negative
events and environments, the risk of mental illness
like depression or anxiety and unfavorable
developmental trajectories increases, which
underlines the importance of correctly identifying
highly sensitive individuals and conducting in-depth
research into the personality trait (Greven et al., 2019;
Krampe & van Randenborgh, 2023).
Intelligence is often conceptualized as a more
cognitive trait, with aspects such as short- and long-
term memory or fluid and crystallized intelligence as
in the Cattell-Horn-Carroll theory or CHC theory for
short (Schneider & McGrew, 2012). However, there
are also more comprehensive concepts that describe
intelligence more broadly and include factors such as
social behavior (Heller, 2013) or creativity (Renzulli,
2011). Therefore, intelligence is considered a
personality trait and, according to Wechsler's (1940)
definition, it describes a general competence to deal
constructively with one's environment. Due to aspects
of SPS that overlap with the different facets of
intelligence, a possible link between both traits is
obvious. However, the number of studies on a
possible connection between SPS, i.e. high
sensitivity, and giftedness has been sparse to date,
although there are also studies on related sensitivity
terms that overlap with SPS in their definition
(Gallagher, 2022; Samsen-Bronsveld et al., 2024;
Winkler & Voight, 2016).
The tree drawing test was originally developed as
a projective method for determining past traumas by
unraveling the unconsious aspects of the psyche, but
it is also established in giving insights on one's
developmental stage by displaying cognitive and
emotional competences (Koch, 2008). Although it is
primarily applied by interpreting the drawing as a
whole, the digitized version focuses on the drawing
process rather than the finished image and has proven
itself in the field of Alzheimer's and dementia
diagnostics as well as the determination of cognitive
impairments (Faundez-Zanuy et al., 2014; Robens,
Heymann, et al., 2019).
In the present study the digital tree drawing test is
used for assessing the cognitive strengths of young
people. The basic idea is that the mechanisms of the
drawing process, which indicate cognitive
impairments, have elementary connections to
cognitive and perceptual abilities, which could
therefore also be evident on the other side of the
spectrum, i.e. higher sensitivity.
Based on these considerations, we hypothesize
that intelligence and sensitivity can be mapped
individually via the drawing process in the digital tree
drawing test. The digital tree drawing test therefore
represents a non-verbal test procedure for
determining intelligence and sensitivity that
complements psychometric procedures.
HEALTHINF 2025 - 18th International Conference on Health Informatics
516
2 MATERIAL AND METHODS
2.1 Recruitment and Setting
Participants were recruited from the
ENergietankstelle Hattingen or the Institut
AMBITION. Both are psychotherapeutic care
facilities for children, adolescents and adults and a
psychological testing center that focuses on people
with high sensitivity and people with giftedness.
The prerequisites for participation in the study
were the existence of an intelligence assessment and
a completed sensitivity assessment. The test batteries
used to determine intelligence were almost all from
the Wechsler test family.
The study took place on the premises of the
practices. These are familiar to the participants and
act as a safe place for them, where they can feel
comfortable. The test administrator and the test
subject were present during the test.
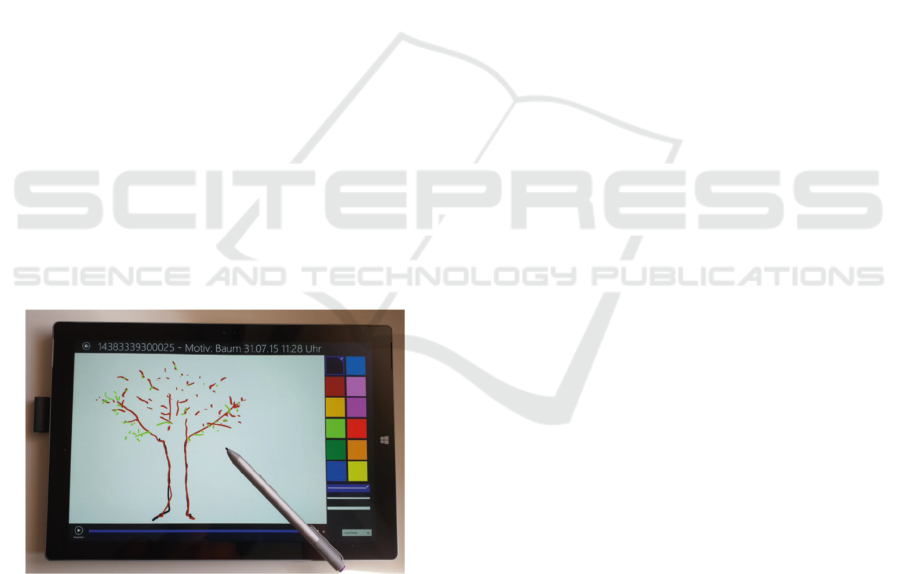
2.2 Assessment Methods
The tree drawings were made on a Microsoft Surface
Pro 3 tablet. The tablet has a 64-bit Windows 8.1 Pro
operating system, a 1.7 GHz Intel Core i7-4650U
dual-core processor with a maximum CPU frequency
of 3.3 GHz, 8 GB of RAM and a resolution of 2160 x
1440 pixels. To draw on the tablet, a pressure-
sensitive digital pen with 4096 pressure sensitivity
levels was used (Figure 1).
Figure 1: Microsoft Surface for the digital Tree Drawing
Task taken from (Robens & Ostermann, 2020).
After familiarizing themselves with the tablet
participants were asked to draw a tree of their choice.
In total, no test took more than 30 minutes.
The intelligence and sensitivity values of the
participants had already been collected in advance,
independently of the present study, using the
Wechsler Intelligence Scale for Children - Fifth
Edition (WISC-V) by Petermann (2017) or previous
versions and the short version of the Highly Sensitive
Child Scale (HSC) by Pluess et al. (2018). Although
sensitivity is a normally distributed and continuous
characteristic, it can be divided into three sensitivity
groups: HSC-values lower than 3.8 indicate lower
sensitivity, values between 3.8 and 4.7 point towards
a moderate sensitivity and values higher than 4.7
indicate high sensitivity.
2.3 Digital Tree Drawing Variables
From the digital tree drawing process, the following
16 variables were extracted:
Total time (s)
Drawing time (s)
Not drawing (%)
Pen pressure
Pressure-velocity relation
Color changes
Color count
Strokes per minute
Line width changes
Line widths
PenUp count
PenUp (%)
PenUp drawing relation
PenUp line length
Mean velocity
Volatile motion
2.4 Statistical Procedures
Data was first summarized using descriptive statistics.
For this purpose, mean values and standard deviations,
minimum, maximum and medians were calculated for
metrical variables and percentages for nominal
variables. All analyses were subdivided into highly
sensitive and low-moderate sensitive individuals.
To test the hypothesis mentioned at the end of
Chapter 1, Pearson's correlation coefficient were
calculated to determine whether sensitivity values
were associated with drawing characteristics. For this
purpose, the sample was considered as a whole and
not subdivided into groups. All analyses were carried
out using SPSS for Windows Version 28.
3 RESULTS
3.1 Sample
The study sample comprises 19 children and
adolescents (11 females and 8 males) aged between 7
Analysis of the Relationship Between Intelligence, Sensory Processing Sensitivity and the Digital Tree Drawing Test: A Feasibility Study
517
and 18 (mean age: 12.5 ± 2.2 years) with a mean IQ
of 124.05 ± 9.41. The sample includes three less
sensitive people (all males) with HSC values < 3.8,
eight moderately sensitive people (all females) with
values between 3.8 and 4.7 and eight highly sensitive
people (3 females and 5 males) with sensitivity values
> 4.7. Table 1 compares the highly sensitive people
with the low and moderately sensitive people and lists
further sociopsychological data on the participants.
Table 1: Sociopsychological data of the total sample
(Abbrev: SPS: Sensory Processing Sensitivity; EOE: Ease
of Excitation; LST: Low Sensory Threshold; AES:
Aesthetic Sensitivity).
High SPS Low/Mod.
SPS
Total
Gender
Male
Female
5 (62.5 %)
3 (37.5 %)
3 (27.3 %)
8 (72.7 %)
8 (42.1 %)
11 (57.9 %)
Age (yrs)
M ± SD
Median
12.3 ± 1.6
12.5
12.6 ± 2.7
12
12.5 ± 2.2
12
IQ
M ± SD
Median
124.1 ± 8.2
125
124.0 ± 10.6
125
124.1 ± 9.4
125
SPS-Total
M ± SD
Median
5.7 ± 0.58
5.5
3.98 ± 0.46
4.08
4.70 ± 1.01
4.5
SPS-EOE
M ± SD
Median
5.7 ± 0.65
5.6
3.91 ± 0.94
4
4.66 ± 1.22
5
SPS-LST
M ± SD
Median
5.65 ± 0.77
5.46
2.61 ± 0.88
2.83
3.89 ± 1.74
3.33
SPS-AES
M ± SD
Median
5.71 ± 0.64
5.62
5.15 ± 0.7
5.5
5.39 ± 0.72
5.5
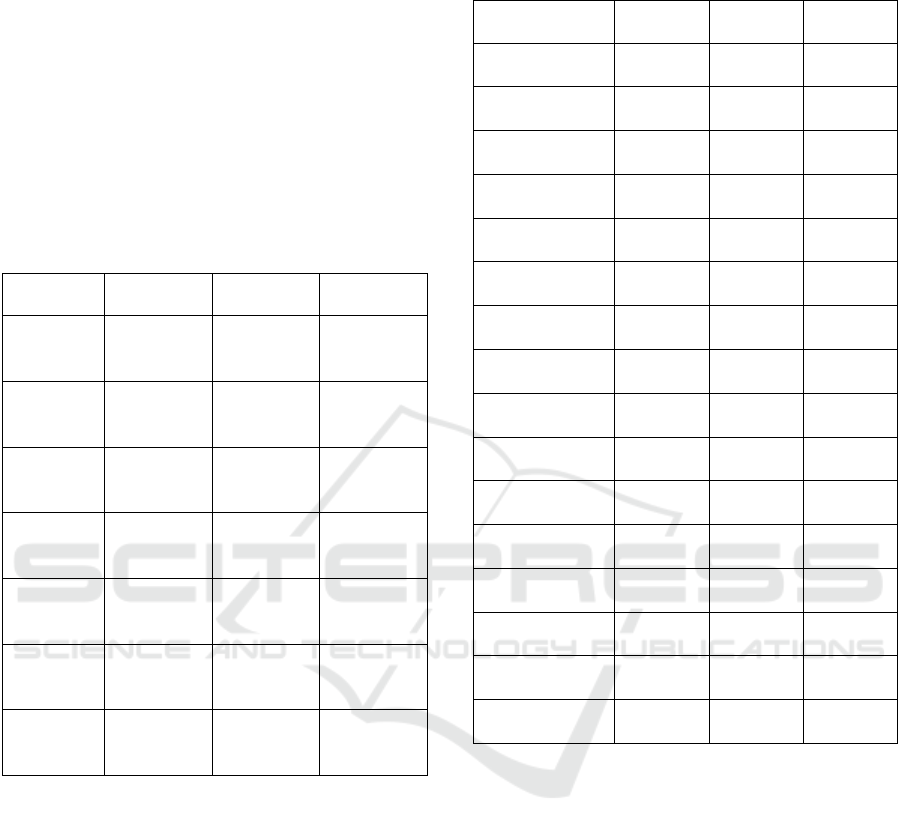
3.2 Key Results
Table 2 shows the features extracted from the digital
tree drawing test. Once again, the highly sensitive
people are compared with the low and moderately
sensitive people. As can be clearly seen, there are
significant differences between the two groups in
terms of digital tree drawing values. This becomes
also evident in the correlation analysis, of which the
Pearson correlation values are shown in Table 3.
As can be seen in Table 3, the total HSC score
(SPS) correlated significantly positively with the
pressure-velocity relation (r = .461, p < 0.05), the line
width changes (r = .461, p < 0.05) and the PenUp
percentage (r = 489, p < 0.05) and highly
significantly negatively with the jumpy character
movements (r = -.634, p < 0.01).
Table 2: Features extracted from the digital tree drawing
test. Data is given in Mean ± SD.
High SPS Low/Mod.
SPS
Total
Total time (s) 649.58
± 238.70
500.88
± 294.01
563.50
± 275.45
Drawing time (s) 265.21
± 144.49
250.83
± 107.22
256.89
± 120.66
Not drawing (%) 0.58
± 0.18
0.42
± 0.18
0.49
± 0.19
Pen pressure 0.25
± 0.09
0.25
± 0.09
0.25
± 0.09
Pressure-velocity
relation
2.08
± 1.01
1.35
± 0.68
1.66
± 0.88
Color changes 18.88
± 7.51
15.18
± 17.94
16.74
± 14.294
Color count 5.5
± 1.85
5.36
± 2.91
5.42
± 2.45
Strokes per
minute
46.31
± 23.65
31.34
± 36.93
37.65
± 32.14
Line width
changes
9.13
± 10.629
6.82
± 4.35
7.79
± 7.47
Line widths 2.75
± 0.46
2.55
± 0.68
2.63
± 0.59
PenUp count 476.88
± 249.01
328.55
± 544.65
391.00
± 441.11
PenUp (%) 0.30
± 0.10
0.21
± 0.13
0.25
± 0.12
PenUp-drawing
relation
0.99
± 0.75
0.49
± 0.50
0.70
± 0.65
PenUp line
length
26702.86
± 16833.60
20906.44
± 39381.20
23347.03
± 31312.04
Mean velocity 8.25
± 5.18
10.53
± 5.73
9.57
± 5.48
Volatile motion 69.18
± 29.88
103.07
± 49.98
88.80
± 45.06
The EOE facet shows a positive correlation with
the pressure-velocity relationship (r = .532, p < 0.05),
a negative correlation with the average velocity (r = -
.556, p < 0.05) and a highly significant negative
correlation with the abrupt drawing movement (r = -
.663, p < 0.01).
The LST shows positive correlations with the Not
Drawing percentage (r = .533, p < 0.05), with the
PenUp percentage (r = .535, p < 0.05) and with the
PenUp-drawing relation (r = .526, p < 0.05), as well
as a negative correlation with the volatile motion
(r = -.544, p < 0.05).
Although, some variables of the digital tree
drawing test correlated with at least one of the HCS
scales, the AES sensitivity facet was the only one that
showed no significant correlations.
HEALTHINF 2025 - 18th International Conference on Health Informatics
518

Table 3: Correlations between the digital tree drawing test
and the HCS-Scales (**: The correlation is significant at the
0.01 level; *: The correlation is significant at the 0.05 level).
SPS EOE LST AES
Total time (s) .304 .128 .361 .301
Drawing time (s) .026 -.038 -.013 .170
Not drawing (%) .431 .315 .533* .169
Pen pressure -.155 -.038 -.222 -.224
Pressure-velocity
Relation
.461* .532* .415 .069
Color changes .099 -.049 .125 .242
Color count -.043 -.024 -.061 -.045
Strokes per
minute
.245 .304 .282 -.096
Line width
changes
.461* .387 .387 .406
Line widths .258 .339 .215 -.003
PenUp count .194 .170 .262 -.003
PenUp (%) .489* .419 .535* .229
PenUp-drawing
r
elation
.421 .313 .526* .146
PenUp line
length
.094 .064 .186 -.095
Mean velocity -.442 -.556* -.292 -.187
Volatile motion -.634** -.663** -.544** -.308
4 DISCUSSION
4.1 Key Findings
The correlation analyses of the sensitivity and
drawing values presented in this pilot study revealed
a large number of significant or highly significant
correlations.
Firstly, the overall sensitivity was positively
related to the pressure/speed ratio, the number of
stroke width changes and the percentage of time the
digital pen is held in the air instead of being used for
drawing. There is a significant negative association
with erratic drawing movements. This coherently
underpins the picture of sensitivity, according to
which more sensitive people also pay attention to
small differences and tend to proceed deliberately and
carefully instead of acting impulsively or
spontaneously (Aron, 1996; Aron et al., 2012).
Secondly, the EOE subscale also correlated
positively with the pressure-speed relationship, was
strongly negatively related to the average drawing
velocity and the abrupt drawing movements and thus
supports the impression that people with higher
sensitivity appear to draw more cautiously, more
nuanced and more slowly or, conversely, appear to be
more sensitive with a more cautious drawing style.
And thirdly, the LST sensitivity factor is
positively associated with the percentage of time not
drawing and the time the pen is held over the tablet
and negatively associated with erratic drawing
movements. This again suggests that increased
sensitivity, in this case in the area of a low sensory
threshold, is associated with a more careful drawing
style.
Future studies with higher sample size of that
people with higher sensitivity could also include
analyses to differentiate between different levels of
sensitivity which have only been rudimentarily
carried out here (Robens, Ostermann, et al. 2019;
Unger, Bayram, et al. 2024). This could open up new
and exciting fields of research, particularly in this
area.
4.2 Limitations
From a methodological perspective, limitations of the
present study can be identified. For example, there is
a clear limitation in the sample size. Although a test
subject group of 19 participants can indicate an initial
direction and appears adequate for a small research
project, a bigger sample size should be examined in
order to achieve truly robust results.
Since most of the participants are clients of a
psychotherapeutic practice with a focus on working
with gifted children and adolescents, almost all of
them have an above-average intelligence quotient.
This means that the group is very homogeneous in
terms of the characteristic of intellectual giftedness
and correlations with other variables such as
sensitivity or the sign parameters are difficult to
identify.
With respect to the correlation analyses, it is
important to note, that the results can be interpreted
in both directions, as correlation analyses only show
whether an association exist but not from which of the
variables it originates. When analyzing the drawing
variables with the personality traits, it nevertheless is
more likely that personality traits influence the
drawing process and not vice versa. However, this has
to be taken into account in future research.
Analysis of the Relationship Between Intelligence, Sensory Processing Sensitivity and the Digital Tree Drawing Test: A Feasibility Study
519

5 CONCLUSION
Various research findings in recent years show, on the
one hand, that the personality trait of intelligence is
constantly being evaluated and adapted to current
scientific findings (McGrew, 2009) and, on the other
hand, that alternative, not purely cognitive
conceptualizations of intelligence and giftedness are
increasingly gaining acceptance in society and in
science (Renzulli, 2011, 2012). In its conception,
sensory processing sensitivity includes, among other
things, an increased perception of detail, attention to
subliminal stimuli and a pronounced responsiveness
to aesthetics (Pluess et al., 2018).
Due to partially overlapping and matching
conceptualizations of both characteristics, there is
reason to assume a positive correlation between the
two characteristics, according to which one could act
as a predictor for the other (De Gucht et al., 2023).
This study investigated this possible correlation.
Unfortunately, a reliable correlation between these
characteristics could not be confirmed, as the group
was too homogeneous in terms of intelligence. In a
second step, it was examined whether these
characteristics can be mapped independently of each
other using the digital tree test and expressed in
character variables. This worked well for cognitive
impairment and psychiatric disorders in older people
in other studies (Robens, Heymann, et al., 2019).
Despite these limitations, the participants in this
study reported good experiences with drawing on the
tablet, which speaks for the practicability and user-
friendly implementation of the digital tree drawing
test. In addition, the added value of this research
project lies in the approach to a thematically still quite
unexplored area. As the scoping review on digital
drawings tools (Unger, Robens, et al., 2024) points
out, there is no previous work that has investigated
both personality traits, i.e. aptitude and sensitivity, in
relation to the digital tree drawing test. It has even
been found that children and adolescents are
generally neglected in the assessment of mental
conditions and efforts in this direction, for example,
cover only the examination of the intuitive operation
of a stylus (Wu et al., 2018). To all appearances, the
digital tree drawing test has so far been used primarily
in the area of cognitive disorders and psychiatric
illnesses, but not in younger groups of people with
more pronounced abilities. Sensory processing
sensitivity, on the other hand, is still a young
construct with a great need for research in order to
minimize the risk of developing mental illnesses by
finding adequate medical and societal understanding
and handling. The present study therefore represents
a first attempt to examine these different
characteristics and processes in conjunction with each
other in a young group of participants. This is
important because different diagnostic tools are
necessary for a multi-layered and individually
accurate diagnosis and working with children and
adolescents, who usually have less developed
linguistic and reflexive skills than adults, poses
particular challenges in this respect.
If it turns out that the tree test is a good tool, not
only in terms of its projective qualities but also as a
process-oriented means of testing high sensitivity,
this would represent a significant gain for practicing
diagnosticians.
REFERENCES
Acevedo, B. P., Aron, E. N., Aron, A., Sangster, M. D.,
Collins, N., & Brown, L. L. (2014). The highly sensitive
brain: an fMRI study of sensory processing sensitivity
and response to others' emotions. Brain and behavior,
4(4), 580-594.
Acevedo, B. P., Santander, T., Marhenke, R., Aron, A., &
Aron, E. (2021). Sensory processing sensitivity predicts
individual differences in resting-state functional
connectivity associated with depth of processing.
Neuropsychobiology, 80(2), 185-200.
Aron, A., Ketay, S., Hedden, T., Aron, E. N., Rose Markus,
H., & Gabrieli, J. D. (2010). Temperament trait of
sensory processing sensitivity moderates cultural
differences in neural response. Social cognitive and
affective neuroscience, 5(2-3), 219-226.
Aron, E. (1996). The highly sensitive person: How to thrive
when the world overwhelms you (Rev. ed.). New York:
Broadway Books.
Aron, E. N., & Aron, A. (1997). Sensory-processing
sensitivity and its relation to introversion and
emotionality. Journal of personality and social
psychology, 73(2), 345.
Aron, E. N., Aron, A., & Jagiellowicz, J. (2012). Sensory
processing sensitivity: A review in the light of the
evolution of biological responsivity. Personality and
Social Psychology Review, 16(3), 262-282.
Assary, E., Zavos, H. M., Krapohl, E., Keers, R., & Pluess,
M. (2021). Genetic architecture of environmental
sensitivity reflects multiple heritable components: A
twin study with adolescents. Molecular Psychiatry,
26(9), 4896-4904.
Belsky, J., & Pluess, M. (2009). Beyond diathesis stress:
differential susceptibility to environmental influences.
Psychological bulletin, 135(6), 885.
De Gucht, V., Woestenburg, D. H., & Backbier, E. (2023).
Do gifted individuals exhibit higher levels of Sensory
Processing Sensitivity and what role do openness and
neuroticism play in this regard? Journal of Research in
Personality, 104, 104376.
HEALTHINF 2025 - 18th International Conference on Health Informatics
520

Ellis, B. J., & Boyce, W. T. (2011). Differential
susceptibility to the environment: Toward an
understanding of sensitivity to developmental
experiences and context. Development and
psychopathology, 23(1), 1-5.
Faundez-Zanuy, M., Sesa-Nogueras, E., Roure-Alcobé, J.,
Garré-Olmo, J., Lopez-de-Ipiña, K., & Solé-Casals, J.
(2014). Online drawings for dementia diagnose: in-air
and pressure information analysis. XIII Mediterranean
Conference on Medical and Biological Engineering and
Computing 2013: MEDICON 2013, 25-28 September
2013, Seville, Spain,
Gallagher, S. (2022). Openness to experience and
overexcitabilities in a sample of highly gifted middle
school students. Gifted Education International, 38(2),
194-228.
Greven, C. U., Lionetti, F., Booth, C., Aron, E. N., Fox, E.,
Schendan, H. E., Pluess, M., Bruining, H., Acevedo, B.,
& Bijttebier, P. (2019). Sensory processing sensitivity
in the context of environmental sensitivity: A critical
review and development of research agenda.
Neuroscience & Biobehavioral Reviews, 98, 287-305.
Heller, K. A. (2013). Findings from the Munich
Longitudinal Study of Giftedness and Their
Impact on Identification, Gifted Education and Counseling.
Talent Development &
Excellence, 5(1).
Jagiellowicz, J., Aron, A., & Aron, E. N. (2016).
Relationship between the temperament trait of sensory
processing sensitivity and emotional reactivity. Social
Behavior and Personality: an international journal,
44(2), 185-199.
Jagiellowicz, J., Xu, X., Aron, A., Aron, E., Cao, G., Feng,
T., & Weng, X. (2011). The trait of sensory processing
sensitivity and neural responses to changes in visual
scenes. Social cognitive and affective neuroscience,
6(1), 38-47.
Jung, C. G. (1913). The theory of psychoanalysis. The
Psychoanalytic Review (1913-1957), 1, 1.
Kagan, J., Snidman, N., Arcus, D., & Reznick, J. S. (1994).
Galen's prophecy: Temperament in human nature.
Koch, K. (2008). Der Baum Test: der Baumzeichenversuch
als psychodiagnostisches
Hilfsmittel (9. ed.). Hans Huber.
Krampe, H., & van Randenborgh, A. (2023).
Hochsensitivität – ein Temperamentsmerkmal
bereichert Psychotherapie. Psychotherapeutenjournal, 2,
138-146.
Lionetti, F., Aron, A., Aron, E. N., Burns, G. L.,
Jagiellowicz, J., & Pluess, M. (2018). Dandelions,
tulips and orchids: Evidence for the existence of low-
sensitive, medium-sensitive and high-sensitive
individuals. Translational psychiatry, 8(1), 24.
McGrew, K. S. (2009). CHC theory and the human
cognitive abilities project: Standing on the shoulders of
the giants of psychometric intelligence research.
Intelligence, 37(1), 1-10.
Petermann, F. (2017). Wechsler Intelligence Scale for
Children - Fifth Edition (WISC-V). Pearson.
Pluess, M. (2015). Individual differences in environmental
sensitivity. Child development perspectives, 9(3), 138-
143.
Pluess, M., Assary, E., Lionetti, F., Lester, K. J., Krapohl,
E., Aron, E. N., & Aron, A. (2018). Environmental
sensitivity in children: Development of the Highly
Sensitive Child Scale and identification of sensitivity
groups. Developmental psychology, 54(1), 51.
Renzulli, J. S. (2011). What makes giftedness?: Reexamining
a definition. Phi Delta Kappa, 92(8), 81-88.
Renzulli, J. S. (2012). Reexamining the role of gifted
education and talent development for the 21st century:
A four-part theoretical approach. Gifted child quarterly,
56(3), 150-159.
Robens, S., Heymann, P., Gienger, R., Hett, A., Müller, S.,
Laske, C., Loy, R., Ostermann, T., & Elbing, U. (2019).
The digital tree drawing test for screening of early
dementia: an explorative study comparing healthy
controls, patients with mild cognitive impairment, and
patients with early dementia of the Alzheimer type.
Journal of Alzheimer's Disease, 68(4), 1561-1574.
Robens, S., Ostermann,T., Heymann, P., Müller, S., Laske,
C., Elbing, U (2019). Comparison of texture features
and color characteristics of digital drawings in
cognitive healthy subjects and patients with amnestic
mild cognitive impairment or early Alzheimer’s
dementia. Biomedical Engineering Systems and
Technologies: 12th International Joint Conference,
BIOSTEC; 412-428.
Robens, S., & Ostermann, T. (2020). Der digitale
Baumzeichentest–Ein kunsttherapeutischer Ansatz
für das Demenz-Screening. Zeitschrift für
Komplementärmedizin, 12(05), 24-28.
Samsen-Bronsveld, H. E., Bakx, A. W., Bogaerts, S., &
Van der Ven, S. H. (2024). A Comparison of Gifted
Children and Children with Low, Average, and Above-
Average Cognitive Abilities in Sensory Processing
Sensitivity in the Primary School Context. Gifted Child
Quarterly, 00169862241239652.
Schneider, W. J., & McGrew, K. S. (2012). The Cattell-
Horn-Carroll model of intelligence. In D. P. Flanagan
& P. L. Harrison (Eds.), Contemporary intellectual
assessment: Theories, tests, and issues (3rd ed., pp. 99–
144). The Guilford Press.
Smolewska, K. A., McCabe, S. B., & Woody, E. Z. (2006).
A psychometric evaluation of the Highly Sensitive
Person Scale: The components of sensory-processing
sensitivity and their relation to the BIS/BAS and “Big
Five”. Personality and individual differences, 40(6),
1269-1279.
Unger, S., Bayram, Z., Anderle, L., & Ostermann, T.
(2024). Random Forest Classification of Cognitive
Impairment Using Digital Tree Drawing Test (dTDT)
Data. Proceedings of the 13th International Conference
on Data Science, Technology and Applications; 585-
592
Unger, S., Robens, S., Anderle, L., & Ostermann, T. (2024).
Digital Drawing Tools for Assessing Mental Health
Conditions-A Scoping Review. Studies in health
technology and informatics, 317, 251-259.
Analysis of the Relationship Between Intelligence, Sensory Processing Sensitivity and the Digital Tree Drawing Test: A Feasibility Study
521

Wechsler, D. (1940). The measurement of adult
intelligence. The Journal of Nervous and Mental
Disease, 91(4), 548.
Winkler, D., & Voight, A. (2016). Giftedness and
overexcitability: Investigating the relationship using
meta-analysis. Gifted Child Quarterly, 60(4), 243-257.
Wu, F. G., Lee, T. H., & Tsai, C. J. (2018). The cognition
and ergonomic design of a direct manipulation digital
drawing pen for children. International Journal of
Industrial Ergonomics, 65, 161-172.
HEALTHINF 2025 - 18th International Conference on Health Informatics
522
