
The Development and Validation of the “Attitudes Towards
Digitalization” (Att-Dig) Questionnaire
Daniel Nierwzol
1,2
, Jan P. Ehlers
3
and Thomas Ostermann
1
1
Department of Psychology and Psychotherapy, Witten/Herdecke University, Witten, Germany
2
SRH University of Applied Health Sciences, Gera, Germany
3
Didactics and Education Research in the Health Sector, Faculty of Health, Witten/Herdecke University, Witten, Germany
Keywords: Digitalization, Attitudes, Questionnaire, Assessment, Validation.
Abstract: Attitudes towards digitalization play a major role in almost all areas of human interaction including the health
care system. Unfortunately, existing assessments and respective instruments on attitudes towards
digitalization are often negatively framed, while balanced and broader approaches exist only marginally. The
aim of this work was therefore to develop an assessment instrument from a self-generated item pool capturing
a broad range of aspects of attitudes towards digitalization. Items were answered in an online survey by a total
of 214 participants (mean age: 30.8±14.4 years 56,1% female). A principal component analysis was
performed and 5 subscales “Digitalisation and Social Life” (5 items, Cronbach's alpha=0.789),” Digitalisation
and Loss of Control” (4 items, Cronbach's alpha=0.817), ” Digitalisation, Knowledge and Education” (4 items,
Cronbach's alpha=0.791), ” Digitalisation and Gain of freedom” (3 items, Cronbach's alpha=0.749), and ”
Digitalisation, Equity and Prosperity” (3 items, Cronbach's alpha=0.699) were extracted covering 63.5% of
the item variance, showing a sufficient internal consistency of the subscales. There were significant
differences for some of the subscales with regard to gender, age, and education. Only weak and non-significant
correlations were found with respect to the subscales “self-efficacy”, “optimism”, and “pessimism” of the
SWOP-K9 questionnaire. Thus, in sum, although there is a need for further research, the Att-Dig is a sound
survey instrument to economically assess the attitude towards digitalisation. It can be used in different areas
of public life and health care and is easy and quick to answer.
1 INTRODUCTION
Digitalization is one of the most important and
powerful trends affecting people’s lives as well as the
development of organizations and societies in the 21
st
century (Parviainen et al., 2017). With the growing
possibilities offered by digital technologies an
increasing number of digital services has emerged
and is being offered in all areas of life creating
transformations, new realities and opportunities for a
better life (Annoni et al. 2023). At the same time,
people experience digitalization as an enormous
challenge that requires extensive adaptation
processes that often lead to excessive demands, self-
doubt and anxiety (Hassani et al., 2021; Dabić et al.,
2023; Teepe et al., 2023).
In the field of healthcare, digitalization very early
was seen as a potential element of a utopia of a fair
and patient-oriented healthcare system. And even if
the first attempts at a digital apparatus for finding
medicines failed in the 19th century (Ostermann,
2019), there was great euphoria a hundred years later
when the first computers seemed to revolutionize the
doctor-patient relationship (Ostermann, 2023).
Pitkienen & Kenzelmann (1966) wrote about
computers used by physicians: “Technology does not
stultify the doctor, but increases his knowledge by
forcing him to deal with a greater number of
diagnostic options”. Or almost at the same time on a
more abstract level: “If physicians are to interact with
computers, the consequences of this behavior must be
reinforicing” (Slack et al., 1970).
However, it is not only the expected benefits but
also the general attitude towards the corresponding
technologies and their inherent transformations that
influence their acceptance by actors in the health care
system (Rivera Romero et al., 2024), which also
includes the patient’s views and experiences of this
topic (Kulzer et al., 2022; Gybel et al., 2024). So far,
Niewrzol, D., Ehlers, J. P. and Ostermann, T.
The Development and Validation of the “Attitudes Towards Digitalization” (Att-Dig) Questionnaire.
DOI: 10.5220/0013152700003911
Paper published under CC license (CC BY-NC-ND 4.0)
In Proceedings of the 18th International Joint Conference on Biomedical Engineering Systems and Technologies (BIOSTEC 2025) - Volume 2: HEALTHINF, pages 523-529
ISBN: 978-989-758-731-3; ISSN: 2184-4305
Proceedings Copyright © 2025 by SCITEPRESS – Science and Technology Publications, Lda.
523

according to (Cresswell et al., 2023) this might also
include “unmeasurable” dimensions.
Thus, attitudes towards digital technologies play
an important role and should be explored in more
detail. Unfortunately, existing assessments on
attitudes towards digitalization are often negatively
framed and focus on fears or dystopian elements,
while balanced and broader approaches exist only
marginally. The picture is similar at the level of
assessment instruments: the only validated scale, the
Digitalisation Anxiety Scale (DAS), focuses on fear
of digitalization (Pfaffinger et al., 2021).
The aim of this work is therefore to develop an
assessment instrument from a self-generated item
pool that should be able to capture a broad range of
aspects of attitudes towards digitalization.
2 MATERIAL AND METHODS
In order to capture a broad range of aspects of
attitudes towards digitalisation, items were generated
in a psychological assessment class on test
construction with 38 students of psychology at the
University of Witten/Herdecke, which then were
handed over to an in-house expert panel consisting of
two health care experts, two psychologists and one
computer scientist, who finally selected 19 items,
which could be answered on a 6-point Likert scale
from 1 = absolutely disagree to 6 = absolutely agree.
From June to September 2018, participants aged
at least 18 years were recruited for the survey through
direct contact as well as through distribution on social
media groups. For data collection, the online survey
tool SoSciSurvey was used. Participants who were
not able to use the online survey, were allowed to
answer in a paper-pencil questionnaire version.
Ethical approval was obtained from the Ethical
Committee of Witten/Herdecke University (ID: S-
318/2023; approved on 19 December 2023).
Principal components analysis (PCA) was used to
analyse relations between the items and to detect
potential factors. Beforehand, Kaiser-Meyer-Olkin
criterion: (KMO≥ 0.50) and Bartlett test of sphericity
were calculated to determine whether the items were
appropriate for PCA. To determine the number of
reliable items, Item communalities were calculated. A
communality value of 0.5 was chosen as cutoff value
above which items were included in an exploratory
factor analysis (Schreiber, 2021).
To obtain a solution with independent factors
Varimax rotation was applied to arrive at a solution
explaining the maximum amount of variance. Kaiser-
Gutman criterion (Eigenvalue > 1) and Scree-Plot
investigation was used to categorize a factor as
meaningful. Internal consistency was examined by
calculating Cronbach’s alpha for the single factors.
Internal reliability was assessed by means of item-
factor correlations.
Sub-scale means were calculated for the total
sample and the groups based on the socio-
demographic parameters gender, age, education and
income. For that purpose one-factorial Analysis of
Variance (ANOVA) was calculated to detect
significant differences based on a level of
significance of 5%.
Finally correlations with the subscales of the
SWOP-K9 questionnaire (Scholler et al., 1999) were
performed. This short questionnaire consists of 9
items measuring “self-efficacy” (5 items),
“optimism”, and “pessimism” (2 items each). Due to
the fact that optimism and self-efficacy is positively
associated with an "affinity for technology" (Edison
et al., 2003) this questionnaire was used for external
validation.
3 RESULTS
3.1 Sample
A total of N=214 participants aged between 18 and 92
years (Mean age: 30.8± 14.4 years) of whom 120
(56.1%) were female completed the survey and were
included in the evaluation.
Table 1: Sociodemographic data of the total sample.
Gender
Male
Female
94 (43.9%)
120 (56.1%)
Age (years)
Mean ± SD
Median
30.8 ± 14.4
24.0
Relationship status
In a relationship/married
Single and other relationship
129 (60.3%)
87 (39.7%)
School Education
High-school
Other schools
173 (80.8%)
41 (19.2%)
Monthly income
<2,000 €
> 2,000 €
No answe
r
119 (55.6%)
87 (36.0%)
18 (8.4%)
Raised in (inhabitants)
<100,000
>100,000
146 (68.2%)
68 (31.8%)
Job area
Health & Social Sector
Others (Education, Finance,
R&D, …)
106 (49.5%)
108 (50.5%)
HEALTHINF 2025 - 18th International Conference on Health Informatics
524
Almost half of them (n=106; 49.5%) stated to
work in the health or social sector. More than half of
the participants were married or in a relationship
(n=129; 60.3%), while 81 participants (37.9%) stated
to be single. 4 out of 5 participants (n=173; 80.8%)
had a high school exam and almost one third of the
sample (n=75; 35.0%) had a monthly income below
1,000 €, while the second third of the sample had a
monthly income between 1,000€ and 3,000€ (n=73;
34.2%). One hundred forty-six participants
(68.2%)
grew up in a small or middle town (< 100,000 inhabitants)
(Table 2). A more detailed description of the sample is
given in Niewrzol and Ostermann (2024).
3.2 Principal Component Analysis
A KMO of .850 and a significant Bartlett’s test of
sphericity (χ2(171) = 1493.5 p < .001), confirmed that
the items were suitable for an exploratory factor
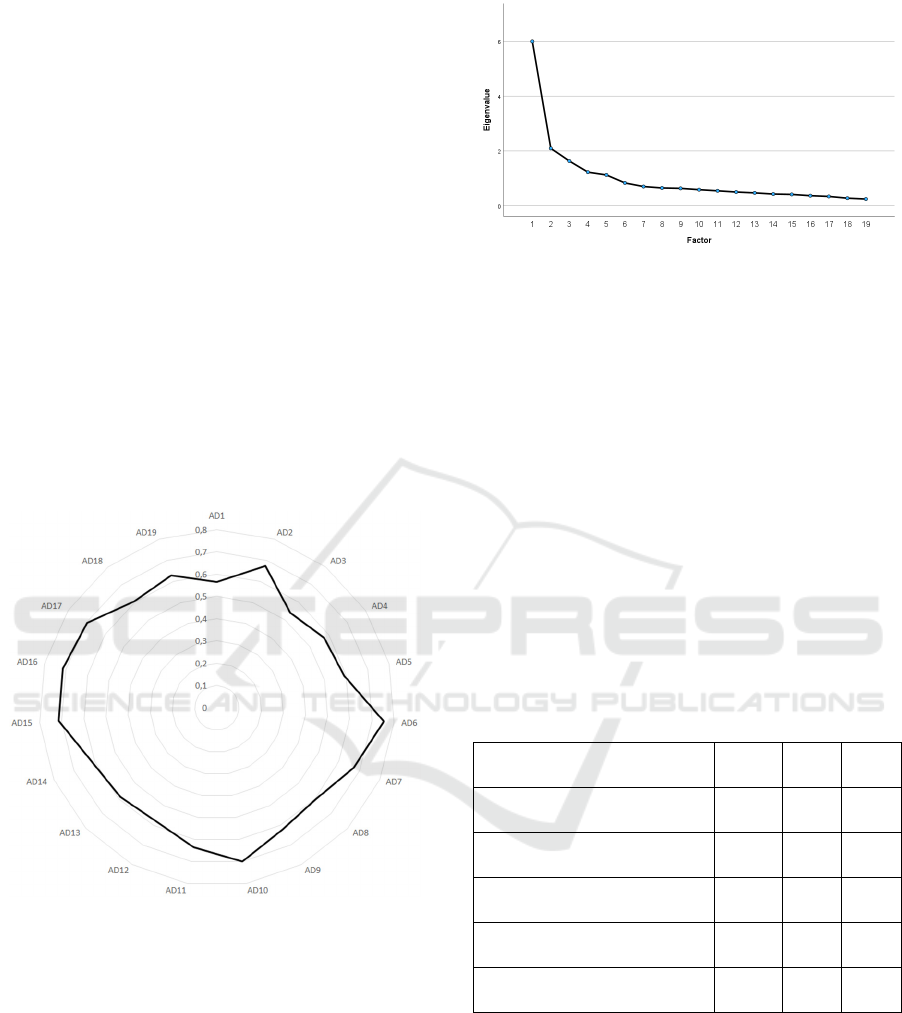
analysis. This was also confirmed by the
communality values which were located between
0.565 and 0.753 (Figure 1).
Figure 1: Communalities of the items in order of their
appearance in tables 2-6.
After six iterations of Varimax rotation, PCA
found five main components with Eigenvalues > 1
explaining 63.5% of the variance. Visual inspection
of the screeplot suggested at least 4 dimensions as
sufficiently meaningful, as after the fourth factor the
amount of the slope in the scree plot changes
significantly downwards (Figure 2).
Figure 2: Screeplot of the factors.
The first factor explained 31.6% of the variance
and included 5 items dealing with the improvement
of social life through digitalisation, i.e.
“Digitalisation improves my relationship with
people” or “Digitalisation creates connectedness”.
Factor loadings of the items ranged between 0.656
and 0.728 with only one side loadings >0.3 for the
fitht factor for the item “Digitalisation can make
relationships much more intense”. With Cronbach’s α
of 0.789 the internal consistency of this factor can be
considered as very good. Correlation of the items with
the factor ranged between 0.498 and 0.636. The scale
was named “Digitalisation and Social Life” (DSL).
Table 2: Factor 1 (DSL): Results of the PCA, reliability and
Items parameters (M= mean; SD = standard deviation; FL
= Factor loading; r(I-F) = Correlation of the items with the
factor). Scale range from 1= completely disagree to 6=
completely agree).
Items AD01 to AD05
Digitalization…
M ±
SD
FL r(I-F)
…enables me to better commu-
nicate what is important to me
3.03 ±
1.27
.728 .636
…improves my relationship with
people.
2.91 ±
1.37
.718 .556
… creates connectedness. 3.46 ±
1.16
.696 .498
…enables me to get more socially
involved.
3.02 ±
1.37
.663 .566
…can make relationships much
more intense.
2.74 ±
1.36
.656 .586
The second factor explained 11.0% of the
variance and included 4 items dealing with the loss of
control through digitalisation, i.e. “Digitalization
means a loss of self-determination”.
The Development and Validation of the “Attitudes Towards Digitalization” (Att-Dig) Questionnaire
525

Table 3: Factor 2 (DLC): Results of the PCA, reliability and
Items parameters (M= mean; SD = standard deviation; FL
= Factor loading; r(I-F) = Correlation of the items with the
factor). Scale range from 1= completely disagree to 6=
completely agree).
Items AD06 to AD09
Digitalization…
M ±
SD
FL r(I-F)
… leaves me at its mercy 2.96 ±
1.28
.817 .637
… means a loss of control 3.17 ±
1.50
.787 .716
… makes me helpless 2.35 ±
1.14
.750 .587
… means a loss of self-
determination
3.34 ±
1.34
.745 .628
Factor loadings of the items ranged between 0.745
and 0.817. With Cronbach’s α of 0.817 the internal
consistency of this factor can be considered as
excellent. Correlation of the items with the factor
ranged between 0.587 and 0.716. The scale was
named “Digitalisation and Loss of Control” (DLC).
The third factor explained 8.6% of the variance
also including 4 items dealing with the loss of control
through digitalisation, i.e. “Digitalization increases
the collective knowledge”. Factor loadings of the
items ranged between 0.656 and 0.821. With
Cronbach’s α of 0.791 the internal consistency of this
factor can be considered as very good. Correlation of
the items with the factor ranged between 0.578 and
0.627. The scale was named “Digitalisation,
Knowledge and Education” (DKE).
Table 4: Factor 3 (DKE): Results of the PCA, reliability and
Items parameters (M= mean; SD = standard deviation; FL
= Factor loading; r(I-F) = Correlation of the items with the
factor). Scale range from 1= completely disagree to 6=
completely agree).
Items AD10 to AD13
Digitalization…
M ±
SD
FL r(I-F)
…increases the collective
knowledge
4.45 ±
1.209
.821 .617
… expands the collective
memory
3.99 ±
1.372
.756 .578
… creates education for all 3.91 ±
1.283
.695 .585
… promotes freedom of
expression.
3.93 ±
1.284
.656 .627
The fourth factor explained 6.4% of the variance
and includes 3 items dealing with the gain of freedom
through digitalisation, i.e. “Digitalisation takes work
out of my hands”. Factor loadings of the items ranged
between 0.623 and 0.831. With Cronbach’s α of 0.749
the internal consistency of this factor can be
considered as very good.
Table 5: Factor 4 (DGF): Results of the PCA, reliability and
Items parameters (M= mean; SD = standard deviation; FL
= Factor loading; r(I-F) = Correlation of the items with the
factor). Scale range from 1= completely disagree to 6=
completely agree).
Items AD14 to AD16
Digitalization…
M ±
SD
FL r(I-F)
…takes work out of my hands 4.12 ±
1.20
.831 .537
… improves my daily life 4.19 ±
1.07
.731 .654
… means freedom. 3.55 ±
1.30
.623 .554
Correlation of the items with the factor ranged
between 0.537 and 0.654. The scale was named
“Digitalisation and Gain of freedom” (DGF).
The fifth and last factor explained 6.4% of the
variance and includes 3 items dealing with equity and
prosperity through digitalisation, i.e. “Digitalisation
will create prosperity for everyone”.
Table 6: Factor 5 (DEP): Results of the PCA, reliability and
Items parameters (M= mean; SD = standard deviation; FL
= Factor loading; r(I-F) = Correlation of the items with the
factor). Scale range from 1= completely disagree to 6=
completely agree).
Items AD17 to AD17
Digitalization…
M ±
SD
FL r(I-F)
… solves our environmental
problems
2.34 ±
1.21
.791 .514
… creates equity and justice 2.15 ±
1.11
.698 .531
… will create prosperity for
everyone
2.52 ±
1.17
.687 .503
Factor loadings of the items ranged between 0.687
and 0.791. With Cronbach’s α of 0.699 the internal
consistency of this factor can be considered as good.
Correlation of the items with the factor ranged
between 0.503 and 0.531. The scale was named
“Digitalisation, Equity and Prosperity” (DEP).
Based on the results of the PCA, the
corresponding scale means were calculated and
examined for differences in relation to socio-
demographic aspects and for correlations with the
SWOP-K9 subscales.
Figures 3-8 show the values of the Att-Dig
subscales with respect to the sociodemographic
subgroups.
HEALTHINF 2025 - 18th International Conference on Health Informatics
526
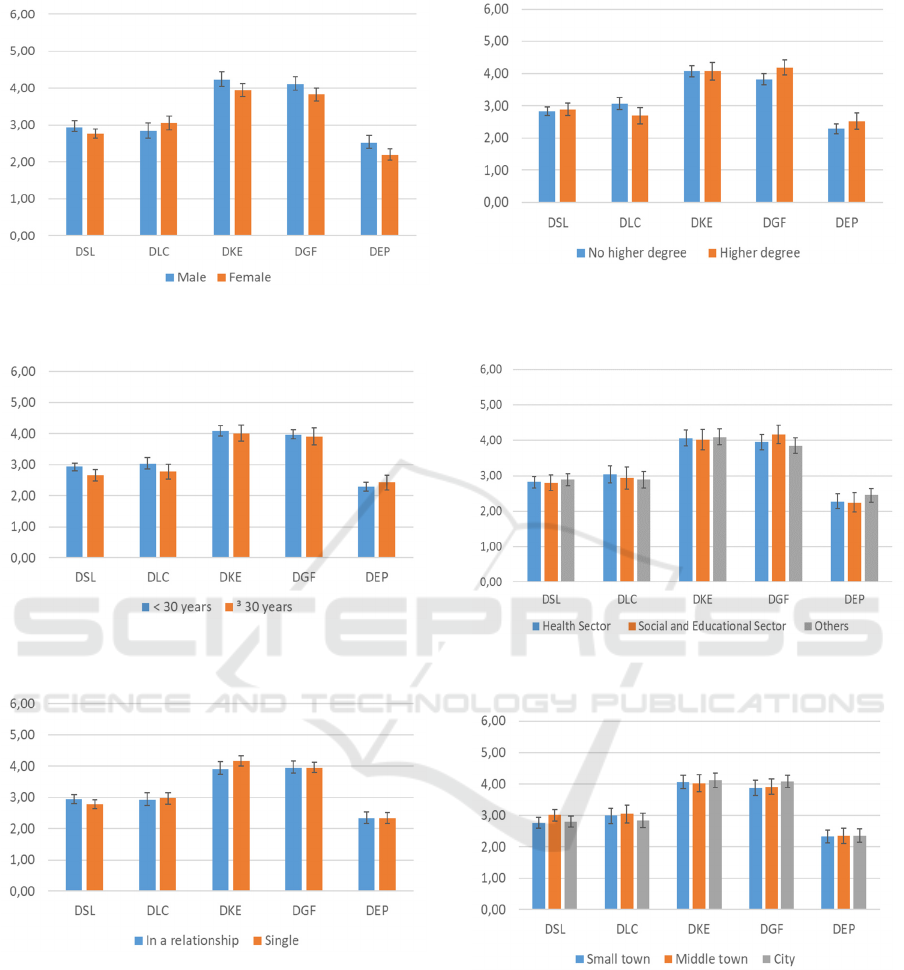
Figure 3: Mean values of the Att-Dig subscales with respect
to gender (Error bars show the 95% confidence interval).
Figure 4: Mean values of the Att-Dig subscales with respect
to age (Error bars show the 95% confidence interval).
Figure 5: Mean values of the Att-Dig subscales with respect
to relationship status (Error bars show the 95% confidence
interval).
Figure 6: Mean values of the Att-Dig subscales with respect
to educational degree (Error bars show the 95% confidence
interval).
Figure 7: Mean values of the Att-Dig subscales with respect
to job sector (Error bars show the 95% confidence interval).
Figure 8: Mean values of the Att-Dig subscales with respect
to socialisation (Error bars show the 95% confidence
interval).
In particular significant differences were found in
the subscale DSL with respect to age (F=6.052;
p=0.015), DLC (F= 6.104; p= 0.014) and DGF
(F=6.252; p= 0.013) with respect to educational
degree, and DKE (F= 4.128; p= 0.043), DGF (F=
4.506; p=0.0035) and DEP (F= 6.283; p= 0.013) with
respect to gender.
The Development and Validation of the “Attitudes Towards Digitalization” (Att-Dig) Questionnaire
527

Table 8 shows the correlation with the SWOP-K9
subscales “self-efficacy”, “optimism”, and
“pessimism”.
Table 8: Correlations with the SWOP-K9 subscales “self-
efficacy” (SE), “optimism” (OP), and “pessimism” (PM).
Att-DIG/SWOP subscales SE OP PM
DSL 0.012 -0.047 -0.011
DLC -0.152 -0.041 -0.016
DKE 0.06 0.125 -0.093
DGF 0.086 0.13 -0.034
DEP 0.08 0.024 -0.022
All correlations were weak and only the
correlation of “Digitalisation and Loss of Control”
(DLC) with “Self efficacy” (SE) was significant
(p=0.026) and negative (r=-0.152) which due to the
nature of the scales and their meaning is rather
evident.
4 DISCUSSION
Digitalization is becoming increasingly important in
every society and in every area of society and is
increasingly determining people's everyday lives.
This applies in particular to the healthcare system,
where digitalization is playing an increasingly
important role in patient care such as in projects like
“Open notes” (O’Neill et al, 2021) or when
introducing the “Electronic Health Card” in the
German health care system (Jorzig et al., 2020)
Thus there is an urgent need for research on scales
and questionnaires quantifying attitudes towards
digitalisation. This article aims at contributing to this
field of research and summarizes first results of the
development and validation of the Attitudes towards
Digitalisation Questionnaire (Att-Dig). Our analysis
yielded a stable and convergent five-factor solution
that exhibited convincing validity with values of
Cronbach's alpha between 0.699 and 0.817).
Correlations with the SWOP-K9 were
neglectable, while differences especially with respect
to gender and education need further investigations.
Our study has some limitations. Firstly, the item
selection did not rely on conceptual theoretical
models as already been discussed in (Niewrzol &
Ostermann, 2024). This however does not directly
imply that the questionnaire is invalid, but futher
inspection of the results is recommended in particular
due to the fact that digitalisation has advanced in the
last 5 years. However, as with other constructs, it can
be assumed that the factorial structure remains the
same even after six years even if attitudes towards
digitalization may have changed. Thus this work
cleary focusses mainly on the validity of the scales
rather than discussing the outcomes of the survey. In
particular critical items, e.g. "Digitization increases
the collective knowledge" or "Digitization does/does
not create equity and justice" have not be discussed
based on this data set but may be subject to future
studies.
In addition, technical readiness and socio-
organizational factors should also be taken into
account in further studies when measuring the
attitudes towards digitization in a given context and
should be surveyed in studies using the Att-Dig. This
in particular is relevant in the health context, in which
previous surveys have shown very high approval
ratings for digitization (Veikkolainen et al., 2023)
Secondly the sample size in the present study is
borderline. Although communality values as given in
this study according to (Schreiber, 2021) justify a
sample size of around 200, Costello & Osborne
(2009) argue that the required sample size of a factor
analytical approach should at least have a subject to
item ratio of 10:1 but preferable a ratio of 20:1 to
avoid an unstable factor structure. Thus 214
participants can be regarded as adequate just at the
border of a sufficient sample size.
From a methodological point of view, the use of
an exploratory factor analysis can be criticized and in
the construction of psychological constructs it is often
suggested to do a confirmatory factor analysis instead
(Schreiber, 2019). Moreover, the use of a PCA
instead of e.g. a principal axis factoring (PAF)
approach is also still a matter of discussion (Niewrzol
& Ostermann, 2024). Here, a simulation study found
that PCA loadings might be better approximations of
the true factor loadings than the loadings produced by
PAF (de Winter et al. 2016). Thus, although this
discussion is still ongoing, we believe that our
approach has produced sufficiently reliable scales,
which was confirmed not least by Horn's parallel
analysis.
Nevertheless, not only for methodological reason
i.e. sample size, have we suggested replicating the
survey on other samples such as schoolchildren or
older people or in other health related contexts in
order to analyse measurement invariances which was
not possible in the present study.
5 CONCLUSION
In sum, although there is a need for further research,
the Att-Dig is a sound survey instrument to
economically assess the attitude towards
HEALTHINF 2025 - 18th International Conference on Health Informatics
528

digitalisation. It can be used in different areas of
public life and health care and is easy and quick to
answer.
REFERENCES
Annoni, A., Nativi, S., Çöltekin, A., Desha, C.,
Eremchenko, E., Gevaert, C. M., et al. (2023). Digital
earth: yesterday, today, and tomorrow. International
Journal of Digital Earth, 16(1), 1022-1072.
Costello, A. B., & Osborne, J. (2019). Best practices in
exploratory factor analysis: Four recommendations for
getting the most from your analysis. Practical
assessment, research, and evaluation, 10(1), 7.
Cresswell, K., Anderson, S., Montgomery, C., Weir, C. J.,
Atter, M., & Williams, R. (2023). Evaluation of
Digitalisation in Healthcare and the Quantification of
the “Unmeasurable”. Journal of General Internal
Medicine, 38(16), 3610-3615.
Dabić, M., Maley, J. F., Švarc, J., & Poček, J. (2023).
Future of digital work: Challenges for sustainable
human resources management. Journal of Innovation &
Knowledge, 8(2), 100353.
De Winter, J. C., & Dodou, D. (2016). Common factor
analysis versus principal component analysis: a
comparison of loadings by means of simulations.
Communications in Statistics-Simulation and
Computation, 45(1), 299-321.
Edison, S. W.; Geissler, G. L. (2003). Measuring attitudes
towards general technology: Antecedents, hypotheses
and scale de-velopment. Journal of Targeting,
Measurement and Analysis for Marketing, 12(2), 137-
156.
Gybel Jensen, C., Gybel Jensen, F., & Loft, M. I. (2024).
Patients’ Experiences With Digitalization in the Health
Care System: Qualitative Interview Study. Journal of
Medical Internet Research, 26, e47278.
Hassani, H., Huang, X., & Silva, E. (2021). The human
digitalisation journey: Technology first at the expense
of humans? Information, 12(7), 267.
Jorzig, A., Sarangi, F., Jorzig, A., & Sarangi, F. (2020).
Grundlagen der elektronischen Gesundheitskarte.
Digitalisierung im Gesundheitswesen: Ein kompakter
Streifzug durch Recht, Technik und Ethik, 193-196.
Kulzer, B., Heinemann, L., & Roos, T. (2022). Patients’
experience of new technologies and digitalization in
diabetes care in Germany. Journal of Diabetes Science
and Technology, 16(6), 1521-1531.
Maeckelberghe, E., Zdunek, K., Marceglia, S., Farsides, B.,
& Rigby, M. (2023). The ethical challenges of
personalized digital health. Frontiers in Medicine, 10,
1123863.
Niewrzol, D. B., & Ostermann, T. (2024). Development
and Validation of the Attitudes towards Social Robots
Scale. Healthcare, 12(3), 286.
O’Neill, S., Blease, C., & Delbanco, T. (2021). Open notes
become law: a challenge for mental health practice.
Psychiatric Services, 72(7), 750-751.
Ostermann, T. (2019). Digital Integrative Medicine–Just
Knocking on Wood or a Bit More? Complementary
Medicine Research, 26(1), 1-2.
Ostermann, T., Röer, J. P., & Tomasik, M. J. (2021).
Digitalization in psychology: A bit of challenge and a
byte of success. Patterns, 2(10), 100334.
Ostermann, T. (2023). Künstliche Intelligenz im
Gesundheitswesen: Historische Entwicklung. In:
Handbuch Digitale Gesundheitswirtschaft: Analysen
und Fallbeispiele (pp. 11-14). Wiesbaden: Springer
Fachmedien Wiesbaden.
Parviainen, P., Tihinen, M., Kääriäinen, J., & Teppola, S.
(2017). Tackling the digitalization challenge: how to
benefit from digitalization in practice. International
Journal of Information Systems and Project
Management, 5(1), 63-77.
Pfaffinger, K. F., Reif, J. A., Huber, A. K., Eger, V. M.,
Dengler, M. K., Czakert, J. P., et al. (2021).
Digitalisation anxiety: development and validation of a
new scale. Discover Mental Health, 1(1), 3.
Pirtkien R, Kenzelmann E (1966): Die Arzneifindung in der
Homöotherapie mit Hilfe eines Computers, AHZ 1966;
211(2): 62-69.
Rivera Romero, O., Chae, H. W., Faienza, M. F., Vergani,
E., Cheon, C. K., Di Mase, R., et al., E. (2024).
Healthcare professionals’ perspectives towards the
digitalisation of paediatric growth hormone therapies:
expert panels in Italy and Korea. Frontiers in
Endocrinology, 15, 1419667.
Scholler, G., Fliege, H., Klapp, B. (1999). Fragebogen zu
Selbstwirksamkeit, Optimismus und Pessimismus.
Psychother Psychosom Med Psychol 49:275-283.
Schreiber, J. B. (2021). Issues and recommendations for
exploratory factor analysis and principal component
analysis. Research in Social and Administrative
Pharmacy, 17(5), 1004-1011.
Slack, W.V., Van Cura, L.J., Greist, J.H. (1970). Computers
and doctors; use and consequences. Proceedings of a
Conference on Medical Information Systems, San
Francisco, 145-152
Teepe, G. W., Glase, E. M., & Reips, U. D. (2023).
Increasing digitalization is associated with anxiety and
depression: A Google Ngram analysis. Plos one, 18(4),
e0284091.
Veikkolainen, P., Tuovinen, T., Jarva, E., Tuomikoski, A.
M., Männistö, M., Pääkkönen, J., et al. (2023). eHealth
competence building for future doctors and nurses–
Attitudes and capabilities. International Journal of
Medical Informatics, 169, 104912.
The Development and Validation of the “Attitudes Towards Digitalization” (Att-Dig) Questionnaire
529
