
SAT: Segment and Track Anything for Microscopy
Nabeel Khalid
1,5,∗ a
, Mohammadmahdi Koochali
1,∗ b
, Khola Naseem
1,5 c
, Maria Caroprese
6 d
,
Gillian Lovell
3 e
, Daniel A. Porto
7 f
, Johan Trygg
2,4 g
, Andreas Dengel
1,5 h
and Sheraz Ahmed
1 i
1
German Research Center for Artificial Intelligence (DFKI) GmbH, 67663 Kaiserslautern, Germany
2
Sartorius Corporate Research, Ume
˚
a, Sweden
3
Sartorius BioAnalytics, Royston, U.K.
4
Computational Life Science Cluster (CLiC), Ume
˚
a University, Ume
˚
a, Sweden
5
RPTU Kaiserslautern–Landau, 67663 Kaiserslautern, Germany
6
Sartorius Digital Solutions, Royston, U.K.
7
Sartorius BioAnalytics, Ann Arbor, U.S.A.
Keywords:
Biomedical, Healthcare, Deep Learning, Cell Segmentation, Cell Tracking, Segment Anything, Track
Anything, Microscopy.
Abstract:
Integrating cell segmentation with tracking is critical for achieving a detailed and dynamic understanding of
cellular behavior. This integration facilitates the study and quantification of cell morphology, movement, and
interactions, offering valuable insights into a wide range of biological processes and diseases. However, tra-
ditional methods rely on labor-intensive and costly annotations, such as full segmentation masks or bounding
boxes for each cell. To address this limitation, we present SAT: Segment and Track Anything for Microscopy,
a novel pipeline that leverages point annotations in the first frame to automate cell segmentation and tracking
across all subsequent frames. By significantly reducing annotation time and effort, SAT enables efficient and
scalable analysis, making it well-suited for large-scale studies. The pipeline was evaluated on two diverse
datasets, achieving over 80% Multiple Object Tracking Accuracy (MOTA), demonstrating its robustness and
effectiveness across various imaging modalities and cell types. These results highlight SAT’s potential to
streamline biomedical research and enable deeper exploration of cellular behavior.
1 INTRODUCTION
Cell tracking is essential in biology and medicine, of-
fering insights into cellular behavior and responses to
stimuli (Newman et al., 2011). In cancer research,
cell tracking aids in studying tumor growth, metas-
tasis, and the efficacy of anti-cancer drugs, while in
stem cell research, it helps observe differentiation and
a
https://orcid.org/0000-0001-9274-3757
b
https://orcid.org/0000-0001-8780-253X
c
https://orcid.org/0000-0003-4785-2588
d
https://orcid.org/0009-0009-2170-1459
e
https://orcid.org/0009-0004-5180-9704
f
https://orcid.org/0000-0002-1021-2467
g
https://orcid.org/0000-0003-3799-6094
h
https://orcid.org/0000-0002-6100-8255
i
https://orcid.org/0000-0002-4239-6520
*
These authors contributed equally to this work.
regenerative potential (Aramini et al., 2022). This
technique is vital in drug development for assessing
drug impact and efficacy and in immunology for un-
derstanding immune cell interactions and responses
(Yazdi and Khotanlou, 2024). Accurate cell segmen-
tation is essential for tracking, providing data to mon-
itor cell movement and behavior over time (Chou
et al., 2023). Without precise segmentation, tracking
algorithms may misidentify cells, leading to errors.
The importance of cell segmentation lies in its abil-
ity to quantify cell morphology, analyze cellular in-
teractions, and support high-throughput screening in
drug development (Durkee et al., 2021). Addition-
ally, it aids in understanding developmental processes
and immune responses by characterizing specific cell
populations (Padovani et al., 2022).
• Introduction of the SAT (Segment and Track Any-
thing for Microscopy) pipeline, which leverages
286
Khalid, N., Koochali, M., Naseem, K., Caroprese, M., Lovell, G., Porto, D. A., Trygg, J., Dengel, A. and Ahmed, S.
SAT: Segment and Track Anything for Microscopy.
DOI: 10.5220/0013154200003890
In Proceedings of the 17th International Conference on Agents and Artificial Intelligence (ICAART 2025) - Volume 2, pages 286-297
ISBN: 978-989-758-737-5; ISSN: 2184-433X
Copyright © 2025 by Paper published under CC license (CC BY-NC-ND 4.0)
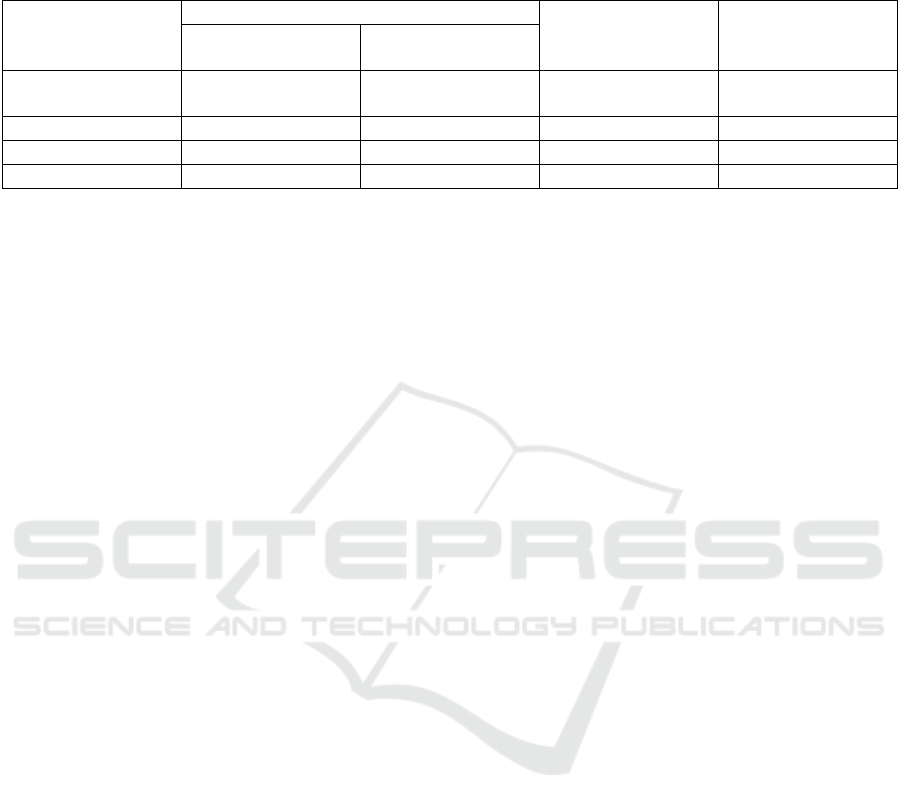
Table 1: Comparison of supervision time between Full Mask and Tracking, and the SAT method. The SAT method involves
point annotation only in the first frame. SAT (5 points per cell) saves significant time compared to full mask tracking, making
it approximately 206 times faster.
Method
Time per Cell per Frame (s)
Total Time (A+T)
for 100 Frames
(min)
Times Faster than
Full Mask (x)
Segmentation/Point
Annotation (A)
Tracking (T)
Full Mask and
Tracking
46 0.438 77.40 -
SAT (N=3) 3 × 0.9 = 2.7 0 0.225 ≈ 344
SAT (N=5) 5 × 0.9 = 4.5 0 0.375 ≈ 206
SAT (N=10) 10 × 0.9 = 9 0 0.75 ≈ 103
point annotations in the first frame to automate
cell segmentation and tracking, significantly re-
ducing the time and effort required compared to
traditional methods.
• Comprehensive evaluation of the SAT pipeline on
subsets of two extensive and diverse cell track-
ing datasets: the Cell Tracking Challenge (CTC)
(Ma
ˇ
ska et al., 2023) and the Cell Tracking with
Mitosis Detection Challenge (CTMC) (Anjum
and Gurari, 2020) datasets, demonstrating the
method’s robustness and generalization capabil-
ity.
• Achieving high tracking accuracy, with Multi-
ple Object Tracking Accuracy (MOTA) exceeding
80%, and demonstrating time savings of over 100
times compared to full mask annotation methods.
The remainder of this paper is structured as follows:
Section 2 reviews the existing literature and chal-
lenges in cell segmentation and tracking. Section 3
introduces the SAT pipeline, detailing its design and
functionality. Section 4 describes the datasets uti-
lized in the study. Section 5 presents the metrics used
for performance assessment, followed by Section 6,
which outlines the experimental setup for evaluating
the proposed pipeline. Section 7 provides a detailed
analysis and discussion of the results. Finally, Sec-
tion 8 concludes the paper and suggests directions for
future research.
2 LITERATURE REVIEW
2.1 Existing Cell Segmentation and
Tracking Approaches
There are numerous studies on cell segmentation and
tracking (Edlund et al., 2021; Stringer et al., 2020;
Jelli et al., 2023; Khalid et al., 2023; Ma
ˇ
ska et al.,
2023) which require full masks for training or some
form of weak supervision. Traditional segmentation-
first approaches often focus on generating accurate
segmentation masks for individual cells, followed by
linking these segmented regions across time frames to
produce tracking results (Malin-Mayor et al., 2023).
These methods are effective in high-contrast, well-
annotated datasets but face limitations when general-
izing to new imaging modalities or less annotated do-
mains. Recent efforts have sought to reduce reliance
on full segmentation masks by incorporating weakly
supervised approaches, which use partial annotations
such as bounding boxes or point annotations. For ex-
ample, Khalid et al. (Khalid et al., 2022) introduced
a method using only bounding boxes and point an-
notations, significantly reducing annotation time and
resources. These methods offer a compromise be-
tween efficiency and accuracy but often require sub-
stantial manual input or specific pre-trained mod-
els, which can limit their adaptability. Unsupervised
tracking methods have also emerged as promising al-
ternatives, leveraging temporal patterns and unsuper-
vised learning to track cells without labeled training
data (Ma
ˇ
ska et al., 2023). While these methods re-
duce annotation effort, they struggle with accurate
segmentation, particularly in noisy or overlapping cell
scenarios. The continued development of these ap-
proaches highlights the field’s ongoing search for ef-
fective yet resource-efficient solutions to cell tracking
challenges.
2.2 Alternative Cell Identification and
Tracking Methods
While segmentation-based approaches dominate cell
tracking methodologies due to their ability to cap-
ture detailed morphological and spatial information,
some recent methods bypass segmentation entirely.
For example, Romphosri et al. (Romphosri et al.,
2024) introduced an alignment-free bacteria identifi-
cation technique using optical scattering with LEDs
and YOLO (Wang et al., 2023a), demonstrating rapid
cell identification without segmentation. Similarly,
Matthews et al. (Matthews et al., 2024) utilized
YOLO and digital holographic microscopy for real-
SAT: Segment and Track Anything for Microscopy
287

time 3D tracking of microbes, achieving effective re-
sults without requiring human labeling. However,
these methods are primarily tailored for specific tasks
like bacterial identification or microbe tracking and
may not generalize to applications requiring precise
morphology analysis or complex cell interactions.
Segmentation provides pixel-level detail, essential for
analyzing cellular morphology, quantifying interac-
tions, and supporting high-throughput studies. For
these reasons, segmentation remains a more versatile
and detailed approach in microscopy applications.
2.3 Challenges in Microscopy
Applications
Microscopy images pose unique challenges that dif-
fer significantly from natural images, making it dif-
ficult for conventional image processing and ma-
chine learning models to perform effectively (Wang
et al., 2023b). One primary challenge is the vari-
ability in imaging modalities, such as phase con-
trast, fluorescence, and differential interference con-
trast microscopy. These modalities exhibit differ-
ences in contrast, clarity, and noise levels, requiring
models to adapt dynamically to each imaging con-
dition (Stringer et al., 2020). Another major chal-
lenge is the variability in cell shapes, sizes, and mor-
phologies across different biological contexts. Mod-
els trained on specific datasets often struggle to gener-
alize to new cell types or experimental conditions, ne-
cessitating extensive retraining (Yazdi and Khotanlou,
2024). Furthermore, microscopy images are prone to
artifacts and background noise, particularly in low-
contrast environments, which can mislead segmenta-
tion and tracking algorithms. The scalability of these
models is also a critical issue. Large-scale datasets,
such as those used in high-throughput screening or
longitudinal studies, require methods that are not only
accurate but also computationally efficient. Address-
ing these challenges is vital to improving the applica-
bility and reliability of cell segmentation and tracking
methods in real-world microscopy applications.
2.4 Limitations of the Segment
Anything Model (SAM)
The Segment Anything Model (SAM) (Kirillov et al.,
2023) by MetaAI performs well on natural scenes but
struggles with microscopic images due to their com-
plexity, low contrast, and noise (Archit et al., 2023).
Domain-specific training and pre-processing are often
required to adapt SAM for microscopy tasks. Com-
pared to models like YOLO (Wang et al., 2023a),
which can also perform segmentation, SAM’s point-
based annotation scheme offers a distinct advantage
by reducing manual effort while maintaining pixel-
level precision. This efficiency makes SAM partic-
ularly suitable for large-scale and high-throughput
studies in microscopy. Based on these limitations and
strengths, the proposed work leverages SAM’s capa-
bilities while addressing its shortcomings by utilizing
point annotations in the first frame to automate seg-
mentation and tracking across all frames.
3 SAT: SEGMENT AND TRACK
ANYTHING PIPELINE
The key technical component of the proposed pipeline
is the Segment Anything Model (SAM). SAM was
pre-trained on diverse images and fine-tuned using
the LIVECell dataset for microscopy. It includes an
image encoder, prompt encoder, and mask decoder,
which work together to produce accurate segmen-
tation masks from point prompts. The SAT (Seg-
ment and Track Anything for Microscopy) pipeline
is divided into four main components: Query Points
Selection, Point Tracking, Segmentation, and Point
Tracking Reinitialization (Raji
ˇ
c et al., 2023). Below
is a detailed explanation of each module, referring to
Figure 3.
3.1 Query Points Selection
In the first step of SAT, query points are selected in the
first video frame to denote the target object (positive
points) and non-target regions (negative points). The
user can provide these points interactively or derive
them from a ground truth mask using various sam-
pling techniques, including Random Sampling, K-
Medoids Sampling, Shi-Tomasi Sampling (Shi et al.,
1994), and Mixed Sampling. Each method ensures
good coverage and robustness, significantly affecting
the model’s performance. Among the three possible
methods described, this study employs the second ap-
proach, where point annotations in the first frame are
used to initialize segmentation and tracking for sub-
sequent frames. This method was chosen due to its
balance between annotation efficiency and segmenta-
tion accuracy, making it highly suitable for large-scale
datasets and diverse microscopy conditions.
P = {p
1
, p
2
, . . . , p
n
} (1)
For K-Medoids, let C represent the set of clusters, and
P
m
be the medoid points:
P
m
= {medoid(c
i
) | c
i
∈ C} (2)
ICAART 2025 - 17th International Conference on Agents and Artificial Intelligence
288
Query
Points
Point types:
Positive
Negative
Step B
Point Tracker
Step B
Point Tracker
t=i
t=i+1
t=i+2
t=i+3
t=i+4
Step C
SAM
Step C
SAM
Step C
SAM
Step C
SAM
Step C
SAM
Step A
Query Points
Selection
Step D
Reinitialization
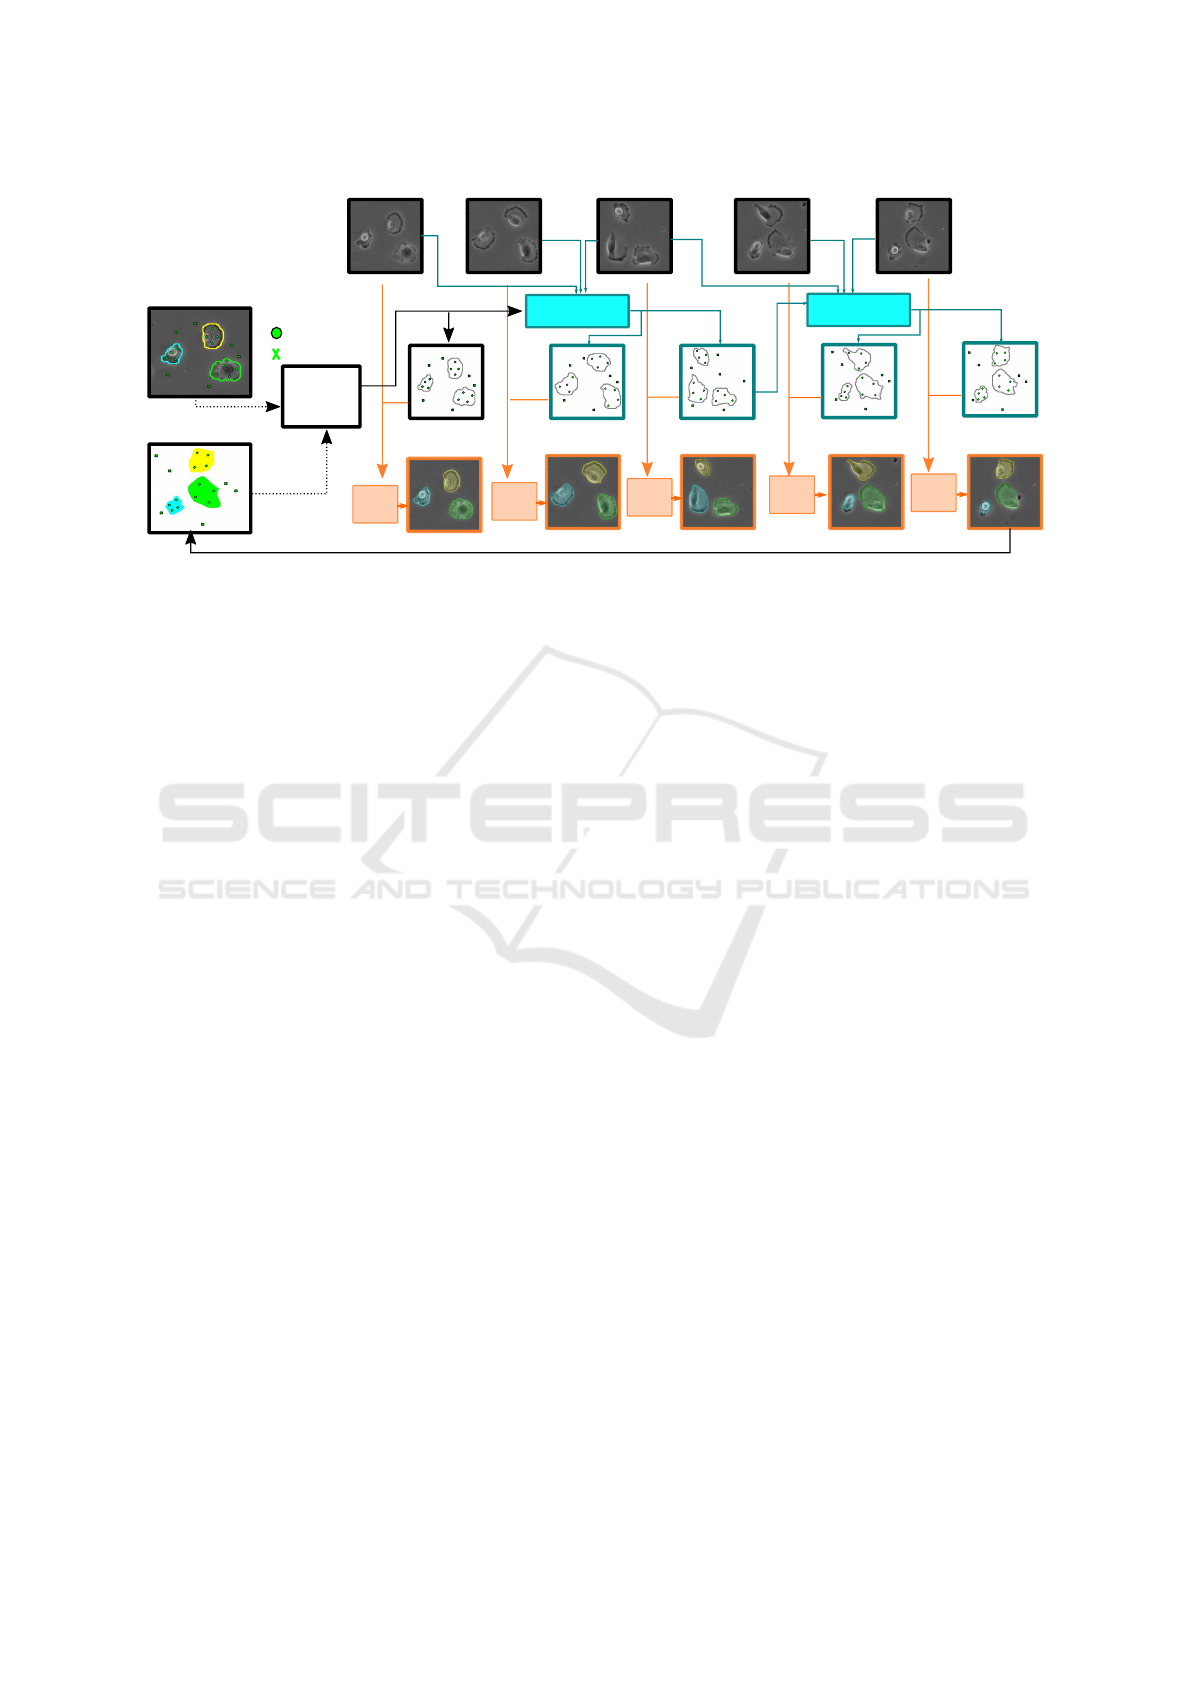
Figure 1: SAT (Segment and Track Anything for Microscopy) Pipeline. The SAT pipeline extends image segmentation models
to microscopy videos through four steps: A. Query Points Selection, where positive and negative points are defined by the
user or a ground truth mask; B. Point Tracking, which propagates points across video frames using point trackers, predicting
trajectories and occlusion scores; C. Segmentation, where the Segment Anything Model (SAM) uses these trajectories to
generate per-frame mask predictions; and D. Point Tracking Reinitialization, an optional step to reinitialize query points,
improving tracking reliability and addressing newly visible cell segments.
The objective function to minimize K-Medoids clus-
tering is:
minimize
k
∑
i=1
∑
p∈c
i
∥p − medoid(c
i
)∥ (3)
3.2 Point Tracking
This module propagates the selected query points
across all video frames using point trackers. This
propagation generates point trajectories and occlusion
scores, ensuring that the points follow the objects
throughout the video. Point tracker, PIPS (Harley
et al., 2022) is employed due to its robustness in han-
dling long-term tracking challenges such as occlusion
and reappearance of objects.
P
t
= {p
t,1
, p
t,2
, . . . , p
t,n
} (4)
The tracking function T predicts the position of points
in the next frame:
P
t+1
= T (P
t
) (5)
3.3 Segmentation
Using the point trajectories obtained from the track-
ing module, the Segment Anything Model (SAM)
(Kirillov et al., 2023), which is finetuned on the
LIVECell dataset, generates per-frame segmentation
masks. The SAM model, which comprises an image
encoder, a prompt encoder, and a mask decoder, uti-
lizes the non-occluded points as prompts to segment
the object of interest in each frame accurately.
M
t
= SAM(I
t
, P
t
) (6)
where I
t
is the input image at frame t, and P
t
is the set
of propagated points.
3.4 Point Tracking Reinitialization
This step involves reinitializing the query points pe-
riodically using the predicted masks. Reinitialization
helps to remove unreliable points and add new points
to object segments that become visible in later frames,
thereby improving the accuracy and robustness of the
segmentation over time.
P
t
= Reinitialize(M
t
) (7)
Reinitialization occurs at intervals defined by the pre-
diction horizon h:
P
t+h
= Reinitialize(M
t+h
) (8)
While SAT integrates existing modules like SAM for
segmentation and PIPS for point tracking, its novelty
lies in optimizing these components specifically for
microscopy images. By minimizing the manual effort
with point annotations in the first frame and automat-
ing the rest of the segmentation and tracking process,
SAT improves both accuracy and efficiency. Addi-
tionally, the reinitialization step enhances robustness
in tracking, and addressing occlusions and the appear-
ance of new cells over time.
SAT: Segment and Track Anything for Microscopy
289
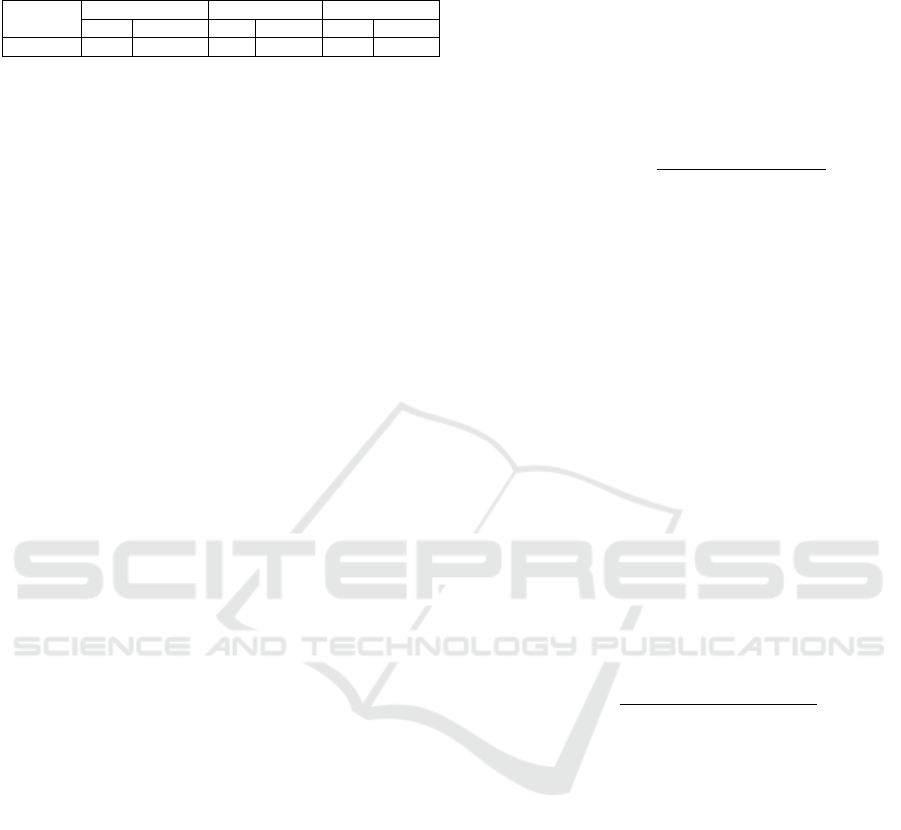
Table 2: Statistics of the LIVECell dataset used for fine-
tuning the Segment Anything Model.
Dataset
Train Val Test
Img Cells Img Cells Img Cells
LIVECell 3253 1,018,576 570 181,609 1564 462,261
4 DATASET
For fine-tuning the Segment Anything Model (SAM)
(Kirillov et al., 2023), the LIVECell dataset (Ed-
lund et al., 2021) (Table 2) was exclusively used.
LIVECell is a comprehensive dataset with label-free
live-cell images and detailed annotations, making it
ideal for refining SAM’s segmentation capabilities.
Leveraging LIVECell for fine-tuning enhances the
model’s performance and applicability to real-world
microscopy images by providing high-quality anno-
tations and diverse cell types. This approach equips
the model to handle unique challenges posed by mi-
croscopic images, such as low contrast, high noise,
various modalities, and complex cell structures.
Two datasets are used to evaluate the generalization
of the proposed methodology for cell segmentation
and tracking. The first is the Cell Tracking Chal-
lenge (CTC) dataset (Ma
ˇ
ska et al., 2023), which in-
cludes 2D and 3D time-lapse sequences of various mi-
croscopy videos, including Bright Field, Phase Con-
trast, and Differential Interference Contrast (DIC).
It contains 20 sequences, 10 of which are 2D, with
8,017 frames and an average cell density of 33.12
cells per image. The second is the Cell Tracking with
Mitosis Detection Challenge (CTMC) dataset (Anjum
and Gurari, 2020), comprising over 1.5 million im-
ages across 86 videos of 14 cell lines, annotated with
bounding boxes. Unlike CTC, CTMC does not pro-
vide segmentation masks, adding challenges for seg-
mentation. To evaluate the method across diverse con-
ditions, 4 sequences from the CTC dataset and 6 from
the CTMC dataset were randomly selected, represent-
ing various imaging modalities, cell types, and cap-
ture intervals to robustly test the method’s generaliza-
tion.
5 EVALUATION METRICS
To assess the performance of the proposed pipeline
for cell tracking, five distinct evaluation metrics are
used, each providing a unique perspective on the re-
sults. These metrics collectively evaluate the accu-
racy, reliability, and robustness of the tracker across
diverse scenarios, ensuring a comprehensive assess-
ment of its capabilities.
5.1 Multiple Object Tracking Accuracy
Multiple Object Tracking Accuracy (MOTA)
(Bernardin and Stiefelhagen, 2008) measures the
overall accuracy of the tracker and the detection.
It accounts for errors such as missed detections,
false positives, and identity mismatches, providing a
holistic view of the tracker’s performance.
MOTA = 1 −
∑
t
(m
t
+ f p
t
+ mme
t
)
∑
t
g
t
Here, m
t
represents the total number of misses, f p
t
the total number of false positives, and mme
t
the to-
tal number of mismatches. Misses occur when a cell
in the ground truth is not detected, which may re-
sult from occlusion, low contrast, or noise in the im-
age. False positives occur when a cell is detected but
not present in the ground truth, often due to over-
segmentation or artifacts. Mismatches occur when a
cell is incorrectly associated with another cell, typ-
ically due to overlapping trajectories or inconsisten-
cies in tracking. MOTA provides a single metric to
summarize the errors, making it a standard bench-
mark in multi-object tracking evaluations.
5.2 Identification F1 Score
Identification F1 (IDF1) (Ristani et al., 2016) calcu-
lates a one-to-one mapping between ground truth tra-
jectories and prediction trajectories, emphasizing the
importance of maintaining consistent identities.
IDF1 =
2 · IDTP
2 · IDTP + IDFP + IDFN
IDTP (Identity True Positives) represents the num-
ber of correctly matched IDs between ground truth
and predictions. IDFP (Identity False Positives) de-
notes instances where a predicted ID does not cor-
respond to any ground truth object. IDFN (Identity
False Negatives) occurs when a ground truth ID is not
matched to any prediction. IDF1 is particularly useful
for evaluating the consistency of identity preservation
in challenging scenarios, such as densely packed cells
or overlapping trajectories.
5.3 Identity Switches
Identity Switches (IDs) (Bernardin and Stiefelhagen,
2008), also known as Mismatches, refer to the num-
ber of times a trajectory incorrectly changes from one
ground truth object to another. This error is often
caused by abrupt changes in cell appearance, over-
lapping trajectories, or tracking errors during occlu-
sion. A lower number of identity switches indicates
ICAART 2025 - 17th International Conference on Agents and Artificial Intelligence
290

a more reliable tracking system, as it suggests the
tracker effectively maintains the continuity of object
identities across frames. This metric is critical for
applications requiring lineage analysis or long-term
tracking, where maintaining identity is paramount.
5.4 Mostly Tracked
If an object is successfully tracked for at least 80%
of its lifespan, it is considered Mostly Tracked (MT)
(Leal-Taix
´
e et al., 2015). This metric evaluates the
robustness of a tracking algorithm in maintaining the
continuity of an object’s identity across its lifespan.
High MT scores indicate that the tracker is capable of
handling long-term trajectories without frequent in-
terruptions, even in the presence of challenges such
as partial occlusions or variations in cell morphology.
This metric is particularly important in applications
requiring sustained observation of cellular behavior
over time, such as studying cell migration or division.
5.5 Mostly Lost
If an object is tracked for 20% or less of its lifes-
pan, it is considered Mostly Lost (ML) (Leal-Taix
´
e
et al., 2015). High ML scores suggest the tracker
struggles with challenges, leading to frequent identity
losses. This metric highlights cases where the track-
ing algorithm fails to maintain object identities due to
factors like occlusion, abrupt motion, or low-contrast
regions. By identifying objects that are mostly lost,
this metric helps pinpoint specific limitations of the
tracker and provides insights for improving its per-
formance in challenging scenarios. A low ML score
indicates that the tracker is robust enough to avoid sig-
nificant failures across the dataset.
6 EXPERIMENTAL SETUP
Two different experimental settings are designed to
evaluate the performance of the proposed pipeline for
cell tracking from various aspects. The first setting,
namely SAT Evaluation on Diverse Modalities and
Intervals Using the CTC Dataset, assesses the per-
formance of the SAT pipeline across various imag-
ing modalities and time intervals. This setting uti-
lizes annotated 2D sequences from the Cell Track-
ing Challenge (CTC) dataset, which includes diverse
imaging modalities such as Bright Field, Phase Con-
trast, and Differential Interference Contrast (DIC).
These modalities present unique challenges due to
variations in contrast, cell morphology, and imag-
ing noise, providing a comprehensive evaluation of
the SAT pipeline’s effectiveness in handling diverse
cell tracking scenarios. By covering a wide range of
imaging conditions and temporal intervals, this set-
ting highlights the pipeline’s adaptability and robust-
ness in practical applications. The second experi-
mental setting, namely SAT Generalization Analysis
Using CTMC’s Wide-Ranging Cell Types, evaluates
the SAT pipeline’s ability to generalize across diverse
cell lines and extensive imaging conditions. The Cell
Tracking with Mitosis Detection Challenge (CTMC)
dataset presents a distinct set of challenges due to its
inclusion of multiple cell lines, varying densities, and
complex phase-contrast imaging conditions. This set-
ting emphasizes the pipeline’s capacity to handle cell
tracking in scenarios with high cell densities, overlap-
ping cells, and intricate motion patterns, making it an
ideal benchmark for assessing generalizability across
heterogeneous datasets.
To fine-tune the Segment Anything Model (SAM)
(Kirillov et al., 2023) on LIVECell data, an iterative
training scheme was employed (Archit et al., 2023).
Minibatches of input images and ground-truth seg-
mentations were sampled with annotations using ran-
dom positive points or bounding boxes to ensure a
balanced representation of the dataset’s variability.
Key hyperparameters included a batch size of two,
dice loss for masks to optimize segmentation qual-
ity, L2 loss for IOU to refine boundary predictions,
and the ADAM optimizer (Kingma and Ba, 2014)
with a learning rate of 10
−5
. The learning rate was
dynamically adjusted using the ReduceLROnPlateau
scheduler to ensure stable convergence during train-
ing. Models were trained for 100,000 iterations, with
partial updates for 25,000 and fine-tuning for an addi-
tional 10,000 iterations, allowing the pipeline to cap-
ture intricate features of live-cell images effectively.
The training process was conducted on an A100
GPU with 80 GB of VRAM, enabling efficient com-
putation for high-resolution microscopy images. The
Vision Transformer (ViT-h) (Dosovitskiy et al., 2020)
was employed as the backbone for image segmenta-
tion. The implementation utilized PyTorch (Paszke
et al., 2019) along with the torch-em library (Pape,
2023), which provided specialized tools for semantic
and instance segmentation tasks in bioimaging.
6.1 Experimental Setting 1: SAT
Evaluation on Diverse Modalities
and Intervals Using the CTC
Dataset
In this experimental setting, the performance of the
SAT pipeline is assessed across various imaging
SAT: Segment and Track Anything for Microscopy
291
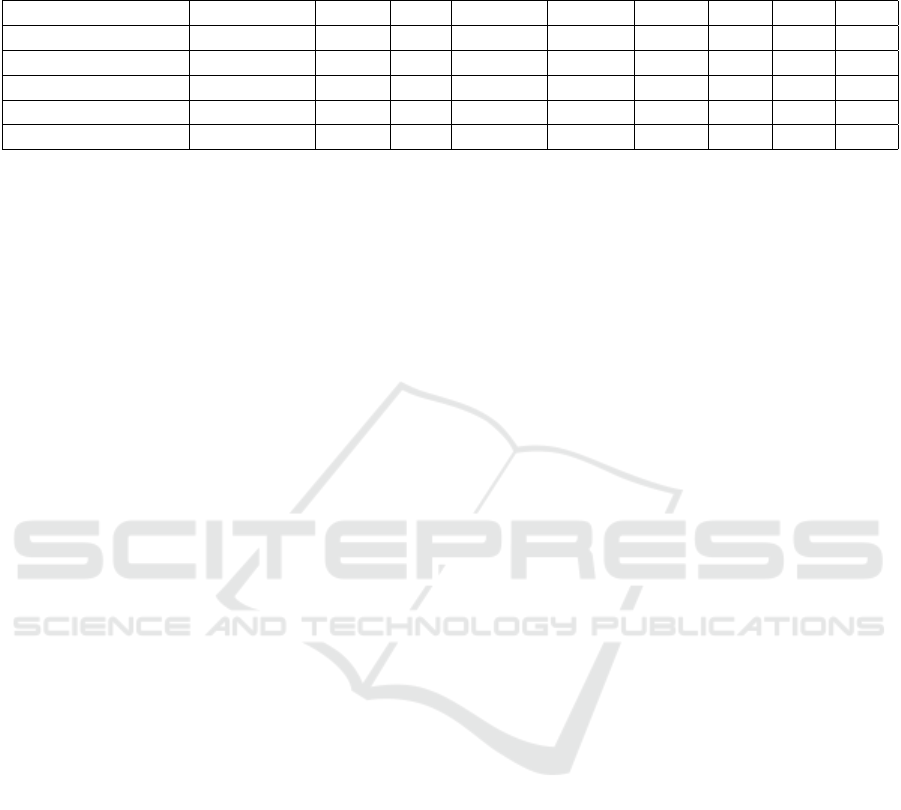
Table 3: Results for the SAT Evaluation on Diverse Modalities and Intervals Using the CTC Dataset. Higher values are better
for MOTA, IDF1, and MT, indicated by upward arrows (↑). Lower values are better for IDS and ML, indicated by downward
arrows (↓).
Sequence Modality Images Cells Points (N) MOTA ↑ IDF1 ↑ IDS ↓ MT ↑ ML ↓
PhC-C2DH-U373 (01) Phase Contrast 61 427 6P - 3N 79.82 89.00 0.0 71.43 0.0
PhC-C2DH-U373 (02) Phase Contrast 12 58 6P - 3N 82.75 91.94 0.0 100.0 0.0
Fluo-N2DH-GOWT1 Fluorescence 38 799 3P - 3N 88.24 91.20 0.0 79.17 8.34
Fluo-N2DH-SIM+ Fluorescence 10 271 3P - 3N 83.03 88.73 0.0 83.34 0.0
Average/Total - 121 1,555 - 83.46 90.22 0.0 83.45 2.08
modalities and time intervals using the Cell Track-
ing Challenge (CTC) dataset. The CTC dataset in-
cludes annotated 2D and 3D time-lapse video se-
quences of fluorescent counterstained nuclei, as well
as 2D Bright Field, Phase Contrast, and Differential
Interference Contrast (DIC) microscopy videos. This
diverse dataset serves as a benchmark for evaluating
the SAT pipeline’s ability to generalize across differ-
ent imaging conditions, cell types, and temporal res-
olutions, providing a comprehensive evaluation of its
effectiveness in diverse cell-tracking scenarios. The
table 3 shows the results for this setting, offering de-
tailed metrics for each sequence. The sequences eval-
uated include:
• PhC-C2DH-U373 (01). This sequence contains
61 frames and is a Phase Contrast microscopy
video of U373 cells, captured at 10-minute in-
tervals. MOTA is 79.82%, indicating high track-
ing accuracy despite the challenges of low con-
trast typical of Phase Contrast imaging. IDF1
is 89.00%, reflecting excellent identity preserva-
tion, with no identity switches (IDS 0.0), show-
casing the reliability of the SAT pipeline in main-
taining object identities. MT is 71.43%, indicat-
ing most cells are successfully tracked throughout
their lifespans, and ML is 0.0%, meaning no cells
were lost during tracking.
• PhC-C2DH-U373 (02) This sequence contains
12 frames and is a Phase Contrast microscopy
video of U373 cells, captured at 10-minute inter-
vals. MOTA is 82.75%, showing improved track-
ing accuracy over the previous sequence. IDF1
is 91.94%, indicating superior identity preserva-
tion with no identity switches (IDS 0.0). MT is
100.0%, reflecting perfect tracking of all cells,
and ML remains at 0.0%, demonstrating the ro-
bustness of the pipeline for short time-lapse se-
quences with challenging imaging conditions.
• Fluo-N2DH-GOWT1. This sequence contains
38 frames and is a fluorescence microscopy video
of GOWT1 cells, captured at 30-minute intervals.
MOTA is 88.24%, demonstrating very high track-
ing accuracy, leveraging the high contrast pro-
vided by fluorescence imaging. IDF1 is 91.20%,
indicating excellent identity preservation, with no
identity switches (IDS 0.0). MT is 79.17%, show-
ing that the majority of trajectories were well
tracked, while ML is 8.34%, indicating a small
number of trajectories were lost, potentially due
to occlusions or overlapping cells.
• Fluo-N2DH-SIM+. This sequence contains 10
frames and is a fluorescence microscopy video
of SIM+ cells, captured at 30-minute intervals.
MOTA is 83.03%, showing high accuracy in
tracking. IDF1 is 88.73%, reflecting strong iden-
tity preservation, with no identity switches (IDS
0.0). MT is 83.34%, demonstrating that most cells
were successfully tracked for the majority of their
lifespans, and ML remains at 0.0%, showcasing
the pipeline’s ability to handle challenging imag-
ing conditions effectively.
Overall, the average metrics across sequences are
MOTA of 83.46, IDF1 of 90.22, IDS of 0.0, MT of
83.45%, and ML of 2.08%, demonstrating high track-
ing accuracy, excellent identity preservation, no iden-
tity switches, and effective tracking of most trajec-
tories. These results highlight the robustness of the
SAT pipeline in handling diverse imaging modalities
and scenarios, from Phase Contrast microscopy with
low contrast to Fluorescence microscopy with high
contrast. Additionally, the lack of identity switches
and the high percentage of mostly tracked trajectories
across sequences underline the reliability of the SAT
pipeline in maintaining object consistency over time.
The pipeline’s ability to perform consistently across
sequences of varying lengths, frame intervals, and cell
densities further illustrates its adaptability and effec-
tiveness in diverse experimental setups. These find-
ings establish SAT as a versatile and scalable solution
for automated cell tracking in biomedical research,
paving the way for its application in more complex
and high-throughput studies.
ICAART 2025 - 17th International Conference on Agents and Artificial Intelligence
292

6.2 Experimental Setting 2: SAT
Generalization Analysis Using
CTMC’s Wide-Ranging Cell Types
In this experimental setting, the performance of the
SAT pipeline is evaluated using the diverse cell
lines and extensive imaging conditions provided by
the Cell Tracking with Mitosis Detection Challenge
(CTMC) dataset. This dataset is particularly challeng-
ing due to its inclusion of multiple cell types, varying
imaging conditions, and high cell densities, making it
an excellent testbed for assessing the generalizability
and robustness of cell-tracking algorithms. The table
4 shows the results for this setting, highlighting the
SAT pipeline’s performance across a wide range of
scenarios. The sequences evaluated include:
• PL1Ut-run05. This sequence contains 371
frames and comprises phase-contrast images of
PL1Ut cells, a rat hepatoma cell line. With a
MOTA of 93.12% and IDF1 of 96.56%, the SAT
pipeline demonstrates exceptional tracking accu-
racy and identity preservation. The lack of iden-
tity switches (IDS 0.0%) and the high MT score
of 100.0% indicate that all cells were tracked suc-
cessfully throughout their lifespans, with no tra-
jectories being lost (ML 0.0%).
• A-10-run01. This sequence consists of 305
frames of phase-contrast images of A-10 cells, a
rat smooth muscle cell line. The SAT pipeline
achieves a MOTA of 80.79% and IDF1 of 90.03%,
reflecting robust tracking performance. Despite
the high cell density, no identity switches (IDS
0.0) occurred, and 80.0% of the trajectories were
well tracked (MT), with no significant losses (ML
0.0%).
• LLC-MK2-run03. This sequence includes 89
frames of phase-contrast images of LLC-MK2
cells, a monkey kidney epithelial cell line. The
SAT pipeline achieves near-perfect tracking re-
sults, with a MOTA of 96.18% and IDF1 of
98.08%. No identity switches (IDS 0.0) were
observed, and all cells were successfully tracked
(MT 100.0%) without loss (ML 0.0%).
• APM-run05. This sequence consists of 130
frames of phase-contrast images of APM cells,
a human peripheral blood mononuclear cell line.
The MOTA of 61.85% and IDF1 of 82.38% re-
flect satisfactory performance despite the inher-
ent challenges of tracking these cells, including
smaller size and irregular movement. All trajec-
tories were tracked successfully for most of their
lifespan (MT 75.0%), and no identity switches oc-
curred (IDS 0.0).
• U2O-S-run03. This sequence includes 100
frames of phase-contrast images of U2O-S cells,
a human osteosarcoma cell line. With a MOTA
of 68.93% and IDF1 of 84.17%, the SAT pipeline
performs well in maintaining identity consistency
across frames. Most cells were successfully
tracked (MT 75.0%) with no significant trajectory
loss (ML 0.0%) or identity switches (IDS 0.0).
• OK-run01. This sequence comprises 57 frames
of phase-contrast images of OK cells, an opos-
sum kidney epithelial cell line. The SAT pipeline
achieves a MOTA of 57.77% and IDF1 of 78.11%.
While the tracking performance is relatively lower
compared to other sequences, likely due to over-
lapping cells or occlusions, the majority of tra-
jectories were successfully tracked (MT 60.0%),
with minimal loss (ML 6.67%) and no identity
switches (IDS 0.0).
Overall, the average metrics across sequences are
MOTA of 76.44%, IDF1 of 88.22%, IDS of 0.0%,
MT of 81.67%, and ML of 1.12%, demonstrating
good tracking accuracy, excellent identity preserva-
tion, and no identity switches. The high MT scores
across sequences show that the SAT pipeline suc-
cessfully tracks the majority of trajectories, while
the low ML values indicate minimal trajectory loss,
even in challenging scenarios. These results highlight
the robustness and adaptability of the SAT pipeline,
which excels in handling diverse imaging conditions,
cell types, and densities. By consistently achiev-
ing high tracking performance without requiring ad-
ditional fine-tuning, the SAT pipeline establishes it-
self as a reliable tool for automated cell tracking in
complex and high-throughput experimental setups.
Its ability to generalize effectively across different
datasets further underscores its potential for broad ap-
plications in biomedical research.
7 ANALYSIS AND DISCUSSION
This section explains the results of the two experi-
mental settings, highlighting the SAT pipeline’s abil-
ity to generalize across different modalities and cell
lines. In the first setting, SAT Evaluation on Diverse
Modalities and Intervals Using the CTC Dataset,
the pipeline was tested on the Cell Tracking Chal-
lenge (CTC) dataset, which includes diverse imaging
modalities. Table 3 shows the SAT pipeline achieves
83.46% MOTA, 90.22% IDF1, and zero Identity
Switches (IDS), demonstrating consistent tracking
across modalities. In the second setting, SAT Gen-
eralization Analysis Using CTMC’s Wide-Ranging
Cell Types, the pipeline was evaluated using the Cell
SAT: Segment and Track Anything for Microscopy
293
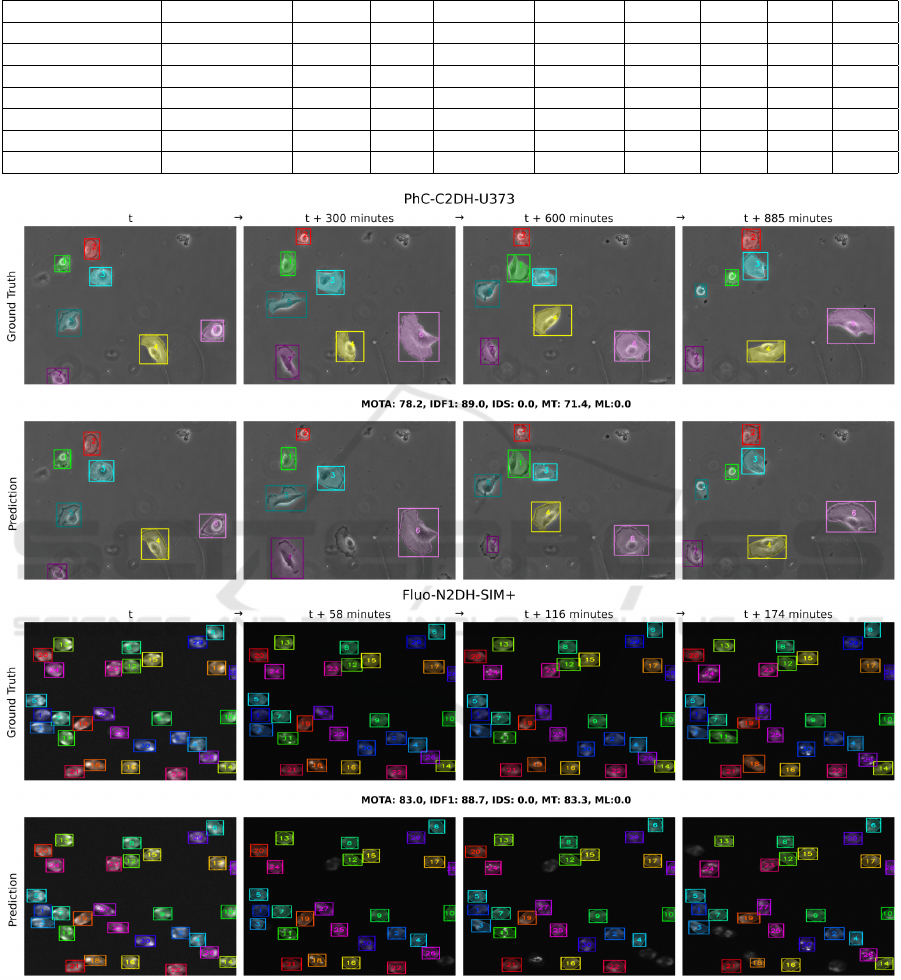
Table 4: Results for the SAT Generalization Analysis Using CTMC’s Wide-Ranging Cell Types. Higher values are better for
MOTA, IDF1, and MT, indicated by upward arrows (↑). Lower values are better for IDS and ML, indicated by downward
arrows (↓).
Sequence Modality Images Cells Points (N) MOTA ↑ IDF1 ↑ IDS ↓ MT ↑ ML ↓
PL1Ut-run05 Phase Contrast 371 742 30P - 3N 93.12 96.56 0.0 100.0 0.0
A-10-run01 Phase Contrast 305 1,525 20P - 3N 80.79 90.03 0.0 80.00 0.0
LLC-MK2-run03 Phase Contrast 89 445 25P - 3N 96.18 98.08 0.0 100.0 0.0
APM-run05 Phase Contrast 130 443 25P - 3N 61.85 82.38 0.0 75.00 0.0
U2O-S-run03 Phase Contrast 100 396 15P - 3N 68.93 84.17 0.0 75.00 0.0
OK-run01 Phase Contrast 57 841 30P - 3N 57.77 78.11 0.0 60.00 6.67
Average/Total - 1,173 5,447 - 76.44 88.22 0.0 81.67 1.12
Figure 2: Tracking results for experimental setting 1 with two sequences, PhC-C2DH-U373 and Fluo-N2DH-SIM+. The top
row shows ground truth, and the bottom row shows SAT pipeline predictions with evaluation scores above the prediction row.
Tracking with Mitosis Detection Challenge (CTMC)
dataset, featuring diverse cell lines and extensive
imaging conditions. The results, shown in Table 4,
reveal that the SAT pipeline maintains good tracking
accuracy with an average MOTA of 76.44% and an
IDF1 of 88.22%, indicating effective generalization
to different cell types and high identity preservation.
The variation in MOTA across different cell types can
be attributed to the challenges presented by different
imaging modalities and cell cultures. For instance, the
ICAART 2025 - 17th International Conference on Agents and Artificial Intelligence
294
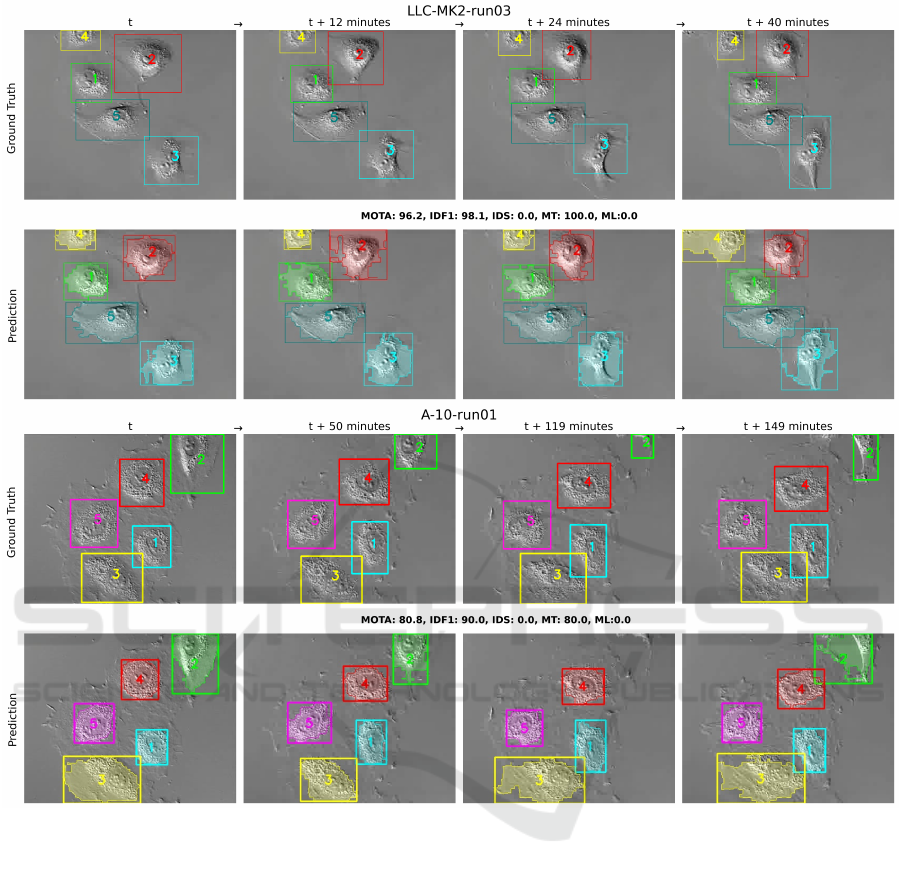
Figure 3: Tracking results for experimental setting 2 with two sequences, LLC-MK2-run03 and A-10-run01. The top row
shows ground truth, and the bottom row shows SAT pipeline predictions with evaluation scores above the prediction row.
PhC-C2DH-U373 cell culture, imaged with phase-
contrast microscopy, poses difficulties due to low con-
trast, causing cells to merge with the background as
they grow. In contrast, the Fluo-N2DH-GOWT1 cul-
ture, captured with fluorescence microscopy, offers
higher contrast, making segmentation and tracking
significantly easier. These factors contribute to the
variation in MOTA and are reflected in the observed
performance across different datasets.
Figure 2 illustrates tracking results for the first
setting with sequences PhC-C2DH-U373 and Fluo-
N2DH-SIM+. The top row shows the ground truth,
while the bottom row shows the SAT pipeline predic-
tions. For PhC-C2DH-U373, all 7 cells are correctly
segmented initially, with one cell missed at t + 300
minutes but recovered at t + 600 minutes and tracked
till the last frame at t + 885 minutes. The SAT pipeline
achieves a MOTA of 78.2%, IDF1 of 89.0%, 0 IDS,
71.4% MT, and 0.0% ML. For Fluo-N2DH-SIM+, all
cells are correctly segmented initially, with one cell
missed at t + 58 minutes and another at t + 116 min-
utes, both recovered at t + 174 minutes. The pipeline
achieves a MOTA of 83.0%, IDF1 of 88.7%, 0 IDS,
83.3% MT, and 0.0% ML.
Figure 3 shows tracking results for the second
setting with sequences LLC-MK2-run03 and A-10-
run01. The top row shows ground truth bounding
boxes, while the bottom row shows SAT pipeline pre-
dictions with both bounding boxes and segmentation
masks. For LLC-MK2-run03, all cells are correctly
segmented across all frames, achieving a MOTA of
96.2%, IDF1 of 98.1%, 0 IDS, 100.0% MT, and 0.0%
SAT: Segment and Track Anything for Microscopy
295

ML. For A-10-run01, all cells are correctly segmented
initially, with cell number 2 missed at t + 119 min-
utes but recovered at t + 149 minutes. The pipeline
achieves a MOTA of 80.8%, IDF1 of 90.0%, 0 IDS,
80.0% MT, and 0.0% ML.
While direct comparison with other tracking
methods is not entirely feasible due to the unique na-
ture of the proposed approach, an additional exper-
iment with ByteTrack was conducted to offer some
insights. ByteTrack, trained on the same LIVECell
dataset as SAT, failed to detect any cells when applied
to the CTMC dataset. To investigate further, Byte-
Track was trained on a subset of the CTMC dataset
(with no overlap with the test set) and tested on the
remaining sequences. ByteTrack’s performance was
lower than SAT, with an average MOTA of 29.3 com-
pared to 76.4, and higher IDS and ML scores. These
findings emphasize the superior adaptability and ro-
bustness of SAT, which can generalize effectively to
unseen datasets without retraining, a limitation ob-
served in traditional methods like ByteTrack (Zhang
et al., 2022).
Overall, the proposed SAT pipeline demonstrates
strong generalization across different modalities and
cell lines, achieving high tracking accuracy and iden-
tity preservation. This pipeline significantly impacts
the biological and biomedical research community by
automating cell segmentation and tracking, reducing
the need for expert knowledge and manual interven-
tion. It enhances accuracy, consistency, and speeds
up data annotation, benefiting cancer research, drug
development, and stem cell studies. SAT’s broad ap-
plicability with minimal retraining makes it a versa-
tile tool, driving new insights and improving research
efficiency. By reducing the time and effort required
for annotation, SAT enables researchers to focus on
complex experimental designs and large-scale analy-
ses. Moreover, its ability to adapt to diverse imag-
ing conditions ensures reproducibility and scalability
in longitudinal studies. The adoption of SAT could
also bridge gaps in resource-limited settings, democ-
ratizing access to advanced cell tracking technolo-
gies. This efficiency and accessibility position SAT
as a valuable asset for advancing both fundamental
research and clinical applications.
8 CONCLUSION
This study introduces the SAT pipeline for Cell Seg-
mentation and Tracking, which uses point annotations
only in the first frame to automate segmentation and
tracking across sequences. The pipeline demonstrates
strong generalization and robustness across diverse
imaging modalities and cell types, achieving over
80% Multiple Object Tracking Accuracy (MOTA) on
two diverse datasets. By significantly reducing anno-
tation time—up to 206x faster than traditional meth-
ods—SAT enables efficient and scalable cell tracking,
even in challenging conditions such as noisy, low-
contrast microscopy images. This automation stream-
lines large-scale studies in cancer research, drug de-
velopment, and stem cell analysis, while improving
accuracy and reducing expert intervention. The versa-
tility, adaptability, and scalability of the SAT pipeline
make it a robust solution for modern biomedical re-
search, facilitating deeper insights into cellular behav-
ior and accelerating scientific discoveries with clini-
cal applications. In the future, this study can be ex-
tended to track cell division, enabling analysis of cell
cycle progression, mitotic events, and lineage forma-
tion over time, providing valuable insights into cel-
lular proliferation and division dynamics, particularly
for studying developmental biology, stem cell differ-
entiation, and cancer progression.
ACKNOWLEDGMENT
This work was supported by SAIL (Sartorius Artifi-
cial Intelligence Lab) project. We thank all members
of the Deep Learning Competence Center at the DFKI
for their comments and support.
REFERENCES
Anjum, S. and Gurari, D. (2020). Ctmc: Cell tracking with
mitosis detection dataset challenge. In Proceedings
of the IEEE/CVF Conference on Computer Vision and
Pattern Recognition Workshops, pages 982–983.
Aramini, B., Masciale, V., Grisendi, G., Bertolini, F., Maur,
M., Guaitoli, G., Chrystel, I., Morandi, U., Stella, F.,
Dominici, M., et al. (2022). Dissecting tumor growth:
the role of cancer stem cells in drug resistance and
recurrence. Cancers.
Archit, A., Nair, S., Khalid, N., Hilt, P., Rajashekar, V., Fre-
itag, M., Gupta, S., Dengel, A., Ahmed, S., and Pape,
C. (2023). Segment anything for microscopy. bioRxiv,
pages 2023–08.
Bernardin, K. and Stiefelhagen, R. (2008). Evaluating mul-
tiple object tracking performance: the clear mot met-
rics. EURASIP Journal on Image and Video Process-
ing.
Chou, T.-C., You, L., Beerens, C., Feller, K. J., Storteboom,
J., and Chien, M.-P. (2023). Instant processing of
large-scale image data with fact, a real-time cell seg-
mentation and tracking algorithm. Cell Reports Meth-
ods, 3(11).
ICAART 2025 - 17th International Conference on Agents and Artificial Intelligence
296

Dosovitskiy, A., Beyer, L., Kolesnikov, A., Weissenborn,
D., Zhai, X., Unterthiner, T., Dehghani, M., Minderer,
M., Heigold, G., Gelly, S., et al. (2020). An image is
worth 16x16 words: Transformers for image recogni-
tion at scale. arXiv preprint arXiv:2010.11929.
Durkee, M. S., Abraham, R., Clark, M. R., and Giger, M. L.
(2021). Artificial intelligence and cellular segmenta-
tion in tissue microscopy images. The American jour-
nal of pathology, 191(10):1693–1701.
Edlund, C., Jackson, T. R., Khalid, N., Bevan, N., Dale,
T., Dengel, A., Ahmed, S., Trygg, J., and Sj
¨
ogren, R.
(2021). Livecell—a large-scale dataset for label-free
live cell segmentation. Nature methods, 18(9):1038–
1045.
Harley, A. W., Fang, Z., and Fragkiadaki, K. (2022). Parti-
cle video revisited: Tracking through occlusions using
point trajectories. In European Conference on Com-
puter Vision. Springer.
Jelli, E., Ohmura, T., Netter, N., Abt, M., Jim
´
enez-Siebert,
E., Neuhaus, K., Rode, D. K., Nadell, C. D., and
Drescher, K. (2023). Single-cell segmentation in
bacterial biofilms with an optimized deep learning
method enables tracking of cell lineages and mea-
surements of growth rates. Molecular Microbiology,
119(6):659–676.
Khalid, N., Froes, T. C., Caroprese, M., Lovell, G., Trygg,
J., Dengel, A., and Ahmed, S. (2023). Pace: Point
annotation-based cell segmentation for efficient mi-
croscopic image analysis. In International Conference
on Artificial Neural Networks. Springer.
Khalid, N., Schmeisser, F., Koochali, M., Munir, M., Ed-
lund, C., Jackson, T. R., Trygg, J., Sj
¨
ogren, R., Den-
gel, A., and Ahmed, S. (2022). Point2mask: a
weakly supervised approach for cell segmentation us-
ing point annotation. In Annual Conference on Med-
ical Image Understanding and Analysis, pages 139–
153. Springer.
Kingma, D. P. and Ba, J. (2014). Adam: A
method for stochastic optimization. arXiv preprint
arXiv:1412.6980.
Kirillov, A., Mintun, E., Ravi, N., Mao, H., Rolland, C.,
Gustafson, L., Xiao, T., Whitehead, S., Berg, A. C.,
Lo, W.-Y., et al. (2023). Segment anything. In Pro-
ceedings of the IEEE/CVF International Conference
on Computer Vision.
Leal-Taix
´
e, L., Milan, A., Reid, I., Roth, S., and Schindler,
K. (2015). Motchallenge 2015: Towards a bench-
mark for multi-target tracking. arXiv preprint
arXiv:1504.01942.
Malin-Mayor, C., Hirsch, P., Guignard, L., McDole, K.,
Wan, Y., Lemon, W. C., Kainmueller, D., Keller, P. J.,
Preibisch, S., and Funke, J. (2023). Automated recon-
struction of whole-embryo cell lineages by learning
from sparse annotations. Nature biotechnology.
Ma
ˇ
ska, M., Ulman, V., Delgado-Rodriguez, P., G
´
omez-de
Mariscal, E., Ne
ˇ
casov
´
a, T., Guerrero Pe
˜
na, F. A., Ren,
T. I., Meyerowitz, E. M., Scherr, T., L
¨
offler, K., et al.
(2023). The cell tracking challenge: 10 years of ob-
jective benchmarking. Nature Methods, 20(7):1010–
1020.
Matthews, S. A., Coelho, C., Rodriguez Salas, E. E., Brock,
E. E., Hodge, V. J., Walker, J. A., and Wilson, L. G.
(2024). Real-time 3d tracking of swimming microbes
using digital holographic microscopy and deep learn-
ing. Plos one, 19(4):e0301182.
Newman, R. H., Fosbrink, M. D., and Zhang, J. (2011). Ge-
netically encodable fluorescent biosensors for track-
ing signaling dynamics in living cells. Chemical re-
views, 111(5):3614–3666.
Padovani, F., Mairh
¨
ormann, B., Falter-Braun, P., Lengefeld,
J., and Schmoller, K. M. (2022). Segmentation, track-
ing and cell cycle analysis of live-cell imaging data
with cell-acdc. BMC biology.
Pape, C. (2023). torch-em: Deep learning based semantic
and instance segmentation for 3d electron microscopy
and other bioimage analysis problems based on py-
torch.
Paszke, A., Gross, S., Massa, F., Lerer, A., Bradbury, J.,
Chanan, G., Killeen, T., Lin, Z., Gimelshein, N.,
Antiga, L., et al. (2019). Pytorch: An imperative style,
high-performance deep learning library. In Advances
in neural information processing systems.
Raji
ˇ
c, F., Ke, L., Tai, Y.-W., Tang, C.-K., Danelljan, M., and
Yu, F. (2023). Segment anything meets point tracking.
arXiv preprint arXiv:2307.01197.
Ristani, E., Solera, F., Zou, R., Cucchiara, R., and Tomasi,
C. (2016). Performance measures and a data set for
multi-target, multi-camera tracking. In European con-
ference on computer vision. Springer.
Romphosri, S., Pissuwan, D., Wattanavichean, N.,
Buabthong, P., and Waritanant, T. (2024). Rapid
alignment-free bacteria identification via optical scat-
tering with leds and yolov8. Scientific Reports,
14(1):20498.
Shi, J. et al. (1994). Tomasi. good features to track. In 1994
Proceedings of IEEE conference on computer vision
and pattern recognition. sn.
Stringer, C., Wang, T., Michaelos, M., and Pachitariu, M.
(2020). Cellpose: a generalist algorithm for cellular
segmentation. Nature Methods.
Wang, C.-Y., Bochkovskiy, A., and Liao, H.-Y. M. (2023a).
Yolov7: Trainable bag-of-freebies sets new state-of-
the-art for real-time object detectors. In Proceedings
of the IEEE/CVF conference on computer vision and
pattern recognition, pages 7464–7475.
Wang, R., Butt, D., Cross, S., Verkade, P., and Achim, A.
(2023b). Bright-field to fluorescence microscopy im-
age translation for cell nuclei health quantification. Bi-
ological Imaging, 3:e12.
Yazdi, R. and Khotanlou, H. (2024). A survey on automated
cell tracking: challenges and solutions. Multimedia
Tools and Applications.
Zhang, Y., Sun, P., Jiang, Y., Yu, D., Weng, F., Yuan, Z.,
Luo, P., Liu, W., and Wang, X. (2022). Bytetrack:
Multi-object tracking by associating every detection
box. In European conference on computer vision.
Springer.
SAT: Segment and Track Anything for Microscopy
297
