
Modeling for Assessment of Risks in Smart City Mobility Operations
Reem Al Sharif
a
and Shaligram Pokharel
b
Department of Mechanical and Industrial Engineering, Qatar University, Doha, Qatar
Keywords: Smart City, Operation Phase Risks, Smart Mobility, Smart Transportation Applications,
Risk Assessment Models.
Abstract: Smart city operations face risks due to project complexity and the involvement of multiple stakeholders. Such
risks include cybersecurity, data security and privacy, system interoperability, maintenance of smart
technology, shortage of trained experts, complicated governance, and stakeholder engagement challenges.
Assessing these risks is vital to ensure the availability and efficiency of smart city services, support reputation,
and sustain revenue. Existing assessment tools evaluate smart cities' operational smartness, sustainability, and
management but often lack comprehensiveness in risk assessment. This paper contributes by proposing a risk
assessment model using the Dempster-Shafer theory that can consider a full spectrum of risks in smart city
operations. The model is evaluated on preliminary operational data from a smart transportation system in
Qatar, and key operational phase risks in smart mobility are assessed.
1 INTRODUCTION
A smart city aims to enhance citizens' quality of life,
support the economy, resolve various urban
problems, such as transportation and traffic
congestion, foster a sustainable environment, and
facilitate interaction with government authorities
(Ismagilova et al., 2019; Sharif & Pokharel, 2021)
To achieve these goals, proper communication,
involvement, and active contribution from smart city
stakeholders are crucial (Hasija et al., 2020).
Accordingly, smart city operation requires constant
stakeholder communication to gather and access smart
city's citizens' usage of services, which will support
demand estimation, enhance provided services, and
identify implementation challenges and risks.
Also, during operation, interoperability between
digital platforms, operation processes, and incentive
mechanisms is considered (Hasija et al., 2020).
Smart city operation is exposed to different risks
due to the complexity of the smart city project and the
multiple engaged stakeholders (Sharif & Pokharel,
2021).
The risks can be grouped into technological risks,
such as cybersecurity, data security and privacy,
system interoperability, and lack of maintenance of
a
https://orcid.org/0000-0001-7565-1527
b
https://orcid.org/0000-0002-7709-7803
smart technology (Shayan et al., 2020)., and non-
technology risks such as scarce trained and
specialized smart city experts, complicated
governance, and stakeholders' engagement
challenges (Shayan et al., 2020). These risks affect
the availability and efficiency of services.
Assessment tools are introduced by different
authors to assess risks related to the operation,
sustainability, or management ( Deveci et al., 2020;
Fernandez-Anez et al., 2018; Patrão et al., 2020 ).
However, these assessment tools are not
comprehensive (Alawad et al.2020; Dimitriadis et al.
,2020;Domingos et al., 2008) as they focus mainly on
technology risks independently from non-technical
risks (Singh & Helfert, 2019).Regarding operation,
which is the focus of this paper, risks become
interrelated and affect performance (Zheng et al.,
2020).
This paper proposes a risk assessment model by
considering technical and non-technical risks during
the operation phase of smart mobility. The model
assesses risks using the Dempster-Shafer (DS) theory.
The paper contributes by proposing a risk
assessment model for smart cities. The model is
generic and is able to include a wide spectrum of
246
Al Sharif, R. and Pokharel, S.
Modeling for Assessment of Risks in Smart City Mobility Operations.
DOI: 10.5220/0013155500003893
In Proceedings of the 14th International Conference on Operations Research and Enterprise Systems (ICORES 2025), pages 246-254
ISBN: 978-989-758-732-0; ISSN: 2184-4372
Copyright © 2025 by Paper published under CC license (CC BY-NC-ND 4.0)

technical and non-technical risks across smart city
project operational phase.
Therefore, the following research questions are
addressed in this paper.
RQ1: What are the main operation phase risks in
smart mobility?
RQ2: How can a smart city risk assessment model be
applied to smart mobility application data?
Further discussion in this paper is organized as
follows: literature review in Section 2. Smart mobility
data is provided in Section 3. Section 4 discusses the
outcome of the analysis, and Section 5 provides the
conclusions.
2 LITERATURE REVIEW
This section illustrates the literature research on the
smart mobility dimension in smart cities, operational
phase risks, and risk assessment tools and models.
2.1 Smart Mobility
Smart mobility is the main dimension of a smart city
that solves common transportation issues(Sharif &
Pokharel, 2021). Technology can support integrated
mobility (Porru et al., 2020).
The technologies that enable smart mobility
include AI, IoT, big data, and blockchain (Paiva et al.,
2021). Smart mobility should aim to use autonomous
vehicles and provide coordinated choices for people
to ease commutation (Appio et al., 2019). The
communication between autonomous cars and smart
mobility is achieved through IoT devices that collect
real-time decision-making data (Silva et al., 2018).
The ability to communicate among the vehicles
through IoT makes it the Internet of Vehicles (IoV),
which allows communication between vehicles and
helps to support traffic safety, efficiency, and smart
mobility (Ismagilova et al., 2019).
The risks associated with smart mobility
applications are the unavailability of network and
sensors' connectivity (Porru et al., 2020), problems
with security and privacy of mobility as a service
application (Paiva et al., 2021), the unavailability of
real-time connectivity and data analytics to use crowd
smart applications(Tao, 2013). These risks need
consideration during the planning and operation of
smart mobility applications (Ullah et al., 2021).
2.2 Risks Related to Smart Mobility
During Operation
During the operation, smart mobility applications are
vulnerable to multiple risks, such as legal, financial,
governance, and technical resources. In addition to
technological risks such as security, interoperability,
network connections, and data privacy (Oladimeji et
al., 2023). A study by Alanazi & Alenezi (2024)
identified major risks in smart mobility applications,
specifically in smart transportation systems: lack of
standards, which will lead to interoperability
challenges when connecting different applications,
and risks related to stakeholders' collaboration and
engagement.
The study provided multiple interoperability
issues related to the layers of the traffic management
system and proposed an interoperability platform
requirement to overcome challenges and risks.
Another study by Lacinák (2021) categorized
risks related to smart transportation systems as risks
related to personal level, such as cyber-attacks and
data privacy. Risks related to the community level,
namely outdated technology infrastructure and
insufficient network connections. Other risk
categories are related to economic levels like
untenable pricing policies, design levels such as
inadequate infrastructure, and strategy levels related
to users' culture change in smart transportation
systems (Lacinák, 2021).
Studies highlight cybersecurity as a significant
risk associated with IoT technology, which is
considered a main building block of smart mobility
applications (Lee, 2020; Ande et al., 2020).
Addressing smart mobility risks requires a robust
legislation and governance framework to set
standards, policies, and guidelines to provide
solutions to technology and non-technology-related
challenges of operating smart transportation systems
and other smart mobility applications (Suthanthira
Vanitha et al., 2021).
2.3 Risk Assessment Tools and Models
Dimitriadis et al. (2020) developed a cybersecurity
risk assessment tool that uses a conjunction of the
OCTAVE approach (for identification, analysis, and
prioritization) and MAGERIT approach (for
identification, analysis, and mitigation and
specifically utilized for communication-related risks)
for a computerized risk assessment in smart sensor
environments. The tool deploys existing standards
and platforms and extracts attack patterns to evaluate
Modeling for Assessment of Risks in Smart City Mobility Operations
247
risks in the automated systems used in smart city
dimensions.
Another tool is the Smart City KPI-guided
Security tool proposed by Ye et al. (2023). The tool
and applications; however, this model is useful for the
design phase of a smart city.
Ullah (2018) proposed a risk index model. The
author applied linear estimation, hierarchical fuzzy
logic, and a composite model to evaluate the risk
index. This model focuses on underground locations
and clustered risk factors to develop a risk index to
prioritize underground locations (Ullah, 2018).
Alawad et al. (2020) proposed a smart mobility
risk assessment model by considering railway
applications. The model evaluates and controls
security and safety risks within railway operations.
The model uses an adaptive neuro-fuzzy inference
system (ANFIS) and artificial neural networks
(ANN) to train an AI model to improve the accuracy
of the risk projections, learning, and capturing actual-
time risk levels. However, the model assumes
linearity of inputs and risk assessment and requires
time for the artificial neural network training.
The use of AI and machine learning for risk
assessment is proposed by (Sharma & Singh, 2022).
The tool is expected to help identify and predict future
risks.
3 RESEARCH DESIGN
This section provides the research method, data
collection, the proposed risk assessment model for
smart cities, and the application of smart mobility
operations risks.
3.1 Research Method
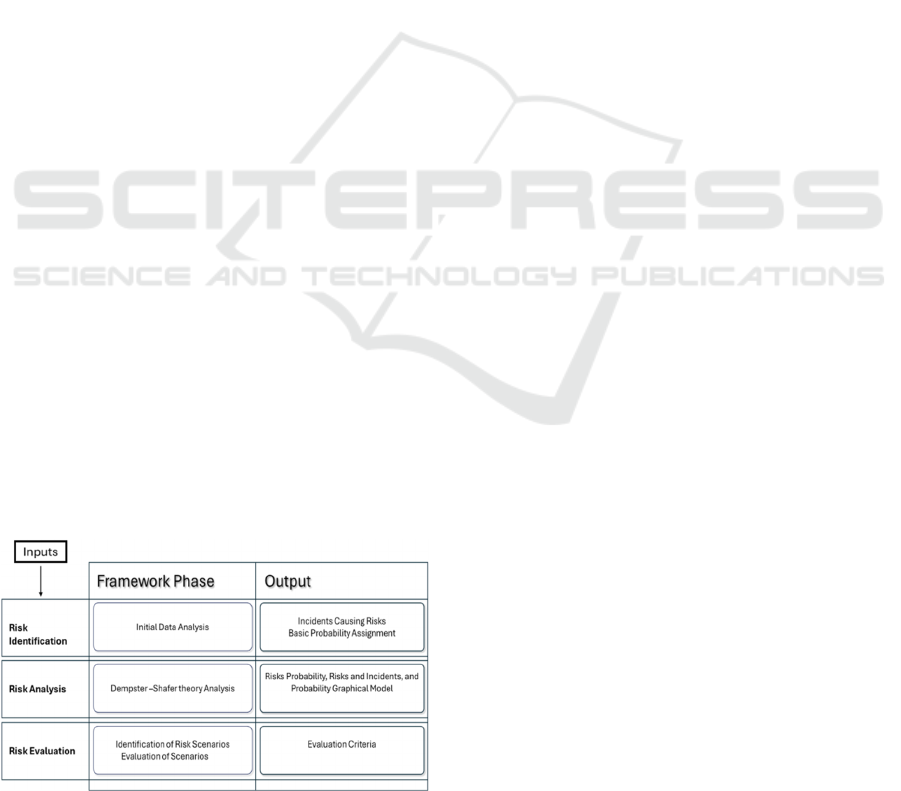
Figure 1 will illustrate the proposed risk assessment
model for smart cities, which will be detailed in the
following paragraphs:
3.1.1 Inputs
Initial data is collected through interviews with
experts and a review of the risk register.
3.1.2 Risk Identification
Initial data is analyzed as follows:
a. Risk incidents are ranked during the interviews.
The interview scripts are studied; challenges and
incidents causing risks are denoted by (I).
b. The data is further streamlined to name subjects
of risk, essentially leading to a basic probability
assignment (the probability of a risk to occur),
represented by (m), for the likelihood of an
incident leading to risk.
c. Incidents causing risks and basic probability
assignments resulted from the risk identification
step.
3.1.3 Risk Analysis
a. The analysis is performed using the DS Theory,
which is considered a generalized probability
theory in a fixed space. In this theory, the
probability of one potential event is assigned to
reciprocally exclusive sets (Dempster, 1968).
b. The inputs for DS theory are incidents causing
each risk resulting from the initial data analysis
and the initial likelihood for these incidents to
occur.
c. DS theory calculates the combined basic
probability assignment of multiple incidents
causing a specific risk.
d. Three main functions are used in DS theory for
analysis: the basic probability assignment
function (m), the belief function (Bel), and the
plausibility function (Pl) are used in the DS
theory. The basic probability assignment
function defines the probability measure over a
set of sample spaces, mapping each subset to a
value between 0 and 1 (eq 1). It assigns a zero
probability to the empty set (eq 2) and ensures
that the sum of probabilities for all subsets in the
power set equals 1 (eq 3).
𝑚: 𝑃
(
𝑋
)
→ 0,1, (1)
𝑚
(
∅
)
=0, (2)
∑
𝑚(𝐴)
∈()
= 1, (3)
Where P(X) is the power of set X and ∅ the null set.
Figure 1: Risk assessment model for smart city.
ICORES 2025 - 14th International Conference on Operations Research and Enterprise Systems
248

e. The interval [0,1] is defined by two factors:
belief (Bel) and plausibility (Pl). For
example, if set (𝐴
) includes all states under
consideration (risks in this paper), and set
(𝐵
) is considered a subset of these states
(incidents causing the risks), then Bel (𝐴
)
represents the sum of all basic probability
assignments (m) for subsets (𝐵
). Similarly,
plausibility Pl (𝐴
) is the sum of the basic
probability assignments for subsets (𝐵
) that
intersect with the set (𝐴
)
𝐵𝑒𝑙
(
𝐴
)
=𝑚(𝐵
)
|
⊆
(4)
𝑃𝑙
(
𝐴
)
=𝑚(𝐵
)
|
∩
∅
(5)
f. The basic probability assignments denoted as
(m), which are combined based on expert
inputs and risk register documents for risk
incident identification, are analyzed using the
DS combination rule.
g. DS combination rule is a stringent AND
operation on the evidence obtained from
various sources to form a joint belief (Sentz
& Ferson, 2002).
h. The joint belief, represented through a basic
probability assignment (𝑚
), is decided by
summing the product of the basic probability
assignments for all sets (referred to as
incidents in this context), as shown in (eq 6).
According to (eq 7), the combined basic
probability assignment (𝑚
), of the null set
is zero.
i. The variable (K) is the basic probability
assignment in conflict scenarios, occurring
when the intersection between incidents is
null, as indicated in (eq 8). The factor (1-K)
is the normalization factor to mitigate the
influence of conflicting evidence. Table 1
illustrates the combination rule parameters.
j. The risk analysis is applied to a sample risk,
which is data protection and privacy, referred
to as DPR. Data protection and privacy risk
is caused by multiple incidents; for example,
incident B incident C, the basic probability
assignment of incident B is denoted as
𝑚
(
𝐵
)
, and the basic probability
assignment for incident C is denoted as
𝑚
(𝐶)
Table 1: DS combination rule parameters.
The following formula shows the combination rule,
which merges the basic probability assignment of a
subset (B) (representing the risk's first incident in this
research) with the basic probability assignment of a
subset (C) (representing the second incident). In this
context, DPR refers to the set of incidents causing this
specific risk. The DS combination rule emphasizes
the agreement among various incidents, which are
sources of risk while reducing the influence of
conflicting data using a normalization factor.
𝑚
(
𝐷𝑃𝑅
)
=
∑
∩
(
)
()
, when
𝐷𝑅𝑃 ≠ ∅
(6)
𝑚
(
∅
)
=0
(7)
were, K=
∑
𝑚
(
𝐵
)
𝑚
(𝐶)
∩∅
(8)
k. As a result of the risk analysis step, incident
combinations are utilized to calculate the
probability of risk occurrence using Bayesian
theory and to identify interrelations through a
Bayesian Network (BN), as the illustrated
formulas in (Stephenson, 2000). Risk scenarios
are developed during risk analysis based on the
initial data analysis from experts' interviews and
the combinations derived from the DS theory.
The complexity of smart city project and the
multiple stakeholders made the development of
the risk scenarios challenging.
3.1.4 Risk Evaluation
a. The risk evaluation step is completed through
risk scenario identification and evaluation.
b. Risk scenarios are represented using a Bayesian
Network, a graphical probabilistic model. The
Bayesian Network (BN) is a directed acyclic
Notation Description
𝑚
(DPR)
Combined basic probability assignment
of a risk of interest (DPR)
𝑚
(𝐵)
Basic probability assignment of an
incident (B)
𝑚
(𝐶)
Basic probability assignment of incident
(C)
K
Basic probability assignment of a conflict
situations
Modeling for Assessment of Risks in Smart City Mobility Operations
249

graph where all edges have a specific direction,
used to find the joint probability of variables
(Stephenson, 2000).
c. The joint probability from the Bayesian Network
is used to calculate the combined probability for
each scenario. Specifically, the combined basic
probability assignment for a given risk is
considered. For instance, the joint probability
resulting from other risks causing operation risk
(OP) is illustrated as follows:
P (CybR, DPR, OP) = P (OP| DPR).
P(OP). P(DPR
|
C
y
br).
(9)
Where OP is operation phase risk, DPR is data
protection and privacy risk, and CybR is
Cybersecurity risk.
The general equation for the joint probability
function in the Bayesian Network is presented as
follows:
P(X) =
∏
(𝑃(𝑋
|𝑃𝑎𝑟𝑒𝑛𝑡𝑠 (𝑋
))
(10)
d. The resulting joint probability for each risk
scenario is used to create decision-making
criteria by evaluating these scenarios against
their impacts on smart city sustainability using
the Analytical Hierarchy Process (AHP). As
introduced by Saaty (1987), AHP involves
pairwise comparisons of risks, where preferences
between elements are assessed on a scale from 1
to 9. The consistency index (CI) and consistency
ratio (CR) are calculated based on these ratings.
If the CR is less than or equal to 0.1, the
evaluation matrix is considered acceptable
(Awasthi & Chauhan, 2011).
e. The evaluation vector is then used to assess each
risk scenario using the weighted sum method.
The following section will provide the collected data
and the application of the first two steps of the model,
where risks will be identified in the first step and
analyzed in the second step of the model.
3.2 Data Collection
Data on smart mobility in Qatar are collected through
an operation team focus group. The discussions
focused on the research questions. Comprehensive
conversations with the focus group took place to
identify the interrelations between risks based on their
experience and daily observations. Also, common
incidents causing risks are used to develop the risk
scenarios.
Project documents were examined to find risks
and risk management strategies throughout the
operation phase for smart mobility. The data collected
are summarized in Table 2, where risks are
considered, incidents causing each risk, and the
experts' basic probability assignment for each
incident to occur; the risk register presents three years
of operation. The basic probability assignments are
ranked using a Likert scale where five is considered
very high probability, four is high, three is moderate,
two is low, and one is very low.
Table 2: Smart transportation application operational risks.
Risk
Incidents causing
risks
Basic
Probability
Assignment
(m)
Year1
Year2
Year 3
Partners
Engagement
Risk
Lack of
communication
between different
Partners
4 3 4
Turnover of some
outsourced
employees from
p
artners
4 3 4
Professionals
and consultants
Risk
Limited
knowledgeable
and trained
experts and
consultants
2 2 3
Continuity of
Operation risk
No clear disaster
recovery plan
4 4 4
Communication
and Network
Infrastructure
risk
Cyberattacks 5 5 5
Lack of
maintenance
model for systems
4 4 3
Data Protection
and Privacy
Risk
Operational error 4 4 3
Cyber attacks 5 5 5
Lack of security
awareness at the
users' level
3 3 2
Cybersecurity
Lack of
maintenance
model for systems
4 4 3
Lack of security
awareness at the
users' level
3 3 2
Cyberattacks 5 5 5
3.3 Application of DS Theory and
Combination Rule
Application of DS theory and combination rule is
ICORES 2025 - 14th International Conference on Operations Research and Enterprise Systems
250

performed to calculate combined basic probability
assignments for the identified risks, which is
presented in Table 3. The combinations of incidents
causing each risk with the highest values are
presented to be considered by the decision-makers.
For each risk, DS theory is applied to incidents as
illustrated in section 3.1, in the risk analysis step.
The collected data presents that partners'
engagement risk resulted from the incidents of lack of
communication between partners and turnover of
some outsourced employees from partners. Applying
DS theory to the data from year 1, year two, and year
three shows that partner engagement risk will occur
due to both incidents occurring concurrently with a
value of 0.444, with the highest combined basic
probability assignment resulting from DS theory and
combination rule application.
For professional and consultant risk, the
combined basic probability assignment of the
incident
limited knowledgeable and trained experts and
consultants for the three years is 0.222.
Continuity of operation risk is caused by no clear
disaster recovery plan. Combining the three years of
data of the basic probability assignment shows that
the combined basic probability for this risk to occur
is a value of 0.222.
Data protection and privacy risk are caused by
three incidents: operation error, lack of security
awareness at the user level, and cyberattacks.
Application of DS theory and combination rule
results that the combined basic probability
assignment has a value of 0.667 for the risk to occur
due to operational error and cyberattacks occurring
simultaneously. The risk has a combined basic
probability assignment of 0.447 to occur if operation
error, lack of security awareness, and user' level
incidents happen at the same time.
Cybersecurity risk results from a lack of
maintenance model for systems, lack of security
awareness at the users' level, and cyberattacks.
Applying the DS theory and combination rule shows
that the combined basic probability assignment for
this risk to occur due to cyberattacks alone is 0.667.
Also, if there is a lack of security awareness at the
users' level and cyberattacks happen concurrently, the
combined basic probability assignment for
cybersecurity risk to occur is 0.667. The incidents of
lack of security awareness at the users' level and lack
of maintenance model for the system, if occurred
simultaneously, will cause cybersecurity risk to occur
with combined basic probability assignment with a
value of 0.447
Table 3: Combined basic probability assignments.
Risk
Combined
incidents
Combined
basic
probability
assignment
Partners
Engagement
Risk
Lack of
communication
between different
Partners
0.444
Turnover of some
outsourced
employees from
partners
Professionals and
consultants Risk
Limited
knowledgeable
and trained
experts and
consultants
0.222
Continuity of
Operation risk
No clear disaster
recovery plan
0.222
Communication
and Network
Infrastructure
risk
Cyberattacks
0.667
Lack of
maintenance
model for
systems
Data Protection
and Privacy Risk
Operational error
0.667
Cyberattacks
Lack of security
awareness at the
users' level
0.447
Operational error
Cybersecurity
Lack of
maintenance
model for
systems
0.447
Lack of security
awareness at the
users' level
Cyber attacks
0.667
Lack of security
awareness at the
users' level
Cyberattacks 0.667
The common risk scenario for operation risk to
occur is due to the occurrence of cybersecurity risk
that will cause data protection and privacy risk,
causing operations discontinuity of interruptions.
P (CybR, DPR, OP) = P (OP| DPR). P(OP).
P(DPR| Cybr)
The joint probability for this scenario is calculated
using (eq10); using the collected data, the value for
the probability of this scenario to transpire is
P (CybR, DPR, OP) = 0.495
Modeling for Assessment of Risks in Smart City Mobility Operations
251

4 DISCUSSIONS
Smart city operation is a complex and
multidisciplinary task where multiple smart systems
must be considered. Since the provided services
within the smart city depend on technological and
non-technological factors, the smart city operation
phase will be vulnerable to multiple risks. This paper
focussed on two research questions. The first one is
related to operation phase risks related to smart
mobility.
The literature shows that during the operation
phase of smart mobility applications, including
technology risks such as cybersecurity and
interoperability, and non-technology risks such as
lack of standards and governance. Smart mobility, as
a major dimension of a smart city, has applications
such as smart transportation systems, which are
studied in this paper.
The technical risks considered in the sample
transportation system are like the risks reviewed in
the literature, yet operation teams need to consider
interoperability risks between various smart mobility
applications.
For non-technology risks, legislation risks,
governance risks, and lack of policies and standards
risks need more attention from operation and
decision-making teams to avoid challenges, such as
service discontinuity, and reputation damage. The
previous paragraph answered the first research
question regarding the main operation phase risks in
smart mobility applications.
The second research question concerns the tools
and models that can be used for assessment. A model
with four main steps and three main tasks (risk
identification, risk analysis, and risk scenarios
evaluation) is proposed. The model uses a focus
group and documentation search (qualitative
approach) for data collection. At the same time, the
analysis phase used DS theory to quantify the
likelihood of risks occurring and to calculate the
combined probability of risk occurrence. The
Bayesian network is used for scenario presentation in
the fourth step, and scenario probabilities are
calculated using Bayesian theory. The presented
scenario probability shows that operation risk will
occur due to technology-related risks, especially
when cybersecurity risk occurs since it will lead to a
cascading effect on other risks.
The model is tested on smart transportation
applications in the operation phase in Qatar. In Qatar,
the operation team considers six main risks:
cybersecurity, data protection and privacy,
communication and network infrastructure, partner
engagement, professional and consultant, and
continuity of operations. The data provided the
incidents leading to these risks and the experts' basic
probability assignments for the incident to arise.
Technology-related risks, namely cybersecurity, data
privacy and protection, and communication and
network infrastructure risks, share similar incidents.
Thus, they are interrelated. The combined incidents
with cyberattack incidents have a high basic
probability assignment. Accordingly, serious
protective measures need to be taken to avoid or
minimize the consequences on smart transportation
systems in case such incidents occur.
The paper shows that applying DS theory and the
combination rule provides a quantitative value for
combined basic probability assignments for incidents.
Accordingly, decision-makers can take the proper
measures to manage these risks. High probability
risks from specific incidents will be clear, and
mitigation plans can be developed to avoid or
minimize the consequences of the risks.
For instance, the combined basic probability
assignments for the incidents, cyber-attacks, and lack
of security awareness at the users' level is 0.667,
which is considered high probability(Acebes et al.,
2024) and, in comparison to the other incidents, and.
Thus, in the case of an application, management
needs to take measures to raise cyberattack security
awareness.
Also, looking at partners' engagement risk, the
probability of the two incidents causing this risk to
occur in the same period is obtained as 0.444.
Therefore, management must ensure proper
communication between different partners and
minimize the turnover of outsourced employees,
specifically from partners.
Identifying individual scenarios is challenging, as
each smart city scenarios could be different due to
unique design of applications systems and represent
complexity through a number of interconnections
between systems and stakeholders (Damasiotis,
2022).
Based on the outcome, it can be mentioned that
data gathering and analysis with DS theory can help
decision-makers understand the risk situation and
prepare the right measures to mitigate risk impact.
5 CONCLUSIONS
The paper reviews various risk factors and assessment
models that can be applied to smart mobility
applications. A model is proposed to address risks in
smart mobility. The model is tested on a smart
ICORES 2025 - 14th International Conference on Operations Research and Enterprise Systems
252

transportation application in Qatar and found that the
assessment with the proposed model can help make
risk management decisions.
Future research can investigate the interrelations
between smart mobility risks, apply the Bayesian
Network and theory, and produce a decision-making
criterion for this significant smart city dimension.
Another aspect of future research is investigating
the transferred risks from the design or
implementation phases of the smart city application
lifecycle. Finding a way to consider them in
probability calculations will provide robust results
when the decision-making criteria are built.
REFERENCES
Acebes, F., González-Varona, J. M., López-Paredes, A., &
Pajares, J. (2024). Beyond probability-impact matrices
in project risk management: A quantitative
methodology for risk prioritisation. Humanities and
Social Sciences Communications, 11(1), 1–13.
https://doi.org/10.1057/s41599-024-03180-5
Alanazi, F., & Alenezi, M. (2024). Interoperability for
intelligent traffic management systems in smart cities.
International Journal of Electrical and Computer
Engineering, 14(2), 1864–1874. https://doi.org/10.
11591/ijece.v14i2.pp1864-1874
Alawad, H., An, M., & Kaewunruen, S. (2020). Utilizing an
adaptive neuro-fuzzy inference system (ANFIS) for
overcrowding level risk assessment in railway stations.
Applied Sciences (Switzerland), 10(15). https://doi.
org/10.3390/app10155156
Ande, R., Adebisi, B., Hammoudeh, M., & Saleem, J.
(2020). Internet of Things: Evolution and technologies
from a security perspective. Sustainable Cities and
Society, 54(February 2019), 101728. https://doi.org/10.
1016/j.scs.2019.101728
Appio, F. P., Lima, M., & Paroutis, S. (2019).
Understanding Smart Cities: Innovation ecosystems,
technological advancements, and societal challenges.
Technological Forecasting and Social Change,
142(December 2018), 1–14. https://doi.org/10.1016/j.
techfore.2018.12.018
Awasthi, A., & Chauhan, S. S. (2011). Using AHP and
Dempster-Shafer theory for evaluating sustainable
transport solutions. Environmental Modelling and
Software, 26(6), 787–796. https://doi.org/10.1016/j.
envsoft.2010.11.010
Damasiotis, V. (2022). Modeling Project Management
Complexity in Smart Cities’ Projects. In P. Fitsilis
(Ed.), Building on Smart Cities Skills and
Competences: Human factors affecting smart cities
development (pp. 169–183). Springer International
Publishing. https://doi.org/10.1007/978-3-030-97818-
1_10
Dempster, A. P. (1968). A Generalization of Bayesian
Inference. Journal of the Royal Statistical Society:
Series B (Methodological), 30(2), 205–232.
https://doi.org/10.1111/j.2517-6161.1968.tb00722.x
Deveci, M., Pekaslan, D., & Canıtez, F. (2020). The
assessment of smart city projects using zSlice type-2
fuzzy sets based Interval Agreement Method.
Sustainable Cities and Society, 53(August 2019).
https://doi.org/10.1016/j.scs.2019.101889
Domingos, P., Rita, A., Terra, T., & Ignácio, S. R. (2008).
FMEA as a Tool for Managing Risks in ICT Projects ,
based on the PMBOK. Asian Journal of Business and
Management Sciences, 3(12), 1–24.
Fernandez-Anez, V., Velazquez, G., Perez-Prada, F., &
Monzón, A. (2018). Smart City Projects Assessment
Matrix: Connecting Challenges and Actions in the
Mediterranean Region. Journal of Urban Technology,
0(0), 1–25. https://doi.org/10.1080/10630732.
2018.1498706
Hasija, S., Shen, Z. J. M., & Teo, C. P. (2020). Smart city
operations: Modeling challenges and opportunities.
Manufacturing and Service Operations Management,
22(1), 203–213. https://doi.org/10.1287/msom.
2019.0823
Ismagilova, E., Hughes, L., Dwivedi, Y. K., & Raman, K.
R. (2019). Smart cities: Advances in research—An
information systems perspective. International Journal
of Information Management, 47(December 2018), 88–
100. https://doi.org/10.1016/j.ijinfomgt.2019.01.004
Lacinák, M. (2021). Resilience of the Smart Transport
System - Risks and Aims. Transportation Research
Procedia, 55, 1635–1640. https://doi.org/10.1016/j.
trpro.2021.07.153
Lee, I. (2020). Internet of Things (IoT) Cybersecurity:
Literature Review and IoT Cyber Risk Management.
Future Internet, 12(9), 157. https://doi.org/10.
3390/fi12090157
Oladimeji, D., Gupta, K., Kose, N. A., Gundogan, K., Ge,
L., & Liang, F. (2023). Smart Transportation: An
Overview of Technologies and Applications. Sensors,
23(8), 1–32. https://doi.org/10.3390/s23083880
Paiva, S., Ahad, M. A., Tripathi, G., Feroz, N., & Casalino,
G. (2021). Enabling technologies for urban smart
mobility: Recent trends, opportunities and challenges.
Sensors, 21(6), 1–45. https://doi.org/10.3390/s21062143
Patrão, C., Moura, P., & Almeida, A. T. de. (2020). Review
of Smart City Assessment Tools. Smart Cities, 3(4),
1117–1132. https://doi.org/10.3390/smartcities3040055
Porru, S., Misso, F. E., Pani, F. E., & Repetto, C. (2020).
Smart mobility and public transport: Opportunities and
challenges in rural and urban areas. Journal of Traffic
and Transportation Engineering (English Edition),
7(1), 88–97. https://doi.org/10.1016/j.jtte.2019.10.002
Sentz, K., & Ferson, S. (2002). Combination of Evidence in
Dempster- Shafer Theory. Contract, April, 96.
http://citeseerx.ist.psu.edu/viewdoc/download?doi=10.
1.1.122.7929&rep=rep1&type=pdf
Sharif (RS), R. Al, & Pokharel (SP), P. S. (2021). Smart
City Dimensions and Associated Risks: Review of
literature. Sustainable Cities and Society, June, 103542.
https://doi.org/10.1016/j.scs.2021.103542
Modeling for Assessment of Risks in Smart City Mobility Operations
253

Sharif, R. Al, & Pokharel, S. (2021a). Risk analysis with
the dempster–shafer theory for smart city planning: The
case of qatar. Electronics (Switzerland), 10(24).
https://doi.org/10.3390/electronics10243080
Sharif, R. Al, & Pokharel, S. (2021b). Smart City
Perspectives in the Context of Qatar. Sustainable Smart
Cities and Territories International Conference, 103–
113.
Sharma, A., & Singh, U. K. (2022). Modelling of smart risk
assessment approach for cloud computing environment
using AI & supervised machine learning algorithms.
Global Transitions Proceedings, 3(1), 243–250.
https://doi.org/10.1016/j.gltp.2022.03.030
Shayan, S., Kim, K. P., Ma, T., & Nguyen, T. H. D. (2020).
The first two decades of smart city research from a risk
perspective. Sustainability (Switzerland), 12(21), 1–20.
https://doi.org/10.3390/su12219280
Silva, B. N., Khan, M., & Han, K. (2018). Towards
sustainable smart cities: A review of trends,
architectures, components, and open challenges in
smart cities. Sustainable Cities and Society, 38(August
2017), 697–713. https://doi.org/10.1016/j.scs.
2018.01.053
Singh, P., & Helfert, M. (2019). Smart cities and associated
risks: Technical v/s non-technical perspective. CHIRA
2019 - Proceedings of the 3rd International Conference
on Computer-Human Interaction Research and
Applications, May, 221–228. https://doi.org/10.
5220/0008494402210228
Stephenson, T. (2000). Main Bayesian Network Auxiliary
Article. Idiap Research Report, 31.
http://ftp.idiap.ch/pub/reports/2000/rr00-03.pdf
Suthanthira Vanitha, N., Radhika, K., Maheshwari, M.,
Suresh, P., & Meenakshi, T. (2021). IoT‐Based
Intelligent Transportation System for Safety. Cloud and
IoT‐Based Vehicular Ad Hoc Networks, 47–65.
https://doi.org/10.1002/9781119761846.ch3
Tao, W. (2013). Interdisciplinary urban GIS for smart
cities: Advancements and opportunities. Geo-Spatial
Information Science, 16(1), 25–34. https://doi.org/10.
1080/10095020.2013.774108
Ullah, F., Qayyum, S., Thaheem, M. J., Al-Turjman, F., &
Sepasgozar, S. M. E. (2021). Risk management in
sustainable smart cities governance: A TOE
framework. Technological Forecasting and Social
Change, 167(November 2020), 120743. https://doi.
org/10.1016/j.techfore.2021.120743
Ullah, I. (2018). applied sciences Analytical Modeling for
Underground Risk Assessment in Smart Cities.
https://doi.org/10.3390/app8060921
Ye, T., Zhuang, Y., & Qiao, G. (2023). SCKPISec: A KPI-
Guided Model-Based Approach to Realize Security by
Design for Smart City Systems. Sustainability
(Switzerland),
15(3). https://doi.org/10.3390/
su15031884
Zheng, C., Yuan, J., Zhu, L., Zhang, Y., & Shao, Q. (2020).
From digital to sustainable: A scientometric review of
smart city literature between 1990 and 2019. Journal of
Cleaner Production, 258, 120689. https://doi.org/10.
1016/j.jclepro.2020.120689.
ICORES 2025 - 14th International Conference on Operations Research and Enterprise Systems
254
