
Automatic Classification of Parkinson’s Disease
Through the Fusion of Sustained Vowel Descriptors
Sahar Hafsi
1,2
, Linda Marrakchi-Kacem
1
, Farouk Mhamdi
1,3
and Sonia Djaziri-Larbi
1
1
Signals & Smart Systems Lab (L3S), National School of Engineering of Tunis, University of Tunis El Manar, Tunisia
2
Laboratory of Informatics Paris Descartes (LIPADE), University Paris Cit
´
e, France
3
Higher School of Statistics and Information Analysis, University of Carthage, Tunisia
Keywords:
Parkinson’s Disease, Speech as a Biomarker, Acoustic Descriptors, Feature Fusion, Machine Learning.
Abstract:
Voice disorders are early symptoms of Parkinson’s disease (PD) and have motivated the use of speech as a
biomarker for PD. In particular, dysfunctional phonation of sustained vowels has gained increasing interest in
the automatic classification of PD. However, most studies typically focus on a single vowel to extract disease
descriptors, which may limit the detection of subtle vocal alterations present in PD patients. The main objective
of this study is to investigate the contribution of analyzing two vowels for the automatic classification of PD,
as opposed to relying on a single vowel. In this paper, we propose a novel automatic approach to identify
dysphonia in PD by combining speech descriptors extracted from two sustained vowels, /a:/ and /i:/. This
fusion enables the detection of a broader range of vocal alterations, thereby increasing the robustness of the
predictive models. A preprocessing of the speech signals was performed, followed by feature selection using
the ReliefF algorithm. Then, a robust nested cross-validation was applied to evaluate the models. The results
clearly indicate higher classification performance when combining the descriptors of /a:/ and /i:/.
1 INTRODUCTION
Parkinson’s Disease (PD) is the second most common
neurodegenerative disease in the world, that affects
the central nervous system (Bhat et al., 2018). The
diagnosis of PD is usually based on medical observa-
tion of specific clinical signs including a range of mo-
tor symptoms. However, some non-motor symptoms
of PD, manifest at an early stage and in a subtle way,
making their clinical observation and interpretation
difficult. Studies (Ho et al., 1998) report that approx-
imately 90% of patients with PD have some form of
voice impairment which is one of the earliest indica-
tors of this disease (Harel et al., 2004). To assist clin-
icians make early diagnosis of PD, machine learning
(ML) approaches have been widely applied to differ-
ent physiological signals (Jeancolas et al., 2016; Mei
et al., 2021), including voice.
The last decade’s growing interest for voice as a
PD biomarker is motivated by its simple and non-
invasive measurement, in addition to the availability
of powerful speech processing tools to extract valu-
able information from voice signals. Various studies
have been proposed in the literature, where several
experimental and methodological aspects have been
tested in order to analyze their impact on the perfor-
mance of classification models for PD. Recent stud-
ies have been carried out by combining different ML
approaches on several types of speech data, using dif-
ferent descriptors.
As speech impairment in PD may be related to al-
tered production of vocal sounds (dysphonia) or/and
to speech articulation problems (dysarthria) (Arm-
strong and Okun, 2020), some of these studies fo-
cus on dysarthria and use speech signals (Galaz et al.,
2016; Jeancolas et al., 2016), others on dysphonia and
use sustained vowels (Hlavnicka et al., 2019; Little
et al., 2009), or even both (Tsanas et al., 2012). Even
though speech (numbers, words, predefined or spon-
taneous sentences) corresponds better to our natural
everyday use, sustained vowels are more convenient
for sharing open access databases (DB) since they are
almost language and culture independent, while car-
rying the necessary information about dysphonia (Lit-
tle et al., 2009; Sakar et al., 2013).
Various previous studies have examined the ef-
fectiveness of sustained vowels in PD classification,
using different DB. The authors (Villa-Ca
˜
nas et al.,
2014) reported a detection accuracy of 71.6% using
the phonation /i:/, and an accuracy rate of 70.67% for
878
Hafsi, S., Marrakchi-Kacem, L., Mhamdi, F. and Djaziri-Larbi, S.
Automatic Classification of Parkinson’s Disease Through the Fusion of Sustained Vowel Descriptors.
DOI: 10.5220/0013156100003911
Paper published under CC license (CC BY-NC-ND 4.0)
In Proceedings of the 18th International Joint Conference on Biomedical Engineering Systems and Technologies (BIOSTEC 2025) - Volume 1, pages 878-885
ISBN: 978-989-758-731-3; ISSN: 2184-4305
Proceedings Copyright © 2025 by SCITEPRESS – Science and Technology Publications, Lda.

the vowel /a:/, on a group of 50 PD and 50 healthy
controls (HC). This explains the significant variations
in the efficiency of classification based on different
phonemes, highlighting the importance of taking into
account the acoustic particularities of each vowel for
PD analysis.
Nevertheless, there are PD classification studies
that report particularly high accuracy scores. For ex-
ample, in (Tsanas et al., 2012) and (Hariharan et al.,
2014), the authors achieved 98.6% and 100% de-
tection accuracy, respectively, using the vowel /a:/.
These results were obtained by analyzing a database
including 263 samples from 43 subjects (33 PD and
10 HC). However, these data were collected using six
or seven repetitions of the same vowel performed by
the same subject, which indicates a potential overfit-
ting problem when training the ML model. Datasets
typically contain multiple speech recordings per sub-
ject (i.e. multiple voice tasks with two or more repe-
titions of each one).
According to the reported works on voice-based
PD classification, the two most commonly used
datasets are described in (Little et al., 2009) and
in (Sakar et al., 2013), and are available in University
of California Irvine (UCI) ML repository as already
extracted and organized features. Given that sample
sizes of the datasets are rather small (31 and 40, re-
spectively), some studies have used subjects record-
ings’ repetitions as independent training and valida-
tion data to form the models. This method may lead
to biased results (Naranjo et al., 2016), as models may
overfit the training data, leading to overly optimistic
performance.
To avoid this problem while exploiting all avail-
able data samples, (Sakar and Kursun, 2010) pro-
posed a suitable cross-validation method. It consists
in keeping all the observations of the same subject,
in the test phase. This approach was then improved
by a more recent one which gives better classifica-
tion results (Sakar et al., 2013). It was based on cen-
tral tendency and feature dispersion metrics extracted
from different voice recordings of the same subject.
Although summarizing multiple voice samples from
each individual into a single sample has improved the
reliability of PD classification results (Sakar et al.,
2013), taking central tendency and dispersion met-
rics could reduce the information provided by differ-
ent voice tasks.
Therefore, it seems interesting to study the con-
tribution of each vocal task and then combine the de-
scriptors of the different tasks. We began this process
by individually analyzing the vocal descriptors of two
different sustained vowels to assess their respective
contributions. First, we used a single recording of the
same subject to avoid overfitting. Then, we combined
the vocal descriptors extracted from each vowel in a
single features vector. The aim is to provide a ro-
bust and unbiased assessment, highlighting the con-
tribution of feature fusion, while still looking for high
classification scores.
To our knowledge, no previous study has simi-
larly delved into the importance of sustained vowels
descriptor fusion for PD classification, with the ex-
ception of a single reference (Pah et al., 2022). This
study, although it explored the combination of vowel
descriptors, did not provide precise details on the fu-
sion methodology. The results of the study (Pah et al.,
2022) demonstrate that features linked to the vocal
tract length (VTL) are the most adapted to differen-
tiate PD voice from healthy one. It should be noted
that the authors of (Pah et al., 2022), did not mention
whether they used one or more vowel repetitions of
the same subject, which may suggest a risk of bias in
the classification results. The other crucial difference
to consider compared to paper (Pah et al., 2022), is the
diversity of descriptors used as inputs for the classi-
fiers. In our study, we opted for five different classifi-
cation models. This allows us to explore multiple per-
spectives on the data and determine which model per-
forms best in detecting vocal alterations in Parkinso-
nian voice. In contrast, the study in (Pah et al., 2022)
is limited to a single classification model, namely the
support vector machine (SVM), and uses only four
distinct groups of inputs: intensity, pitch, formants,
and VTL.
In this study, we focus on the fusion of vocal de-
scriptors, extracted from sustained vowels /a:/ and /i:/.
The main objective is to demonstrate that combining
these vowels descriptors improves classification per-
formance compared to using descriptors of a single
vowel.
The remainder of the paper is organized as fol-
lows: section 2 details the adopted approach, used
database, signals preprocessing and the extracted
speech descriptors. Section 3 gives the details of fea-
ture selection (FS), ML techniques as well as clas-
sification models. Section 4 includes the results of
each experiment, classification performance and dis-
cussion. Finally, we outline the major findings in the
conclusion.
2 SPEECH DATA
The proposed PD classification framework is illus-
trated in Fig. 1. The use of vowels in speech-based
PD classification is justified by their ability to cap-
ture subtle vocal alterations and their phonetic stabil-
ity, which enables more accurate acoustic analysis.
Automatic Classification of Parkinson’s Disease Through the Fusion of Sustained Vowel Descriptors
879

Figure 1: Block diagram of the proposed approach : sustained vowel descriptors’ fusion.
2.1 Dataset
The PC-GITA DB (Orozco-Arroyave et al., 2014)
used in this study, consists of 100 Colombian Span-
ish native speakers, equally distributed between 50
PD patients and 50 HC, matched by age and gen-
der. This corpus includes a variety of voice record-
ings, such as text readings, words and vowels phona-
tion. It contains three repetitions of five vowels, pro-
nounced in two ways: sustained manner and with a
tone change from low to high. Speech recordings
were sampled at a frequency of 44.1 kHz with 16-bit
resolution (Orozco-Arroyave et al., 2014).
We restricted our selection to recordings of the
sustained vowels /a:/ and /i:/, with only one record-
ing per vowel and per individual (cf. subsection 2.2),
resulting in a DB of 100 samples for each vowel. We
limited our analysis to two vowels from the PC-GITA
DB to balance vocal descriptors with participant num-
bers, avoiding overfitting and reducing computation
time. Also, literature highlights sustained vowels /a:/
and /i:/ as most effective for PD classification (Mei
et al., 2021), (Islam et al., 2023) and (Bhattacharjee
et al., 2023). Moreover, we chose /a:/ and /i:/ be-
cause of their phonetic similarity across languages,
which aids cross-linguistic comparisons and minimiz-
ing pronunciation effects on speech measures.
2.2 Impact of Data Dependence on
Classification Accuracy
In this study, the decision to use only one vowel
recording per individual is driven by the need to en-
sure data independence. By limiting each subject to
a single recording, we ensured a dataset where each
sustained vowel is represented in a balanced manner
across individuals. Using multiple samples from the
same person in speech classification introduces sev-
eral types of errors. The primary concern is overfit-
ting, where the model may learn individual-specific
vocal details rather than the general phonation char-
acteristics of healthy control (HC) or PD patients.
According to the study in (Naranjo et al., 2016),
classification methods that assume data independence
should not be used when multiple voice recordings
from the same subjects are present. The authors ex-
plain that this creates an artificial increase in sam-
ple size, resulting in high performance on the train-
ing data but poor generalization to new data. In-
deed, treating dependent data as independent is a
common practice in speech analysis-based classifica-
tion. Several studies such as (Das, 2010), (Tsanas
et al., 2012), (Jafari, 2013) and (Orozco-Arroyave
et al., 2013), have used multiple recordings from the
same subject as independent data. This practice leads
to biased classification results, as the model’s perfor-
mance is overestimated by artificially treating similar
recordings as independent data.
2.3 Speech Signal Preprocessing
Preprocessing is a crucial step to prepare the record-
ings for the extraction of speech descriptors. Various
techniques such as re-sampling, normalization, seg-
mentation, and filtering allow to obtain speech signals
that are better suited for subsequent analyses.
We first down-sampled the signals to 8 kHz, since
the 0-4 kHz frequency band contains the main phona-
tion information, such as formants, pitch, and har-
monics. We also applied a pre-emphasis filter, which
accentuates high-frequency components (Gore et al.,
2020), associated with rapid transitions in the speech
signal. This filter can make more detectable some in-
dicators often associated with PD such as irregular-
ities in pitch modulation or in rapid articulation of
phonemes. The effect of the pre-emphasis filter is
highlighted in Fig.2.
2.4 Voice Descriptors
This study focuses on the analysis of sustained vowels
to detect speech disorders specific to PD, which affect
patients’ ability to maintain steady vocal folds vibra-
tions (pitch and harmonics) and a stable position of
the vocal tract articulators during vowel production.
BIOSIGNALS 2025 - 18th International Conference on Bio-inspired Systems and Signal Processing
880
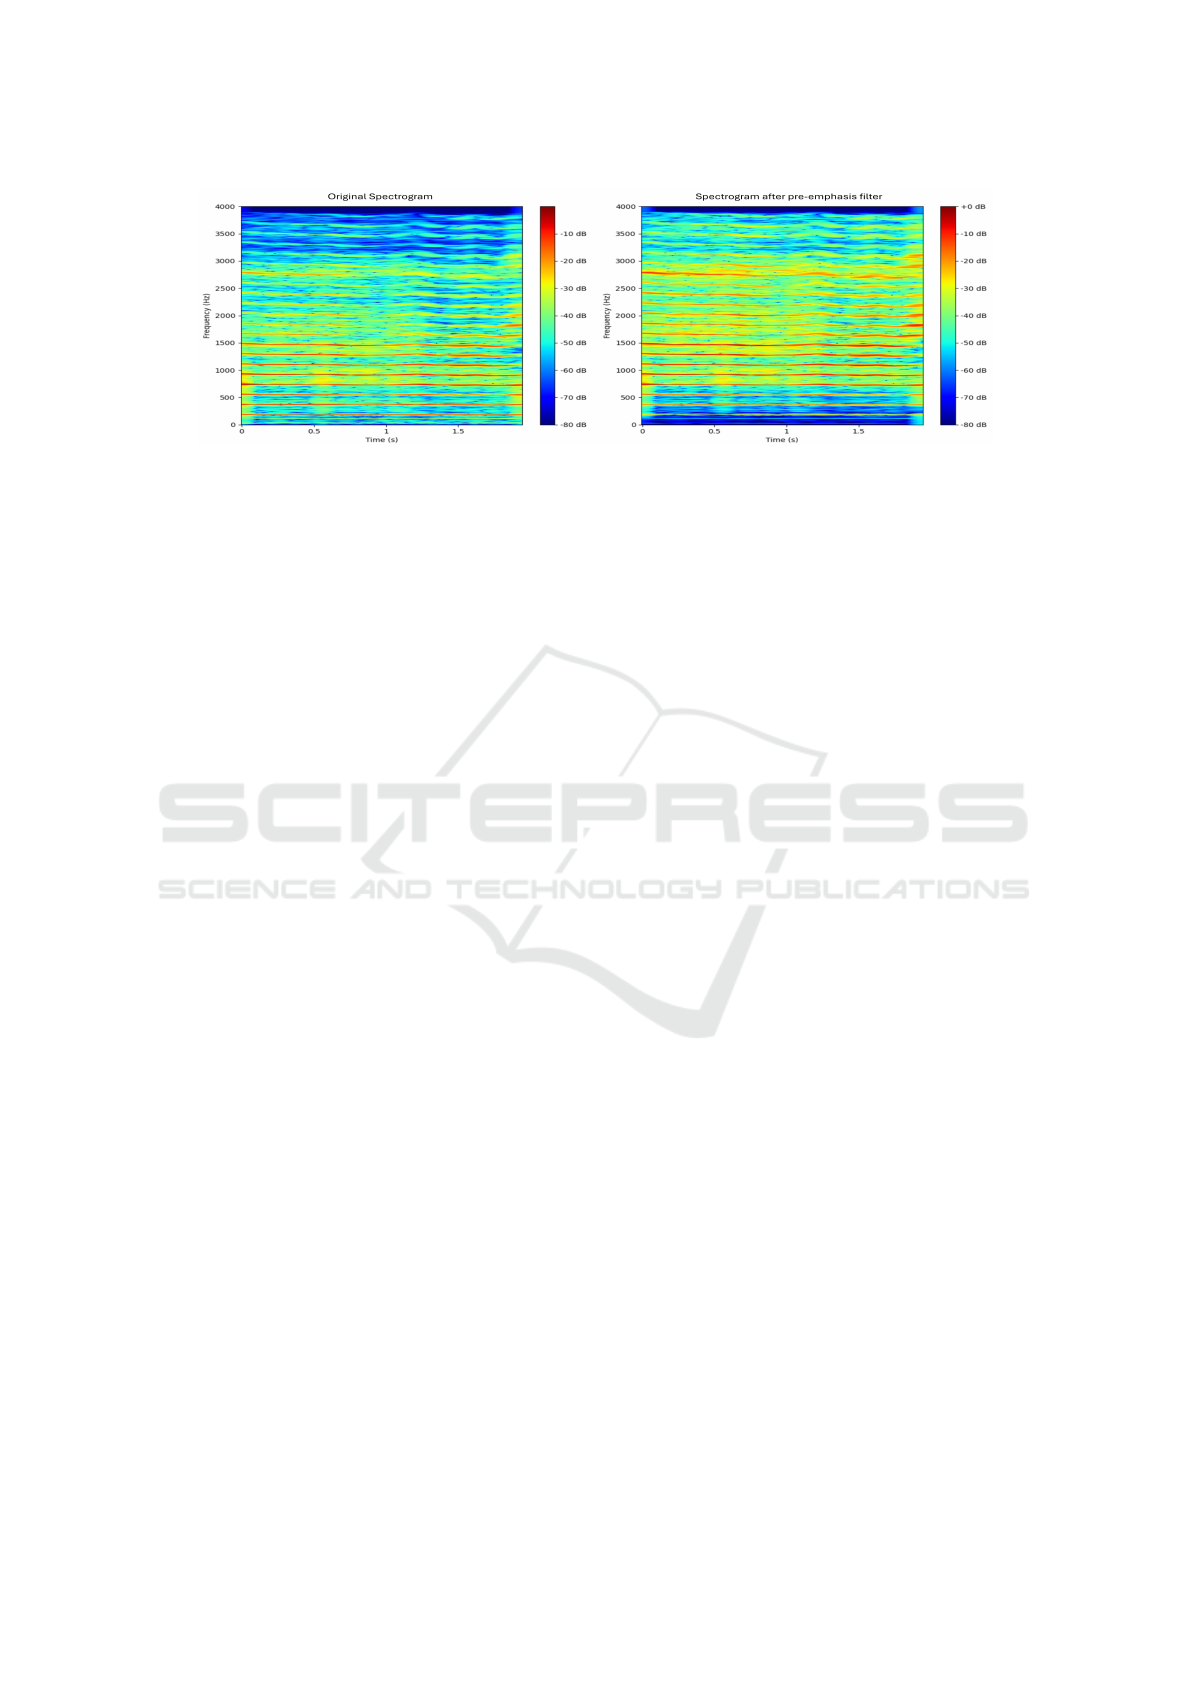
Figure 2: Comparison of spectrograms before and after pre-emphasis filter: the sustained vowel /a:/ of a HC. On the left, the
original spectrogram: low-frequency components are the most present. On the right, the pre-emphasized spectrogram shows
a relative increase in higher frequency components.
The sustained vowel speech task involves producing
the vowel steadily and without interruption for as long
as possible.
To evaluate phonation changes in PD, several
acoustic voice parameters have been studied in the
literature. In this work, we selected three groups
of features that characterize speech production dis-
orders related to the vibratory function of the vocal
folds and the resonances of the vocal tract. The first
group of descriptors consists of time-domain descrip-
tors, namely pitch, jitter, shimmer and their variants.
This group captures abnormal pitch variations during
sustained phonation. While healthy voices show natu-
ral pitch variation (low vibrato and tremor), impaired
control of steady voice pitch during sustained vowel
production is a common symptom in PD. We also in-
cluded the Pitch Period Entropy (PPE) and the Recur-
rence Period Density Entropy (RPDE) descriptors in
the first group. PPE was introduced in (Little et al.,
2009) as an effective measure for discriminating nat-
ural pitch variations from those caused by PD, while
RPDE (Little et al., 2007) assesses the degree of peri-
odicity based on phase calculations and is considered
as a good indicator of pitch irregularity.
The second group of descriptors consists of
Harmonics-to-Noise Ratio (HNR) and Detrended
Fluctuation Analysis (DFA) (Little et al., 2007),
which assess the noise produced by turbulent air-
flow through the vocal system due to incomplete clo-
sure of the vocal cords, thereby characterizing voice
harshness. The third group includes spectral do-
main features: Perceptual Linear Predictive Coef-
ficients (PLPC) and Mel Frequency Cepstral Coef-
ficients (MFCC) along with their first and second
derivatives. Both are computed on short-term win-
dows of the signal, typically 20 to 30 ms. They char-
acterize the spectral envelope of speech on a non-
linear scale (the Mel scale for MFCC and the Bark
scale for PLPC), which mimics the human hearing
scale. In particular, MFCC and PLPC capture the
frequency of the vocal tract resonances (or formants)
and are good indicators for vocal tract misplacement
during sustained vowel phonation (Bouagina et al.,
2023).
2.5 Descriptor Extraction
The descriptors extracted with Parselmouth, pitch, jit-
ter, and shimmer and their derivatives are obtained by
a global analysis. They are calculated by taking into
account the entire voice recording. Therefore, the re-
sulting measures represent average values for the en-
tire duration of the recording.
MFCC, PLPC, HNR and SFM, are computed
frame by frame to capture the characteristics of the
audio signal. We extracted 13 MFCCs, 13 δMFCCs,
13 δ
2
MFCCs and 13 PLPCs per analysis window
(Dave, 2013). After dividing the signal into over-
lapping frames and extracting these coefficients from
each frame, the final descriptors are obtained by tak-
ing the values’ average of each coefficient. The RPDE
and DFA calculations are carried out on the entire au-
dio signal, resulting in global measurements for each
recording rather than specific values for individual
segments or frames. As for PPE, it consists of extract-
ing the pitch, analyzing its variations over the entire
recording, then quantifying the diversity of fluctua-
tions by calculating the entropy of probability distri-
bution of the variations. In total, we used 70 speech
descriptors per vowel. The vocal feature sets were ex-
tracted from the sustained vowels /a:/ and /i:/, and they
are computed using preconfigured libraries available
in Python such as Parselmouth library (Jadoul et al.,
2018) and Librosa (McFee et al., 2015). By combin-
ing these descriptors, which capture vocal cord and
vocal tract tremors, we have a set of vocal descriptors
to automatically classify PD dysphonia.
Automatic Classification of Parkinson’s Disease Through the Fusion of Sustained Vowel Descriptors
881

3 CLASSIFICATION
This section highlights the strengths of our classifi-
cation approach, focusing on the nested k-fold cross-
validation and FS method. The nested k-fold ensures
reliable classification performance by addressing data
size constraints, while FS reduces dimensionality by
selecting the most relevant vocal descriptors, enhanc-
ing model performance.
We conducted several experiments to classify PD
dysphonia based on vocal descriptors. First, we clas-
sified features extracted from the sustained vowel /a:/,
then features from the sustained vowel /i:/. Following
this, we combined the descriptors from both vowels
(/a:/ + /i:/) for a fusion analysis. In each experiment,
we evaluated five supervised ML models: k-Nearest
Neighbor (KNN), Decision Tree (DT), Support Vec-
tor Machine (SVM), Random Forest (RF), and Gradi-
ent Boosting (GB).
3.1 Nested k-Fold Cross-Validation
When working with small datasets, it can be chal-
lenging to balance providing enough data for the
model to train effectively and reserving sufficient
test data to evaluate the model on unseen subjects.
Cross-validation has long been a reliable solution
for this. However, using traditional cross-validation,
combined with data normalization, FS and hyperpa-
rameters tuning, can lead to a data leakage problem,
where information from the test set unintentionally in-
fluences the training process.
The cross-validation approach we implemented
addresses this issue by maximizing the use of avail-
able data while preventing data leakage through a
two-step nested cross-validation process (Fig. 3). As
the first step, the outer k
1
-fold cross-validation splits
the dataset into an initial training set and a testing set,
with k
1
=5 folds. In each outer iteration, 4 folds are
used for model training, while the 5th fold is reserved
for testing. In the next step, an inner k
2
-fold cross-
Figure 3: Classification approach: application of double,
nested k-fold cross-validation for model evaluation.
validation further splits the previously obtained train-
ing set (the 4 folds) into a new training set and a val-
idation set, where k
2
=4. In each iteration of the inner
cross-validation, 3 folds are used for model training,
while the 4th fold is used for hyperparameter tuning,
using GridSearchCV. Once the optimal hyperparame-
ters are identified, we evaluate the final performance
of our models on the initially reserved test set.
3.2 Feature Preprocessing
For each experiment involving one or two sustained
vowels, feature preprocessing was applied to the
training set in each iteration of the outer k
1
-fold cross-
validation, which included normalization and FS.
3.2.1 Normalization
Normalization was applied in the outer cross-
validation using MinMaxScaler. The minimum and
maximum values of the descriptors were computed
only from the train set insuring that the test set does
not influence the train process. These parameters
were then used to normalize train and test sets.
3.2.2 Feature Selection
The number of features plays a crucial role in binary
classification, especially when working with small
datasets. An excess of features relative to the num-
ber of observations can lead to overfitting (Guyon and
Elisseeff, 2003) (Bol
´
on-Canedo et al., 2013). There-
fore, a judicious selection of variables is essential to
maximize the model’s accuracy. Given that we have
70 features for each vowel and we are combining two
vowels for a dataset of 100 subjects, we must con-
sider the direct impact on data dimensionality. The
fusion of vowel features increases the total number
of features to 140, which is a high-dimensional vec-
tor relative to the number of samples. Thus, a FS
method was performed before the classification step.
As for the data normalization and to avoid data leak-
age, FS was performed at each iteration of the outer
cross-validation using the ReliefF algorithm. We re-
tain only the 10 most significant speech descriptors
for training the classifiers in each configuration (/a:/,
/i:/, and /a:/+/i:/).
The ReliefF method is a widely used FS technique
for identifying the most discriminatory variables in
a dataset, based on the differences observed between
close samples (Rosario and Thangadurai, 2015). The
principle of ReliefF relies on the iterative updating of
feature weights according to their ability to differen-
tiate samples belonging to different classes. ReliefF
algorithm identifies, for each sample in the dataset,
BIOSIGNALS 2025 - 18th International Conference on Bio-inspired Systems and Signal Processing
882

its close neighbors, both from the same class (posi-
tive) and from the opposite class (negative). By com-
paring the feature values of this sample with those of
its neighbors, the algorithm increases the score of the
feature if it is similar to those of the positive neigh-
bors. At the end of this iterative process, each feature
receives a score that reflects its relevance.
The choice of ReliefF as a FS technique is mo-
tivated by several reasons. It is effective in han-
dling datasets with redundant and correlated features,
which is the case here where several speech descrip-
tors may contain similar information (Urbanowicz
et al., 2018). Also, this algorithm is well-suited for
handling datasets with a high dimensionality relative
to their size.
3.3 Performance Evaluation
Performance evaluation is conducted at each iteration
of the outer cross-validation by calculating several
key indicators such as accuracy, precision, sensitiv-
ity (recall), and F1 score. Each iteration provides a
measure of these parameters. At the end of the cross-
validation process, an overall analysis is performed by
calculating the mean and standard deviation of each
of these performance indicators. This evaluates the
model’s average performance providing a more robust
assessment of the results.
4 RESULTS AND DISCUSSION
4.1 Features Analysis
By analyzing the results of the double nested cross-
validation, we observed that some features systemat-
ically reappeared as the most relevant for the clas-
sification. Our preliminary analyses revealed that
10 features are sufficient to capture the essential in-
formation needed for the classification of PD, while
maintaining a balance between accuracy and effi-
ciency. The ten selected features, frequently iden-
tified as relevant by ReliefF, were used as classi-
fiers inputs. During iterations of cross-validation,
we identified and selected the top ten highest-ranked
speech measures. This process was carried out for
the three configurations: single vowel /i:/, single
vowel /a:/, and descriptor fusion of both vowels /i:/
and /a:/. In the latter case, among all 140 de-
scriptors we retained the following: ’PLP-Coeff-2-
a’, ’rapJitter-a’, ’mfcc-1-i’, ’localJitter-a’, ’mfcc-2-i’,
’mfcc-delta-3-a’, ’ppq5Jitter-a’, ’localabsoluteJitter-
a’, ’mfcc-delta2-1-i’, and ’mfcc-3-a’. Note that fea-
tures selected from the descriptor fusion of the two
Figure 4: Boxplot of SVM and RF classification accuracy.
vowels include descriptors identified during the sep-
arate analysis of each vowel. This shows that some
important information is found in each analysis, con-
firming the relevance of both vowels.
4.2 Classification Results
In this section, we aim to evaluate the performance
of the classification algorithms on our data, using the
extracted vocal features, and to present the results ob-
tained from the fusion of the descriptors of the sus-
tained vowels /a:/ and /i:/.
4.2.1 Results without FS
Classification based on the fusion of the two vow-
els’ descriptors, without using the FS method showed
promising results (cf. Fig. 4). Models’ performance is
detailed in Table 1. The DT yields suboptimal results,
with an accuracy of 63.75% ± 15.16 and a F1 score of
63.50%. However, the SVM classifier stands out as
the best model with an accuracy of 73.50%, indicat-
ing its ability to extract and classify the PD voice well
even in the presence of redundant descriptors.
The results with the separate vowels are lower
than those obtained with the fusion. However, the
performance boost observed with the fusion was at-
tenuated by the redundancy between descriptors and
the increased size of the feature vector after fusion.
Thus, the gain observed during fusion was offset by
the large size of feature vector.
5 CONCLUSIONS
5.0.1 Results with ReliefF
We observe from the boxplots on Fig. 4, a clear im-
provement in classification performance after apply-
Automatic Classification of Parkinson’s Disease Through the Fusion of Sustained Vowel Descriptors
883

Table 1: Classification performance with vowels’ descrip-
tors fusion and without FS: Means and Standard deviations.
Acc. (%) Prec. (%) Sens. (%) F1-sc. (%)
KNN 66.50 64.42 76.00 68.85
± 9.23 ± 9.12 ± 16.55 ± 10.33
DT 63.50 64.95 59.00 61.39
± 13.24 ± 15.63 ± 16.09 ± 15.07
SVM 73.50 76.86 70.50 71.57
± 11.52 ± 13.64 ± 20.12 ± 14.31
RF 70.25 72.85 66.50 68.52
± 9.55 ± 11.49 ± 15.26 ± 11.47
GB 68.50 68.55 70.00 68.45
± 10.62 ± 10.68 ± 16.12 ± 11.56
Table 2: Classification performance with vowels’ descrip-
tors fusion and with FS: Means and Standard deviations.
Acc. (%) Prec. (%) Sens. (%) F1-sc. (%)
KNN 79.60 80.14 79.30 79.32
± 12.04 ± 12.16 ± 16.03 ± 13.11
DT 76.40 78.88 72.45 74.80
± 11.04 ± 12.94 ± 14.15 ± 11.95
SVM 84.70 89.08 77.35 82.40
± 8.02 ± 9.59 ± 14.71 ± 9.50
RF 82.60 83.96 79.30 81.10
± 10.00 ± 9.60 ± 15.07 ± 12.14
GB 80.50 79.20 83.20 81.14
± 9.89 ± 9.64 ± 13.63 ± 10.71
ing the ReliefF method for all the 3 configurations,
with and without fusion. The improvement in classi-
fication rates on the boxplots, with larger values and
higher medians, confirms the crucial role of FS tech-
niques in improving classification results. For clarity,
we have chosen to illustrate only the performance of
the two best models, SVM and RF, in Fig. 4.
According to Fig. 4 and Table 2, fusion results
demonstrate a clear improvement in classification per-
formance compared to those obtained from each sin-
gle vowel. The SVM model stands out as the best
one, showing the highest accuracy and precision rates.
It also presents the best F1-score, illustrating a good
balance between accuracy and sensitivity. RF stands
out as the second best classifier, with the best sensitiv-
ity rate showing its ability to correctly identify posi-
tive cases. DT shows the weakest performance for all
metrics.
When comparing Tables 1 and 2, it is evident that
FS has significantly enhanced the performance of the
models in the case of vowel fusion. By reducing the
size of the feature vector, the models are no longer
burdened by the complexity linked to the large num-
ber of descriptors. Consequently, the combination of
vowel fusion and FS has improved the algorithms’
performance, yielding notable score gains across all
five models, with improvements of up to 13%.
The aim of this study is to demonstrate the rel-
evance of combining descriptors extracted from two
vowels, instead of a single one, as is most commonly
done, while developing a robust model. To get the
most out of this approach, it was relevant to combine
it with a FS method. The obtained results, with fusion
accuracy scores around 85%, demonstrate the effec-
tiveness of this approach. Our work explored the per-
formance of five different ML models using the fusion
of vocal features extracted from two sustained vow-
els, /a:/ and /i:/, to detect PD vocal alterations. Clas-
sification results show that the fusion of descriptors
significantly outperforms single-vowel-based analy-
ses. Among the tested models, SVM was found to
be the best performer.
Although this study provides promising results
regarding descriptor fusion, it has some limitations.
Using a larger database and additional vowels could
strengthen the models robustness and improve the ac-
curacy. Further exploration of other vocal features,
such as prosody (text reading, continuous speech),
could allow a more complete and precise analysis.
In future research, we will explore the five vowels of
the PC-GITA database and test other feature selection
techniques to identify the most relevant vocal descrip-
tors. We also aim to increase the number of vocal fea-
tures selected during the fusion process to 15 or even
20. The goal is to analyze the contribution of each
vowel to the classification of PD dysphonia and to val-
idate the proposed approach on additional datasets to
evaluate its generalizability.
ACKNOWLEDGEMENTS
We express our gratitude to Prof. Orozco-Arroyave
for providing the database used in this study.
This research was supported by the Hubert Curien
Partnership ’Utique,’ funded by the French Ministry
of Europe and Foreign Affairs and the Tunisian Min-
istry of Higher Education and Scientific Research.
REFERENCES
Armstrong, M. J. and Okun, M. S. (2020). Diagnosis and
treatment of Parkinson’s disease: a review. JAMA.
Bhat, S., Acharya, U. R., Hagiwara, Y., Dadmehr, N., and
Adeli, H. (2018). Parkinson’s disease: Cause factors,
measurable indicators, and early diagnosis. Comput-
ers in Biology and Medicine.
Bhattacharjee, T., Belur, Y., Nalini, A., Yadav, R., and
Ghosh, P. (2023). Exploring the Role of Fricatives in
Classifying Healthy Subjects and Patients with Amy-
otrophic Lateral Sclerosis and Parkinson’s Disease. In
ICASSP.
BIOSIGNALS 2025 - 18th International Conference on Bio-inspired Systems and Signal Processing
884

Bol
´
on-Canedo, V., S
´
anchez-Maro
˜
no, N., and Alonso-
Betanzos, A. (2013). A review of feature selection
methods on synthetic data. Knowledge and Informa-
tion Systems.
Bouagina, S., Naouara, M., Hafsi, S., and Djaziri-Larbi, S.
(2023). MFCC-Based Analysis of Vibratory Anoma-
lies in Parkinson’s Disease Detection using Sustained
Vowels. In AMCAI.
Das, R. (2010). A comparison of multiple classification
methods for diagnosis of Parkinson disease. Expert
Systems with Applications.
Dave, N. (2013). Feature Extraction Methods LPC, PLP
and MFCC In Speech Recognition.
Galaz, Z., Mekyska, J., Mzourek, Z., Smekal, Z., Rek-
torova, I., Eliasova, I., Kostalova, M., Mrackova, M.,
and Berankova, D. (2016). Prosodic analysis of neu-
tral, stress-modified and rhymed speech in patients
with Parkinson’s disease. Computer methods and pro-
grams in biomedicine.
Gore, S. M., Salunke, M. M., Patil, S. A., and Kemalkar, A.
(2020). Disease detection using voice analysis. IR-
JET.
Guyon, I. and Elisseeff, A. (2003). An introduction to vari-
able and feature selection. JMLR.
Harel, B., Cannizzaro, M., and Snyder, P. J. (2004). Vari-
ability in fundamental frequency during speech in pro-
dromal and incipient Parkinson’s disease: a longitudi-
nal case study. Brain and Cognition.
Hariharan, M., Polat, K., and Sindhu, R. (2014). A new
hybrid intelligent system for accurate detection of
Parkinson’s disease. Computer Methods and Pro-
grams in Biomedicine.
Hlavnicka, J., Cmejla, R., Klempir, J., Ruzivka, E., and
Rusz, J. (2019). Acoustic tracking of pitch, modal,
and subharmonic vibrations of vocal folds in Parkin-
son’s disease and Parkinsonism. IEEE Access.
Ho, A. K., Iansek, R., Marigliani, C., Bradshaw, J. L., and
Gates, S. (1998). Speech impairment in a large sam-
ple of patients with Parkinson’s disease. Behavioural
Neurology.
Islam, R., Abdel-Raheem, E., and Tarique, M. (2023).
Parkinson’s Disease Detection Using Voice Features
and Machine Learning Algorithms.
Jadoul, Y., Thompson, B., and de Boer, B. (2018). Introduc-
ing Parselmouth: A Python interface to Praat. Journal
of Phonetics.
Jafari, A. (2013). Classification of parkinson’s disease
patients using nonlinear phonetic features and mel-
frequency cepstral analysis. BME.
Jeancolas, L., Petrovska-Delacr
´
etaz, D., Leh
´
ericy, S., Be-
nali, H., and Benkelfat, B. (2016). Voice analysis as
a tool for early diagnosis of parkinson’s disease: state
of the art. In CORESA.
Little, M., Mcsharry, P., Roberts, S., Costello, D., and Mo-
roz, I. (2007). Exploiting nonlinear recurrence and
fractal scaling properties for voice disorder detection.
Biomedical engineering online.
Little, M. A., McSharry, P. E., Hunter, E. J., Spielman, J.,
and Ramig, L. O. (2009). Suitability of dysphonia
measurements for telemonitoring of Parkinson’s dis-
ease. IEEE TBME.
McFee, B., Raffel, C., Liang, D., Ellis, D., McVicar, M.,
Battenberg, E., and Nieto, O. (2015). librosa: Audio
and Music Signal Analysis in Python.
Mei, J., Desrosiers, C., and Frasnelli, J. (2021). Machine
learning for the diagnosis of Parkinson’s disease: a
review of literature. Frontiers in aging neuroscience.
Naranjo, L., Perez, C. J., Campos-Roca, Y., and Martin, J.
(2016). Addressing voice recording replications for
Parkinson’s disease detection. Expert Systems with
Applications.
Orozco-Arroyave, J. R., Arias-Londo
˜
no, J. D., Vargas-
Bonilla, J. F., Gonz
´
alez-R
´
ativa, M. C., and N
¨
oth, E.
(2014). New Spanish speech corpus database for the
analysis of people suffering from Parkinson’s disease.
In LREC.
Orozco-Arroyave, J. R., Arias-Londo
˜
no, J. D., Vargas-
Bonilla, J. F., and N
¨
oth, E. (2013). Analysis of Speech
from People with Parkinson’s Disease through Non-
linear Dynamics. In Advances in Nonlinear Speech
Processing.
Pah, N. D., Motin, M. A., and Kumar, D. K. (2022).
Phonemes based detection of Parkinson’s disease for
telehealth applications. Scientific Reports.
Rosario, S. F. and Thangadurai, K. (2015). RELIEF: Fea-
ture Selection Approach. IJIRD.
Sakar, B. E., Isenkul, M. E., Sakar, C. O., Sertbas, A., Gur-
gen, F., Delil, S., Apaydin, H., and Kursun, O. (2013).
Collection and analysis of a Parkinson speech dataset
with multiple types of sound recordings. IEEE JBHI.
Sakar, C. O. and Kursun, O. (2010). Telediagnosis of
Parkinson’s disease using measurements of dyspho-
nia. Journal of Medical Systems.
Tsanas, A., Little, M., McSharry, P., Spielman, J., and
Ramig, L. (2012). Novel speech signal processing
algorithms for high-accuracy classification of Parkin-
son’s disease. IEEE TBME.
Urbanowicz, R. J., Meeker, M., La Cava, W., Olson, R. S.,
and Moore, J. H. (2018). Relief-based feature selec-
tion: Introduction and review. JBI.
Villa-Ca
˜
nas, T., Orozco-Arroyave, J. R., Vargas-Bonilla,
J. F., and Arias-Londo
˜
no, J. D. (2014). Modulation
spectra for automatic detection of Parkinson’s disease.
In STSIVA.
Automatic Classification of Parkinson’s Disease Through the Fusion of Sustained Vowel Descriptors
885
