
Herbicide Efficacy Prediction Based on Object Segmentation of
Glasshouse Imagery
Majedaldein Almahasneh
1,∗ a
, Baihua Li
1 b
, Haibin Cai
1 c
, Nasir Rajabi
2 d
,
Laura Davies
2 e
and Qinggang Meng
1 f
1
Department of Computer Science, Loughborough University, Loughborough, U.K.
2
Moa Technology, Oxford, U.K.
Keywords:
Deep Learning, Semantic Segmentation, Object Detection, Herbicide Efficacy, Machine Learning in
Agriculture.
Abstract:
In this work, we explore the possibility of incorporating deep learning (DL) to propose a solution for the her-
bicidal efficacy prediction problem based on glasshouse (GH) images. Our approach utilises RGB images of
treated and control plant images to perform the analysis and operates in three stages, 1) plant region detection
and 2) leaf segmentation, where growth characteristics are inferred about the tested plant, and 3) herbicide ac-
tivity estimation stage, where these metrics are used to estimate the herbicidal activity in a contrastive manner.
The model shows a desirable performance across different species and activity levels, with a mean F1-score
of 0.950. These results demonstrate the reliability and promising potential of our framework as a solution for
herbicide efficacy prediction based on glasshouse images. We also present a semi-automatic plant labelling
approach to address the lack of available public datasets for our target task. While existing works focus on
plant detection and phenotyping, to the best of our knowledge, our work is the first to tackle the prediction of
herbicide activity from GH images using DL.
1 INTRODUCTION
Weeds are commonly defined as unwanted plants that
compete with desirable plants and crops for resources
(WSSA, 2024), including water and nutritions. This
competition can negatively impact the agricultural
productivity levels and cause crop yield losses up
to 34% if left with no proper intervention (OERKE,
2006). The appropriate implementation of chemical
herbicides and other weed control methods can re-
duce these losses to 5-20% (OERKE, 2006), yet this
still results in global grain yield losses of 200million
tonnes per year (Chauhan, 2020). Herbicide discov-
ery has thus become a critical element of modern agri-
culture, aiming to enable efficient weed management
and crop security.
However, herbicidal resistance has recently been
identified in 273 different weed species across vari-
a
https://orcid.org/0000-0002-5748-1760
b
https://orcid.org/0000-0002-4930-7690
c
https://orcid.org/0000-0002-2759-3665
d
https://orcid.org/0000-0001-5623-797X
e
https://orcid.org/0000-0001-7653-9908
f
https://orcid.org/0000-0002-9483-5724
∗
Corresponding author
ous modes of action (Heap, 2024). Herbicide resis-
tance not only threatens crop yields but also costs
the agricultural economy billions of dollars a year,
with annual losses to herbicide resistant blackgrass
(Alopecurus myosuroides) in the UK estimated to be
$500million per annum (Varah et al., 2020), and weed
losses of $3.3billion in Australia and $11billion in the
USA (Chauhan, 2020). This rising resistance threat-
ens the reliability of traditional herbicides, posing a
serious challenge to sustainable crop production, in-
creasing the demand for new herbicide modes of ac-
tion that can overcome these resistance mechanisms.
Current approaches incorporate high-throughput
screening of chemical libraries to identify effective
herbicidal compounds. This approach, however, re-
lies on manually evaluating and reporting the phy-
totoxicity of the tested compound through observa-
tions of growth extent, symptoms, and any damage
observed at the time of testing. This process is there-
fore inherently labor-intensive and subjective, relying
heavily on the expertise and the judgment of the per-
son conducting the analysis. Moreover, the time re-
quired to conduct such analysis restricts the feasibil-
ity of large-scale testing, thereby hindering the rapid
identification of new compounds and modes of action
in a high-throughput manner.
Almahasneh, M., Li, B., Cai, H., Rajabi, N., Davies, L. and Meng, Q.
Herbicide Efficacy Prediction Based on Object Segmentation of Glasshouse Imagery.
DOI: 10.5220/0013157000003912
Paper published under CC license (CC BY-NC-ND 4.0)
In Proceedings of the 20th International Joint Conference on Computer Vision, Imaging and Computer Graphics Theory and Applications (VISIGRAPP 2025) - Volume 2: VISAPP, pages
375-382
ISBN: 978-989-758-728-3; ISSN: 2184-4321
Proceedings Copyright © 2025 by SCITEPRESS – Science and Technology Publications, Lda.
375

These challenges create an increasing need for
tools to automate and improve the effectiveness and
accuracy of compound phytotoxicity testing. Exist-
ing works focus on the application of weed detec-
tion, typically formulating the problem as an image
level classification task, e.g. (Jin et al., 2022a; Jin
et al., 2022b), or as an object detection task, e.g.,
(Junior and Alfredo C. Ulson, 2021; Bhargava et al.,
2024). Other works focused on plant phenotyping and
growth tracking (Chaudhury et al., 2019; Spalding
and Miller, 2013) and leaf pathology detection, e.g.,
(Chouhan et al., 2019; Dhingra et al., 2019; Bhargava
et al., 2024). To our knowledge, the problem of fore-
casting herbicide efficacy based on glasshouse images
has not been addressed in the literature, making our
work the first to approach this problem.
Modern object detectors use CNNs (e.g., ResNet
and VGG) to extract task-driven features for detec-
tion. These are generally split into two paradigms,
single stage detectors, where images are divided into
a grid to predict bounding box and class probabilities
for each cell simultaneously, e.g., YOLO (Redmon
et al., 2016) and SSD (Liu et al., 2016), and two stage
detectors, where region proposal networks (RPNs) are
used to produce a high number of candidate regions in
the first stage before the final classification in the sec-
ond stage, e.g., RCNN family (Ren et al., 2015; Lin
et al., 2017).
On the other hand, CNN based segmentation
methods may be generally split into semantic seg-
mentation where all objects of a specific class are
treated as a single entity, such as UNet (Ronneberger
et al., 2015) and DeepLabv3+ (Chen et al., 2017), and
instance segmentation, which distinguishes between
different instances of the same class, such as Mask
RCNN (He et al., 2017) and YOLOAct (Bolya et al.,
2019).
These advancements have laid the foundation for
accurate object segmentation. However, the effective-
ness of these methods varies depending on the specific
context and application. Selecting the appropriate ap-
proach is therefore dependent on the specific require-
ments and constraints of the target task.
In this work we explore the possibility of incor-
porating these DL advancements within the task of
compound efficacy prediction, we propose a CNN-
based methodology to estimate compound activity
from glasshouse images. Our approach operates in
three stages: 1) Plant region detection, to identify
plant species and location of the plant in the tested
image. 2) Plant leaves segmentation, to accurately ex-
tracts critical plant features necessary for the next step
in efficacy evaluation. 3) Compound efficacy classi-
fication, to categorize compound efficacy into three
Table 1: Summary of labelled images across activity levels
and plant species. Brackets represent the validation split.
species active moderate inactive total
LOLMU 123 (29) 1256 (32) 50 (29) 1429 (90)
ECHCG 370 (30) 670 (31) 286 (29) 1326 (90)
AMARE 658 (32) 1003 (28) 294 (30) 1955 (90)
VERPE 626 (30) 278 (29) 1010 (31) 1914 (90)
levels of activity: highly active, moderately active,
and inactive, using a contrastive analysis. Due to the
lack of adequate public datasets for our target task, we
also introduce a semi-automatic labelling approach to
prepare data for our experiments.
2 DATA
Our dataset comprises four prevalent weed species
that commonly pose significant challenges to crop
management, namely, LOLMU (Lolium Multiflo-
rum), ECHCG (Echinochloa Crus-galli) AMARE
(Amaranthus Retroflexus), VERPE (Veronica Per-
sica). These can be split into two categories, broadleaf
(AMARE and VERPE) and grass weeds (LOLMU
and ECHCG). Images are collected as a part of her-
bicide trials in glasshouse settings, in which herbi-
cides of interest are examined for their growth inhi-
bition efficacy. Trials are carried by spraying various
compounds on different weed species to assess their
impact on plant growth. Each sample consists of a
potted plant of a certain species and a specific com-
pound applied to it. The phytotoxic herbicide effect
of compounds is visually measured and images taken
a set number of days after application to allow time
for herbicide symptoms to become apparent. Trial
reports include metadata such as species type and a
growth inhibition score, i.e., active (significant inhi-
bition), moderate (partial inhibition), or inactive (no
notable inhibition), as well as images of the treated
plant (target) and the untreated plant (negative con-
trol) are provided for comparison.
A summary of datasets across different species
types and compound activity levels is presented in Ta-
ble 1 and Figure 2. Section 3 provides a detailed de-
scription of our data annotation procedure.
3 METHODOLOGY
Our methodology for determining compound efficacy
relies on assessing the negative correlation between
plant growth and herbicide potency. Specifically, an
effective herbicide results in no plant growth or no
living plant matter. Accordingly, by measuring the
degree of plant growth, we can infer the herbicide’s
VISAPP 2025 - 20th International Conference on Computer Vision Theory and Applications
376
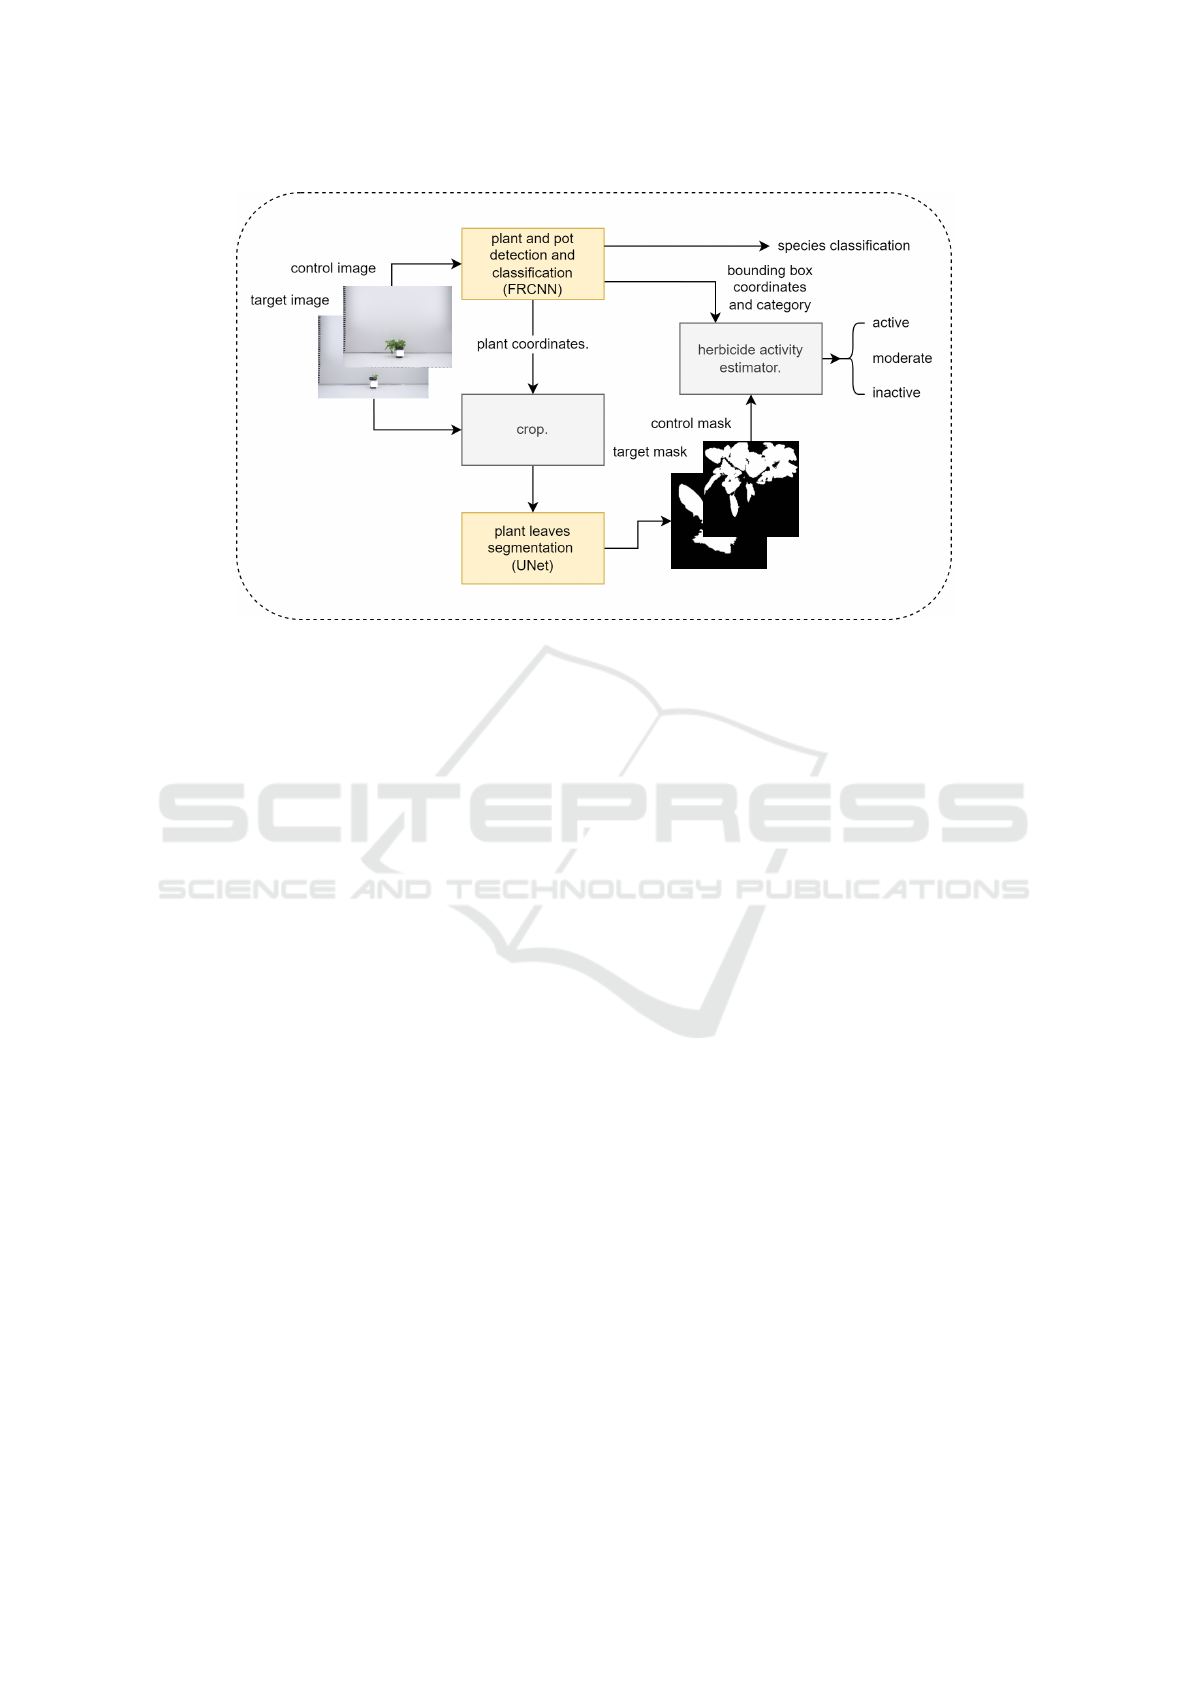
Figure 1: Flowchart of the proposed herbicide efficacy prediction pipeline. Input images are processed by our detection and
segmentation blocks to extract the metrics needed to calculate the efficacy in the following stage. Based on that, the activity
estimator classifies the tested herbicide into 3 activity levels.
potency. To achieve that, we first analyse images of
both the herbicide-treated plant and the untreated neg-
ative control, then evaluate their relative growth in
contrastive manner to assess the efficacy of the ap-
plied herbicide.
This analysis is conducted in 3 stages, namely:
1) Plant and pot detection (bounding box) to identify
plant species and extract both the plant and pot re-
gions, reducing complexity and irrelevant background
noise that may interfere with subsequent analysis. 2)
plant leaves segmentation, to precisely extract rele-
vant plant features essential for subsequent efficacy
evaluation. 3) In the final stage, we leverage the data
obtained from the previous stages to classify com-
pound efficacy into 3 categories, highly active, mod-
erately activity, and inactive.
Semi-Automated Labelling. The lack of suitable
public datasets for our task necessitates the creation
of a custom dataset tailored specifically for our needs,
including bounding box and pixel-wise localization
labels. However, manual labelling is time-consuming
and requires a significant manual labour , particularly
pixel-wise annotations when objects of interest are of
complex morphology, e.g., weeds. Thus, we develop
a semi-automated labelling process where we utilise
bounding boxes and colour priors to produce pixel-
wise annotations for our plant dataset.
We start by manually annotating the images with
bounding boxes for both plant region localization and
species classification tasks. Each image is assigned
two bounding boxes, one enclosing the visible plant
matter (leaves) and another for the pot area. These
bounding boxes are then used to generate segmen-
tation labels for the plant region. We start by crop-
ping the plant area using the bounding boxes prior,
thereby minimizing interference from irrelevant im-
age parts and background noise. The cropped image
then undergoes histogram equalization to correct un-
even illumination, making plant features easier to ex-
tract in the following steps. Utilizing the characteris-
tic green hue of plant leaves and the uniform white
background, a threshold-based technique is applied
in the HSV colour space to distinguish green regions
from the background. The thresholds are determined
empirically to optimally capture the green shades typ-
ical in plant leafage. Similar approaches were shown
to be effective in detecting crop matter, e.g., (Hamuda
et al., 2017).
Lastly, the resulting mask is refined using mor-
phological closing (erosion followed by dilation) with
a 5x5 kernel. This process removes any remaining
small regions and merges disjointed parts, creating the
final segmentation mask. The generated segmentation
masks were manually validated by a plant biology ex-
pert, discarding or adjusting defective masks where
necessary. A summary of the labelled training and
validation datasets is presented in Table 1 and Figure
2.
Plant Species and Pot Detection. For the detec-
tion component in our framework, we utilise Faster
R-CNN to identify and localize the plant species and
pot regions within the image. This step is crucial as
the compound efficacy prediction is dependent upon
the specific plant being analysed. Moreover, the lack
Herbicide Efficacy Prediction Based on Object Segmentation of Glasshouse Imagery
377
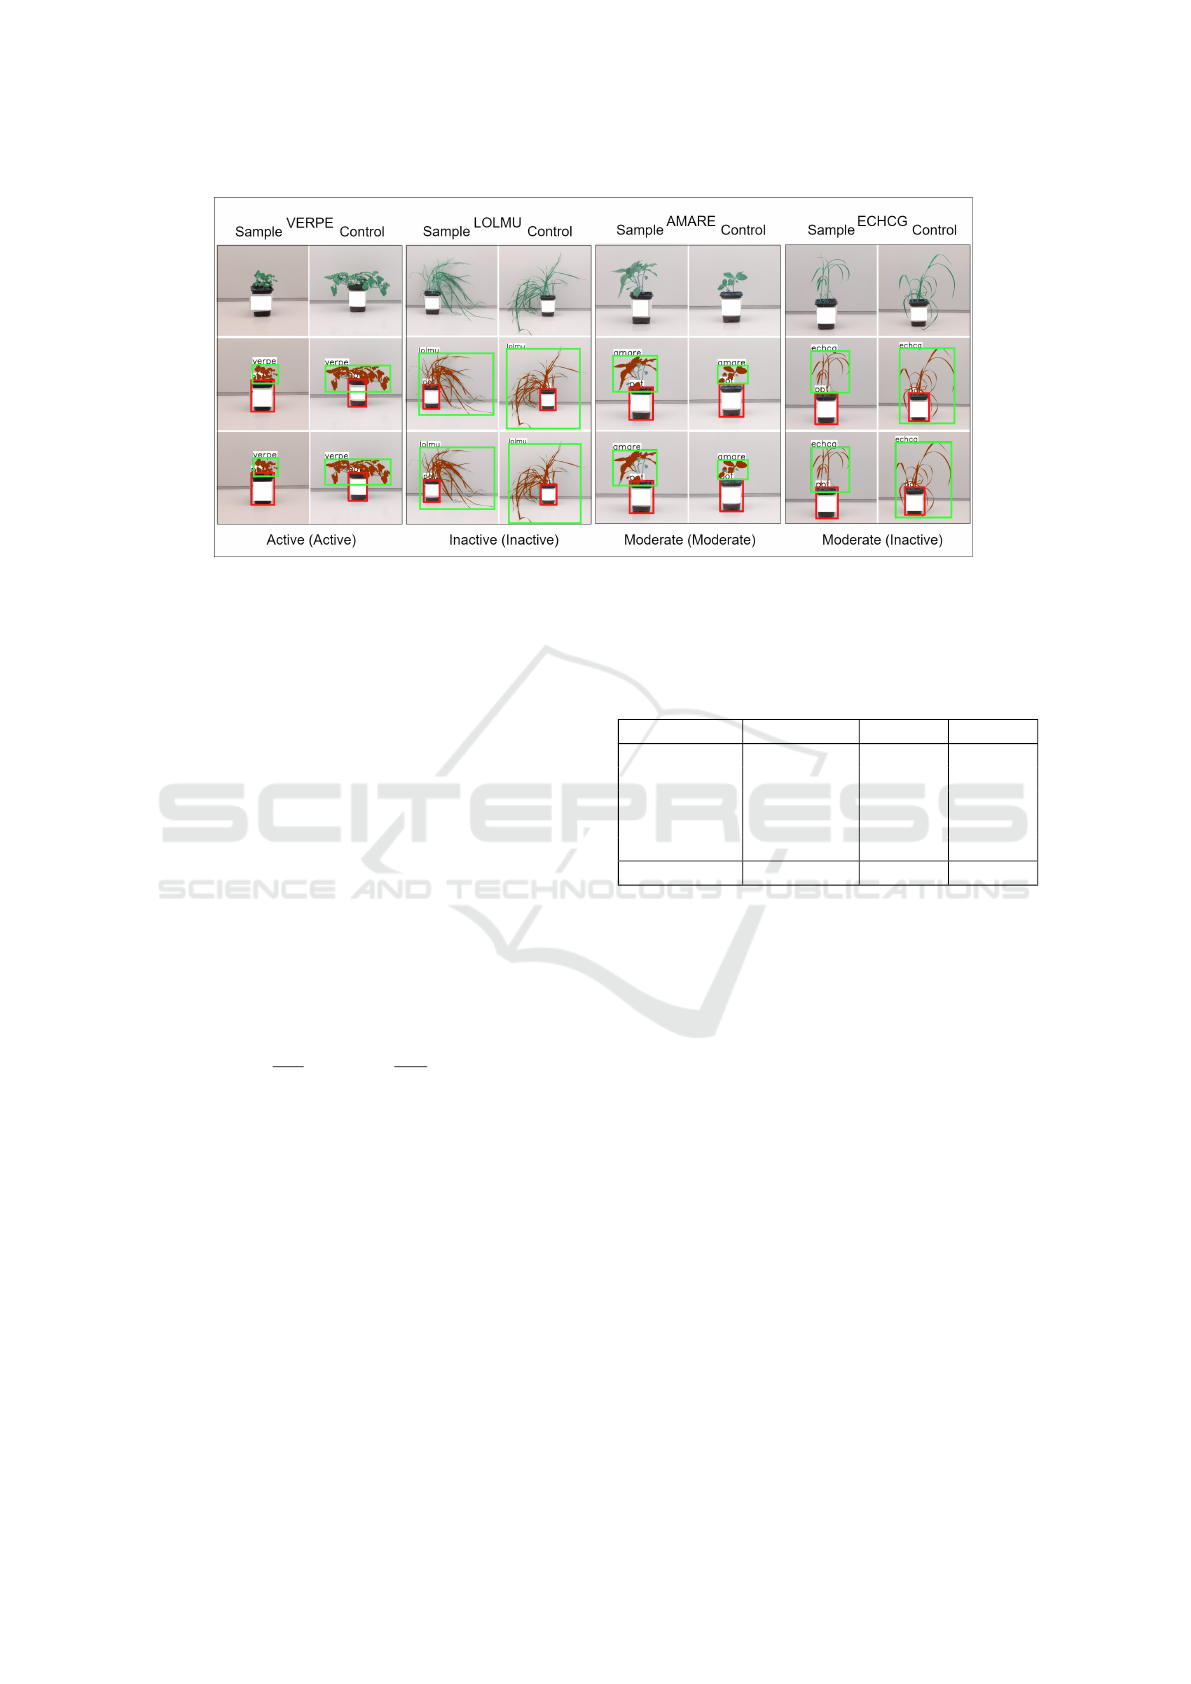
Figure 2: Example cases showing target and control samples across different species (VERPE, LOLMU, AMARE, and
ECHCG). Each case consists of 2 columns (treated sample and control images) and 3 rows: input image (top), ground
truth (middle), predicted bounding box and segmentation masks (bottom). Note that images in this figure are cropped for
visualization purposes.
of pot segmentation annotations necessitates the de-
tection of the pot’s region in the form of bounding
box to enable the estimation of the pot area which is
required for subsequent analyses.
Extending on the standard Faster RCNN, our
framework utilizes the feature pyramid network
(FPN) architecture as the neck module of our feature
extraction CNN. This enhances the network’s ability
to capture objects of various sizes by generating a hi-
erarchical feature maps of multiple resolutions (Lin
et al., 2017). We initialize our model with COCO (Lin
et al., 2014) pre-trained weights to improve its gener-
alizability. We use the combined regression and clas-
sification loss to train our bounding box regression
and classification heads across the detection stages,
as follows:
L =
1
N
cls
∑
L
cls
+ λ
1
N
reg
∑
L
reg
where (L
reg
) and (L
cls
) are Smooth L1 and Cross En-
tropy, respectively, N
cls
number of region proposals,
N
reg
is the number of positive region proposals, and λ
is the weight balancing classification and regression
losses.
To assist the network in capturing regions of var-
ious sizes, we use anchors with aspect ratios of 0.5,
1.0, and 2.0, a base scale of 8, and strides of 4, 8, 16,
32, and 64 (Ren et al., 2015). We use default Non-
maximum suppression IoU thresholds of 0.7 and 0.5
for the RPN and the detection heads, respectively.
Leaves Segmentation. Starting with the bounding
box prior predicted during the detection step, plant
regions are extracted (cropped) from the input image
and utilized in the segmentation phase to predict the
Table 2: mAP scores for the detection stage across pot and
weed species over different IoU thresholds.
Category mAP50:95 mAP50 mAP75
Pot 0.939 0.997 0.997
LOLMU 0.880 0.967 0.946
ECHCG 0.839 0.938 0.866
AMARE 0.754 0.944 0.826
VERPE 0.831 0.921 0.880
Mean score 0.849 0.953 0.903
pixel-level locations of the plant leaves. This is done
for both the target sample and the negative control im-
ages. By isolating the background and pot pixels from
the leaves’ region, we are able to evaluate the extent of
plant growth (area covered with leaves), which is vital
for the efficacy estimation process in the next phase.
To achieve that, we utilize UNet to segment the
target image into plant and background regions. We
also evaluate the more recent DeepLabv3+ segmen-
tation method in our experiment (Section 4). It is
important to note that in this phase, pot regions are
deemed background. In line with popular segmen-
tation frameworks, e.g., (Yao et al., 2024), our seg-
mentation block comprises 1) a contracting path (en-
coder) to extract and reduce the spatial dimensions
of the feature maps, 2) an expanding path (decoder)
that reconstructs high-resolution feature maps to al-
low pixel-wise classification at the original spatial di-
mension, and 3) skip connection to help the network
recover fine details and spatial information lost during
downsampling (Ronneberger et al., 2015).
To train our segmentation network, we use a
weighted cross entropy to assist the network combat
VISAPP 2025 - 20th International Conference on Computer Vision Theory and Applications
378

Figure 3: Confusion matrices for each of the different species (ECHCG, AMARE, LOLMU, and VERPE), illustrating the
classification performance across three compound activity classes: active, moderate, and inactive.
the class imbalance present in the data, where back-
ground pixels are more dominant than plant pixels in
our target images. We find that using the weights 1
and 2 for background and plant classes, respectively,
assists the network in detecting plant pixels more ac-
curately. Accordingly, our loss is computed as:
L = −
C
∑
c=1
w
c
· y
c
· log(p
c
)
where C is the number of classes, y
c
is the ground
truth for class c. p
c
is the predicted probability that
the pixel belongs to class c, and w
c
is the weight as-
signed to class c.
Herbicide Efficacy Prediction. Building on
the previous blocks, the detection and segmentation
stages, we estimate the compound efficacy based on
the relative growth of the target sample, of which the
compound of interest is applied to, with respect to
negative control image, of which no treatment was ap-
plied to. More intuitively, we evaluate the impact of
the compound application by comparing the extent of
growth in the target sample to that in the negative con-
trol. Accordingly, target samples that observe growth
similar to or greater than the reference negative con-
trol indicate inactive compounds. Cases where targets
show less growth compared to controls indicate com-
pound activity.
Starting from the species classification, the pre-
dicted mask of plant leaves, and the pot bounding box
coordinates priors predicted in previous steps for both
the target sample and the negative control images, we
compute the area of leaves as the sum of the positive
pixels and the pot area as the area of the enclosing
bounding box.
Due to variations in the distance between the cam-
era sensor and the plant during image acquisition, di-
rectly using the plant area from the mask can be un-
reliable. This inconsistency affects the perceived size
of the plant in the image, e.g., plants that are posi-
tioned farther from the camera appear smaller, which
leads to underestimating the leaves area. To address
this issue, we normalize the calculated leaf area by the
area of the pot, which serves as a consistent reference
object. Note that the pot is always of fixed dimen-
sions and in proximity to the plant within a trial. This
normalization process provides a more objective and
comparable measure of plant growth across different
images. In the remainder of this paper, we refer to this
value as the plant-to-pot ratio.
In the following step, we evaluate the relative
growth of the target sample with respect to the neg-
ative control. To do that, we find the target-to-control
ratio by dividing the plant-to-pot ratio of the target
sample by that of the negative control sample. This
describes the extent of growth observed in the tar-
get sample in contrast to the control plant, indicating
the comparative growth relationship between the two.
This normalization is also important to avoid incon-
sistencies that could be caused by the use of differ-
ent pot sizes in different trials. Finally, the measured
target-to-control growth ratio is used to determine the
compound’s activity level by comparing it against a
species-specific threshold. Based on this evaluation,
compounds are classified into three categories, i.e.,
active (strong activity observed), moderate (moderate
activity), or inactive (no significant activity).
More formally, Given M
plant
and B
pot
, where
M
plant
is the binary mask for the plant region (pre-
dicted by our segmentation block), and B
pot
is the
bounding box enclosing the pot region (predicted by
our detection block). The area of the plant, A
p
, is
computed as A
plant
=
∑
M
plant
, where the sum is over
all plant pixels in the mask. The area of the pot, A
pot
,
is determined from the pot bounding box dimensions,
i.e., A
pot
= w × h where w and height h are the width
and height of B
pot
. For each, the target sample and
control image, we calculate the plant-to-pot ratio as
follows:
R =
A
plant
A
pot
where R
target
is the ratio for the target sample and
R
control
for the control sample.
Accordingly, the efficacy E is defined as:
E =
R
target
R
control
Herbicide Efficacy Prediction Based on Object Segmentation of Glasshouse Imagery
379

Finally, we evaluate the efficacy E against a categor-
ical threshold (i.e., T
active
, T
moderate
, and T
inactive
) to
classify the compound activity level as follows:
activity =
Inactive if E > T
inactive
Moderate if T
moderate
< E ≤ T
inactive
Active if E ≤ T
moderate
Threshold values were optimized and validated by
a plant biology expert to best reflect the compound
activity classification criterion within our application.
In instances where no plant is detected in the target
sample image, it is presumed that the plant does not
exist (i.e., no growth observed), and the leaf area is set
to zero. This typically occurs in cases where plants
are treated with a highly active compound (resulting
in minimal to no growth). In the same line, we use
the species category predicted for the negative control
image to evaluate the activity. This approach is useful
particularly when the target sample image shows min-
imal leaf development, making it difficult to classify
the species accurately. On the other hand, negative
controls consistently exhibit a fully developed plant,
making them appropriate for the task.
4 EXPERIMENTS
All experiments were implemented using PyTorch on
an NVIDIA RTX A4000 16GB GPU. For the detec-
tion stage, we used the SGD optimizer (Bottou, 2010)
with a learning rate (LR) of 5× 10
−3
and an input size
1333x800px. For the segmentation stage, we used
RMSprop (Hinton, 2012) with an LR of 1 ×10
−5
, and
an input size of 512x512px.
Detection Stage. For the bounding box detec-
tion stage, we compute the mean Average Precision
(mAP) score for each species, and the Pot class, at
different intersection over Union (IoU) thresholds.
Generally, our detection stage shows desirable perfor-
mance, with a mean mAP of 0.849, 0.953, and 0.903
at mAP0.5:0.95, mAP0.5, mAP0.75, IoU thresholds,
respectively, across all classes. See Table 2. We ob-
serve that grass species (LOLMU and ECHCG) ex-
hibit better performance when compared to broadleaf
species (AMARE and VERPE), whith ECHCG being
the highest. Overall, these results demonstrate desir-
able performance of the detection module as the foun-
dational block of our efficacy prediction framework,
confirming its suitability for our intended application.
See Figure 2.
Segmentation Stage. Moreover, for our plant leaf
segmentation stage, we find that UNet produces the
highest IoU score when compared to DeepLabv3+,
Table 3: Performance metrics for compound activity classi-
fication across the different species.
LOLMU
Activity Category Recall Precision F1-score
Active 0.93 0.96 0.95
Moderate 0.91 0.94 0.92
Inactive 1.00 0.94 0.97
Mean score 0.95 0.95 0.94
ECHCG
Activity Category Recall Precision F1-score
Active 0.93 1.00 0.97
Moderate 1.00 0.94 0.97
Inactive 1.00 1.00 1.00
Mean score 0.98 0.98 0.98
AMARE
Activity Category Recall Precision F1-score
Active 1.00 1.00 1.00
Moderate 0.93 0.93 0.93
Inactive 0.94 0.94 0.94
Mean score 0.96 0.96 0.96
VERPE
Activity Category Recall Precision F1-score
Active 1.00 0.91 0.96
Moderate 0.89 0.89 0.89
Inactive 0.87 0.96 0.91
Mean score 0.92 0.92 0.92
Overall
Mean score 0.952 0.952 0.950
scoring an IoU of 0.889 for the plant category, com-
pared to DeepLabv3+ at 0.863 IoU score. This is
in line with the design principles of UNet, which
was created to be effective and efficient for smaller
datasets while the design of DeepLabv3+ targets ef-
fective segmentation for large-scale datasets and com-
plex segmentation tasks like those in natural scene im-
ages.
Generally, the segmentation performance is satis-
factory for our application and we therefore continue
using this architecture for the remainder of our exper-
iment. Visual results are presented in Figure 2.
Herbicide Efficacy Prediction Stage. We evaluate
our efficacy prediction stage by computing the recall,
precision, and F1-scores across different species cate-
gories and activity level classes. Results are presented
in Table 3. The model shows a desirable performance
across different species and activity levels, with mean
scores of 0.952, 0.952, and 0.950 for recall, precision,
and F1-score, respectively, across all species. The
model also shows a recall to precision balance across
all species and activity levels, which is crucial when
handling a wide rang of plant species.
When comparing performance across species cat-
egories, we notice that ECHCG constantly shows the
highest score amongst all species, with AMARE ob-
serving the second highest performance. On the other
hand, LOLMU and AMARE show a slightly lower
performance. These differences in results illustrate
the varying semantic complexity levels between the
VISAPP 2025 - 20th International Conference on Computer Vision Theory and Applications
380

species, and may be attributed to the distinct morphol-
ogy and characteristics of the different plants, making
some species easier to analyse than others. Figure 2
presents visualizations of different species and their
predicted activity classes.
Moreover, when comparing the performance
across different activity levels, we observe that the
model consistently performs better in predicting the
Active and Inactive classes compared to the Moder-
ate class, across all species. This is expected, as the
Moderate class encompasses a wider range of growth
conditions, ranging from cases close to the Inactive
categorical threshold (i.e., low growth and leaf area)
to those near the Active threshold (i.e., high growth
and leaf area), making it more challenging to classify
these cases. Figure 3 shows the confusion matrices
across different species and activity levels. These re-
sults demonstrate the reliability of our framework as
an effective solution for the herbicidal efficacy pre-
diction problem using glasshouse imagery.
5 CONCLUSION
We explored the task of herbicidal efficacy predic-
tion using glasshouse images and DL techniques. We
proposed a three-stage framework comprising species
detection, plant segmentation, and herbicide efficacy
prediction. Additionally, to address the lack of a suit-
able dataset for our target task, we develop and pro-
posed a semi-automatic plant labelling approach. Our
experiments demonstrate the reliability of the pro-
posed approach as an effective solution to this prob-
lem, leveraging DL to enhance consistency and effi-
ciency in contrast to manual assessment while main-
taining a desirable accuracy. To the best of our knowl-
edge, our work is the first to present a DL-based solu-
tion specifically targeting this challenge.
REFERENCES
Bhargava, A., Shukla, A., Goswami, O. P., Alsharif, M. H.,
Uthansakul, P., and Uthansakul, M. (2024). Plant leaf
disease detection, classification, and diagnosis using
computer vision and artificial intelligence: A review.
IEEE Access, 12:37443–37469.
Bolya, D., Zhou, C., Xiao, F., and Lee, Y. J. (2019). Yolact:
Real-time instance segmentation. In Proceedings of
the IEEE/CVF international conference on computer
vision, pages 9157–9166.
Bottou, L. (2010). Large-scale machine learning with
stochastic gradient descent. In Proceedings of
COMPSTAT’2010: 19th International Conference on
Computational StatisticsParis France, August 22-27,
2010 Keynote, Invited and Contributed Papers, pages
177–186. Springer.
Chaudhury, A., Ward, C., Talasaz, A., Ivanov, A. G., Bro-
phy, M., Grodzinski, B., H
¨
uner, N. P. A., Patel, R. V.,
and Barron, J. L. (2019). Machine vision system for
3d plant phenotyping. IEEE/ACM Transactions on
Computational Biology and Bioinformatics.
Chauhan, B. S. (2020). Grand challenges in weed manage-
ment.
Chen, L.-C., Papandreou, G., Kokkinos, I., Murphy, K., and
Yuille, A. L. (2017). Deeplab: Semantic image seg-
mentation with deep convolutional nets, atrous convo-
lution, and fully connected crfs. IEEE transactions on
pattern analysis and machine intelligence, 40(4):834–
848.
Chouhan, S. S., Kaul, A., and Singh, U. P. (2019). A deep
learning approach for the classification of diseased
plant leaf images. In 2019 International Conference
on Communication and Electronics Systems (ICCES),
pages 1168–1172.
Dhingra, G., Kumar, V., and Joshi, H. D. (2019). A novel
computer vision based neutrosophic approach for leaf
disease identification and classification. Measure-
ment, 135:782–794.
Hamuda, E., Mc Ginley, B., Glavin, M., and Jones, E.
(2017). Automatic crop detection under field condi-
tions using the hsv colour space and morphological
operations. Computers and electronics in agriculture,
133:97–107.
He, K., Gkioxari, G., Doll
´
ar, P., and Girshick, R. (2017).
Mask R-CNN. In Proceedings of the IEEE inter-
national conference on computer vision, pages 2961–
2969.
Heap, I. (2024). The international herbicide-resistant weed
database. Accessed: September 13, 2024.
Hinton, G. (2012). Neural networks for machine learning.
Lecture 6.5 - rmsprop: Divide the gradient by a run-
ning average of its recent magnitude.
Jin, X., Bagavathiannan, M., Maity, A., Chen, Y., and
Yu, J. (2022a). Deep learning for detecting herbicide
weed control spectrum in turfgrass. Plant Methods,
18(1):94.
Jin, X., Bagavathiannan, M., McCullough, P. E., Chen, Y.,
and Yu, J. (2022b). A deep learning-based method for
classification, detection, and localization of weeds in
turfgrass. Pest Management Science.
Junior, L. C. M. and Alfredo C. Ulson, J. (2021). Real time
weed detection using computer vision and deep learn-
ing. In 2021 14th IEEE International Conference
on Industry Applications (INDUSCON), pages 1131–
1137.
Lin, T.-Y., Doll
´
ar, P., Girshick, R., He, K., Hariharan, B.,
and Belongie, S. (2017). Feature pyramid networks
for object detection. In Proceedings of the IEEE con-
ference on computer vision and pattern recognition,
pages 2117–2125.
Lin, T.-Y., Maire, M., Belongie, S., Hays, J., Perona, P.,
Ramanan, D., Doll
´
ar, P., and Zitnick, C. L. (2014).
Microsoft coco: Common objects in context. In Com-
puter Vision–ECCV 2014: 13th European Confer-
Herbicide Efficacy Prediction Based on Object Segmentation of Glasshouse Imagery
381

ence, Zurich, Switzerland, September 6-12, 2014, Pro-
ceedings, Part V 13, pages 740–755. Springer.
Liu, W., Anguelov, D., Erhan, D., Szegedy, C., Reed, S.,
Fu, C.-Y., and Berg, A. C. (2016). Ssd: Single shot
multibox detector. In Computer Vision–ECCV 2016:
14th European Conference, Amsterdam, The Nether-
lands, October 11–14, 2016, Proceedings, Part I 14,
pages 21–37. Springer.
OERKE, E.-C. (2006). Crop losses to pests. The Journal
of Agricultural Science, 144(1):31–43.
Redmon, J., Divvala, S., Girshick, R., and Farhadi, A.
(2016). You only look once: Unified, real-time object
detection. In Proceedings of the IEEE conference on
computer vision and pattern recognition, pages 779–
788.
Ren, S., He, K., Girshick, R., and Sun, J. (2015). Faster
r-cnn: Towards real-time object detection with region
proposal networks. Advances in neural information
processing systems, 28.
Ronneberger, O., Fischer, P., and Brox, T. (2015). U-
Net: Convolutional networks for biomedical image
segmentation. In International Conference on Medi-
cal image computing and computer-assisted interven-
tion, pages 234–241. Springer.
Spalding, E. P. and Miller, N. D. (2013). Image analysis is
driving a renaissance in growth measurement. Cur-
rent opinion in plant biology, 16(1):100–104.
Varah, A., Ahodo, K., Coutts, S. R., Hicks, H. L., Comont,
D., Crook, L., Hull, R., Neve, P., Childs, D. Z., Freck-
leton, R. P., et al. (2020). The costs of human-induced
evolution in an agricultural system. Nature Sustain-
ability, 3(1):63–71.
WSSA (2024). Facts about weeds - the bullies of the plant
worlds. Accessed: 01/10/2024.
Yao, W., Bai, J., Liao, W., Chen, Y., Liu, M., and Xie, Y.
(2024). From cnn to transformer: A review of medi-
cal image segmentation models. Journal of Imaging
Informatics in Medicine, pages 1–19.
VISAPP 2025 - 20th International Conference on Computer Vision Theory and Applications
382
