
Feasibility of Inferring Spatial Transcriptomics from Single-Cell
Histological Patterns for Studying Colon Cancer
Tumor Heterogeneity
Michael Y. Fatemi¹, Yunrui Lu², Zarif L. Azher¹¹
,
¹³
*
, Cyril Sharma³, Eric Feng⁴, Alos B. Diallo²
,
⁵
,
⁶,
Gokul Srinivasan², Grace M. Rosner⁷
,
⁸, Kelli B. Pointer⁷
,
⁸, Brock C. Christensen⁵, Lucas A. Salas⁵,
Gregory J. Tsongalis², Scott M. Palisoul², Laurent Perreard⁹, Fred W. Kolling IV⁹, Louis J. Vaickus²
and Joshua J. Levy²
,
⁶
,
¹⁰
,
¹¹
,
¹²
1
University of Virginia, Charlottesville, Virginia, U.S.A.
2
Emerging Diagnostic and Investigative Technologies, Department of Pathology and Laboratory Medicine,
Dartmouth Health, Lebanon, NH, U.S.A.
3
Department of Computer Science, Purdue University, West Lafayette, IN, U.S.A.
4
Thomas Jefferson High School for Science and Technology, Alexandria, VA, U.S.A.
5
Department of Epidemiology, Dartmouth College Geisel School of Medicine, Hanover, NH, U.S.A.
6
Program in Quantitative Biomedical Sciences, Dartmouth College Geisel School of Medicine, Hanover, NH, U.S.A.
7
Department of Medicine, Section of Radiology Oncology, Dartmouth Health, Lebanon, NH, U.S.A.
8
Department of Molecular and Cell Biology, Dartmouth College Geisel School of Medicine, Hanover, NH, U.S.A.
9
Genomics Shared Resource, Dartmouth Cancer Center, Lebanon, NH, U.S.A.
10
Department of Dermatology, Dartmouth Health, Lebanon, NH, U.S.A.
11
Department of Pathology and Laboratory Medicine, Cedars Sinai Medical Center, Los Angeles, CA, U.S.A.
12
Department of Computational Biomedicine, Cedars Sinai Medical Center, Los Angeles, CA, U.S.A.
13
Division of Biology and Biological Engineering, California Institute of Technology, Pasadena, CA, U.S.A.
Keywords: Pathology, Cancer, Deep Learning, Spatial Transcriptomics, Histopathology.
Abstract: Spatial transcriptomics (ST) enables studying spatial organization of gene expression within tissues, offering
insights into the molecular diversity of tumors. Recent methods have demonstrated the capability to
disaggregate this information at subspot resolution by leveraging both expression and histological patterns.
Elucidating such information from histology alone presents a significant challenge, but if solved can enable
spatial molecular analysis at cellular resolution even where ST data is not available, reducing study costs.
This study explores integrating single-cell histological and transcriptomic data to infer spatial mRNA
expression patterns in colorectal cancer whole slide images. A cell-graph neural network algorithm was
developed to align histological information extracted from detected cells with single cell RNA, facilitating
the analysis of cellular groupings and gene relationships. We demonstrate that single-cell transcriptional
heterogeneity within a spot could be predicted from histological markers extracted from cells detected within
it. Our model exhibited proficiency in delineating overarching gene expression patterns across whole-slide
images. This approach compared favorably to traditional computer vision methods which did not incorporate
single cell expression during the model training. This innovative approach augments the resolution of spatial
molecular assays utilizing histology as sole input through co-mapping of histological and transcriptomic
datasets at the single-cell level.
1 INTRODUCTION
Cancer poses tremendous global burden on healthcare
and quality of life. By the end of 2023, nearly 2
million new cancer cases and more than 600,000
*
Denotes equal first authorship.
cancer deaths will occur in the United States (Siegel
et al., 2020, 2023). Colorectal cancer (CRC) is a
particularly formidable solid tumor, with an annual
incidence of approximately 150,000 new cases in the
United States and a 63% 5-year survival rate (Siegel
444
Fatemi, M. Y., Lu, Y., Azher, Z. L., Sharma, C., Feng, E., Diallo, A. B., Srinivasan, G., Rosner, G. M., Pointer, K. B., Christensen, B. C., Salas, L. A., Tsongalis, G. J., Palisoul, S. M., Perreard,
L., Kolling IV, F. W., Vaickus, L. J. and Levy, J. J.
Feasibility of Inferring Spatial Transcriptomics from Single-Cell Histological Patterns for Studying Colon Cancer Tumor Heterogeneity.
DOI: 10.5220/0013157300003911
Paper published under CC license (CC BY-NC-ND 4.0)
In Proceedings of the 18th International Joint Conference on Biomedical Engineering Systems and Technologies (BIOSTEC 2025) - Volume 1, pages 444-458
ISBN: 978-989-758-731-3; ISSN: 2184-4305
Proceedings Copyright © 2025 by SCITEPRESS – Science and Technology Publications, Lda.

et al., 2020, 2023). With the shift in CRC to younger
demographics and tumor metastasis being
responsible for most cancer deaths, there is a pressing
need for high-fidelity screening and prognostication
(Cheng et al., 2022). The treasure trove of imaging
and genomics information provided by nascent
molecular assays and informatics techniques has the
potential to inform more effective, targeted treatment
options by revealing novel prognostic biomarkers.
Tumor Infiltrating Lymphocytes (TIL) are critical
in modulating the Tumor Microenvironment (TME)
and Tumor Immune Microenvironment (TIME) (de
Visser & Joyce, 2023). The TME consists of
malignant and benign cells, blood vessels, and
extracellular matrix, interconnected through complex
communication via cytokine recruitment factors (de
Visser & Joyce, 2023). Recent studies highlight the
importance of immune infiltrates, such as T cells, B
cells, NK cells, and monocyte/lymphocyte cells, and
their distribution, density, and relationships in
mounting an effective anti-tumor response. For
example, high levels of cytotoxic T cells within the
tumor may indicate immune exhaustion (Collier et
al., 2021). Understanding molecular changes and
spatial arrangements associated with colon cancer
metastasis is still incomplete, though several digital
pathology assays have incorporated existing findings
to serve as independent risk factors for recurrence.
These assays include: 1) Immunoscore, which
measures the density of cytotoxic T-cells at the
tumor's invasive margin and inside the tumor (Galon
et al., 2014), 2) CDX2, an epithelial marker of
pluripotency indicating the tumor's ability to bypass
immune response and growth inhibition checkpoints
(Dalerba et al., 2016; Saad et al., 2011; Tarazona et
al., 2020), and 3) circulating tumor DNA, such as
mutations in the Vascular Endothelial Growth Factor
(VEGF) pathway (G. Chen et al., 2021; H. Li et al.,
2019). While these assays are predictive of recurrence
risk, they provide only a limited perspective on tumor
metastasis phenomenology.
Spatial omics technologies, like 10x Genomics
Visium Spatial Transcriptomics (ST) or GeoMX
Digital Spatial Profiling (DSP), have facilitated the
simultaneous analysis of multiple biomarkers,
including the whole transcriptome, with remarkable
spatial resolution (K. H. Chen et al., 2015; Hu et al.,
2021; Lewis et al., 2021; Moses & Pachter, 2022).
These technologies have been applied to further
characterize TIL subpopulations in TME. However,
their clinical utility is limited due to high costs, low
throughput, and limited reproducibility. In previous
work, we demonstrated the feasibility of utilizing
machine learning algorithms to extract TIL and
spatial biology information from Hematoxylin and
Eosin (H&E) stains. This can be a cost-effective and
high-throughput digital biomarker that could be
employed prospectively as an adjunct test similar to
Immunoscore for recurrence risk assessment (Monjo
et al., 2022; Zeng et al., 2022). We found that careful
selection of algorithms is crucial to capture molecular
alterations and pathways reflective of
histomorphological changes or large-scale tissue
architecture changes (Fatemi et al., 2023; Srinivasan
et al., 2023).
Nevertheless, the resolution of these findings is
currently restricted to the available resolution of
Visium spots, typically around 50 microns, which
aggregates expression data across a small number of
cells (1-10 cells). Incorporating single-cell
information, captured through the new Chromium
Flex technology can improve characterization of
spatial cellular heterogeneity to enhance the
resolution of the Visium data. Recent advancements
in profiling technologies, including 10x Flex and
CytAssist assays, enable the profiling of single-cell
transcriptomics (scRNASeq) on serial sections of
formalin-fixed paraffin-embedded (FFPE) tissue.
This has the potential to enhance the capacity to
perform spatial assessments at single-cell resolution
on diverse cohorts.
Existing technologies to increase the resolution of
Visium data require both ST and histological
information and do not operate on tissue images
alone. Previous studies have made attempts to infer
single-cell RNA sequencing (scRNA-seq) data from
breast cancer tissue slide sections, improving the
resolution of the data and enabling the identification
of different cell types within the tissue (Choi & Kim,
2019). Others have made attempts to infer Visium ST
expression patterns aggregated across several cells
per spot using image classification techniques with
some domain-specific adaptations. For example,
recent studies have trained DenseNet-121 and
InceptionV3 models to predict gene expression (B.
He et al., 2020; Levy-Jurgenson et al., 2020), and
another work used a custom convolutional layer
along with a graph attention network and transformer
model to share information between Visium spots
(Zeng et al., 2022). While the Visium platform
primarily provides low-resolution, aggregated
expression measurements across cells contained
within a 50-micron spot (Duan et al., 2022; J. Liu et
al., 2022), single-cell analyses offer a more
comprehensive view of cellular heterogeneity.
Feasibility of Inferring Spatial Transcriptomics from Single-Cell Histological Patterns for Studying Colon Cancer Tumor Heterogeneity
445

The primary goal of this study is to enhance the
predictive capability of algorithms that infer ST data
solely from histology images, capturing single-cell
heterogeneity within a spot and their aggregate spot-
level expression. To achieve this, we combine the
precise locations of individual cells, as identified in
whole cell images, with the granular data from single-
cell RNA sequencing (scRNA-seq). This approach
integrates histological details from localized nuclei
within and around Visium spots with corresponding
scRNA-seq profiles mapped to the same spots. By
seamlessly merging these datasets, our framework
stands extracts richer molecular insights from cells,
facilitating a more accurate prediction of both Visium
ST and individual cell information.
We develop attribution methods to examine the
structural organizations of cells that are most
correlated with the expression of specific genes. This
can contribute to a better understanding tumor-
immune microenvironment dynamics and potentially
aid in developing prognostic tools for colorectal
tumors. In this paper, we compare the accuracy of
methods that use cells as features with conventional
computer vision methods featured in our previous
work. Importantly, this study does not claim to infer
scRNASeq data at specific locations of individual
cells. Rather, we demonstrate the ability to leverage
single-cell information to enhance the expression
prediction at Visium spots on held-out tissue slides.
This research establishes a foundational workflow
and conceptual framework for the future inference of
such information.
2 RESULTS
2.1 Overview of Cells2RNA
Framework: Bridging Histological
Patterns with Single-Cell
Expression
Cells2RNA was crafted to infer single-cell expression
from discernible histological patterns in instances
where spatial transcriptomics and single-cell data
might be lacking (Figure 1). The challenge lies in
deducing single-cell nuances solely from histological
patterns surrounding pinpointed cells (Figure 2A).
Prior research has been limited to interpreting
aggregated spot-level data. Yet, when disaggregated
to the individual cell level, a richer tapestry of
heterogeneity emerges, which becomes our focal
point for inference. The goal of this study is to derive
molecular insights paralleling the depth of Visium-
based investigations, but strictly from histological
imaging.
Central to our approach is a co-mapping
methodology where histological patterns detected at
the cellular level are intricately aligned with single-
cell expression data (Figure 1A). Spatial
transcriptomics serves as an intermediary in this
process: during training, single-cell RNASeq data is
mapped to corresponding Visium spots (Figure 1B)
where cells are located and acts as an inference target
for the histological attributes derived from these
located cells. Although this alignment might not be
perfect, it closely mirrors genuine single-cell
expression dynamics within each Visium spot.
Using Visium and paired 40X resolution whole
slide imaging from a cohort of nine stage pT3
colorectal patients (see section “Data Collection and
Preprocessing”), the co-mapping technique was
benchmarked against patch-level models
(Inceptionv3) and other CGNNs that utilize
alternative information extraction methods. We
assessed their performance on predicting spot-level
expression, capturing cellular heterogeneity within
spots (using Wasserstein distance), maintaining tissue
architectural relationships, and pathway analysis.
2.2 Model Comparison
Overall, models have strong performance– selecting
the top CGNN model per gene resulted in an AUROC
of 0.8138 ± 0.0069 and Spearman's statistic of 0.5724
± 0.0133 (Table 1). However, across all experiments,
model performances did not appear significantly
different from each other, though we noticed several
important trends (Figure 3,4). CGNN models were
on-par with the Inception model (AUC=0.8204 ±
0.0073). The most predictive cell-based model had an
AUROC of 0.8093 ± 0.0083, similar to the
InceptionV3 model's AUROC interval of 0.8204 ±
0.0073, which leveraged additional information
beyond the cell's immediate neighborhood and may
have also benefited from the built-in structural feature
extraction of CNNs. There was high agreement in
top-performing genes between CGNN methods using
graph contrastive learning or single-cell penalization
as compared to a CGNN with no
penalization/pretraining (Appendix Figure 1,
Appendix Table 1).
BIOINFORMATICS 2025 - 16th International Conference on Bioinformatics Models, Methods and Algorithms
446
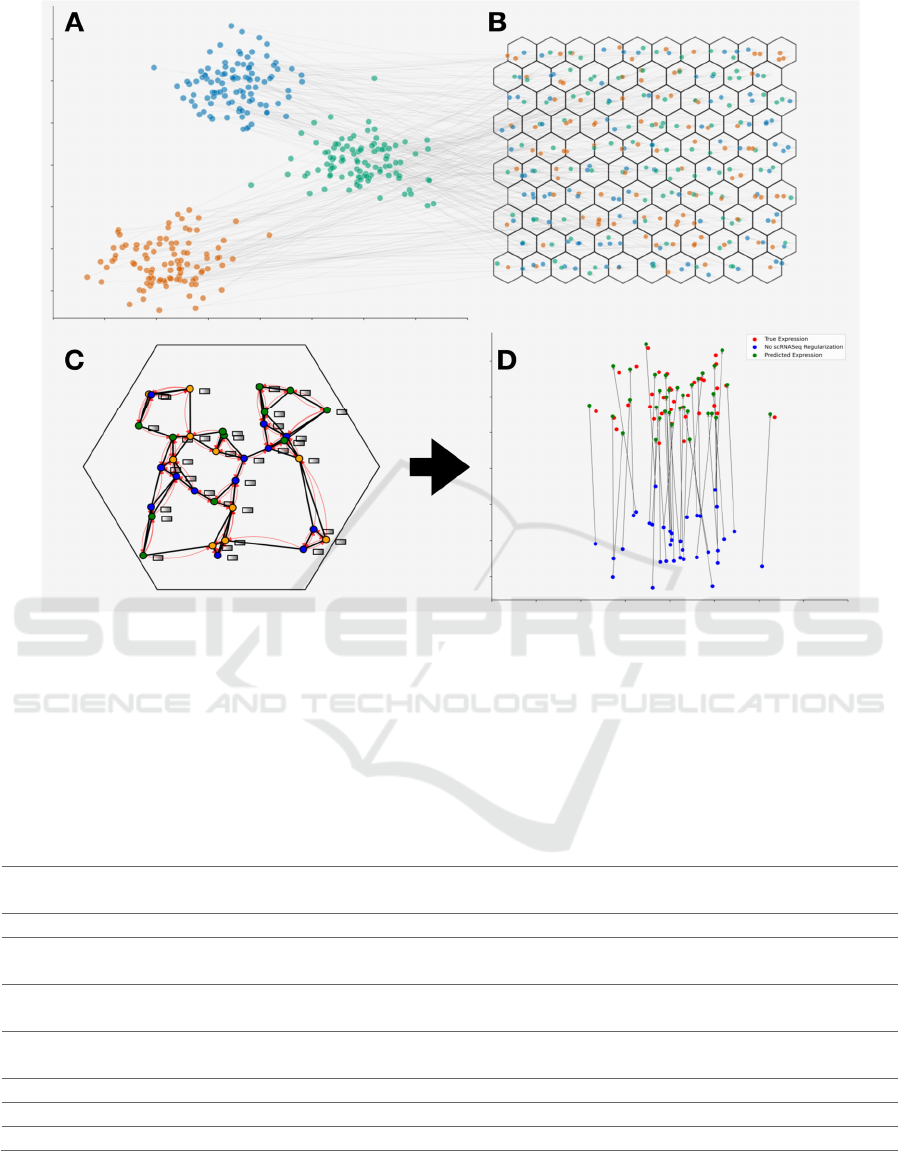
Figure 1: Overview of Cell2RNA’s Co-Mapping Approach: (A) Low-dimensional visualization of single-cell RNA profiles,
clusters indicating cell-type. (B) Spatial layout of identified cells across the tissue slide (assignment to spots represented by
hexagons), color-coded by distinct gene expression patterns mapped from single cell profiles featured in (A). (C) In-depth
view of cells located within a specific Visium spot, illustrating connectivity and cell relationships. Expression-related
histological features, represented by grey rectangles, are shared among neighboring cells through red curves via a graph neural
network. (D) A side-by-side low-dimensional comparison of scRNASeq profiles for a representative Visium spot: actual
expression (red), model-predicted expression using the co-mapping training approach (green), and expression prediction
without co-mapping training (blue).
Table 1: Comparison of model performance. Aggregate AUROC is calculated as the median AUROC across genes. Gene-
level AUROC is calculated as the mean across cross-validation folds.
Modeling Approach Spearman AUROC Optimal Transport
(EMD)
Vanilla CGNN 0.5591 ± 0.0146 0.8093 ± 0.0083 0.2113 ± 0.0018
CGNN: Graph Contrastive
Learnin
g
0.5356 ± 0.0177 0.8049 ± 0.0083 0.1900 ± 0.0020
CGNN: Single-Cell
Penalization
0.5381 ± 0.0158 0.8012 ± 0.0074 0.1473 ± 0.0018
CGNN: GCL and Single-
cell penalization
0.5464 ± 0.0156 0.8084 ± 0.0093 0.1415 ± 0.0018
Top CGNN per Gene 0.5637 ± 0.0135 0.8138 ± 0.0069
N
/A
Top Model per Gene 0.5766 ± 0.0122 0.8206 ± 0.0076
N
/A
InceptionV3 (256x256) 0.5724 ± 0.0133 0.8204 ± 0.0073
N
/A
Feasibility of Inferring Spatial Transcriptomics from Single-Cell Histological Patterns for Studying Colon Cancer Tumor Heterogeneity
447
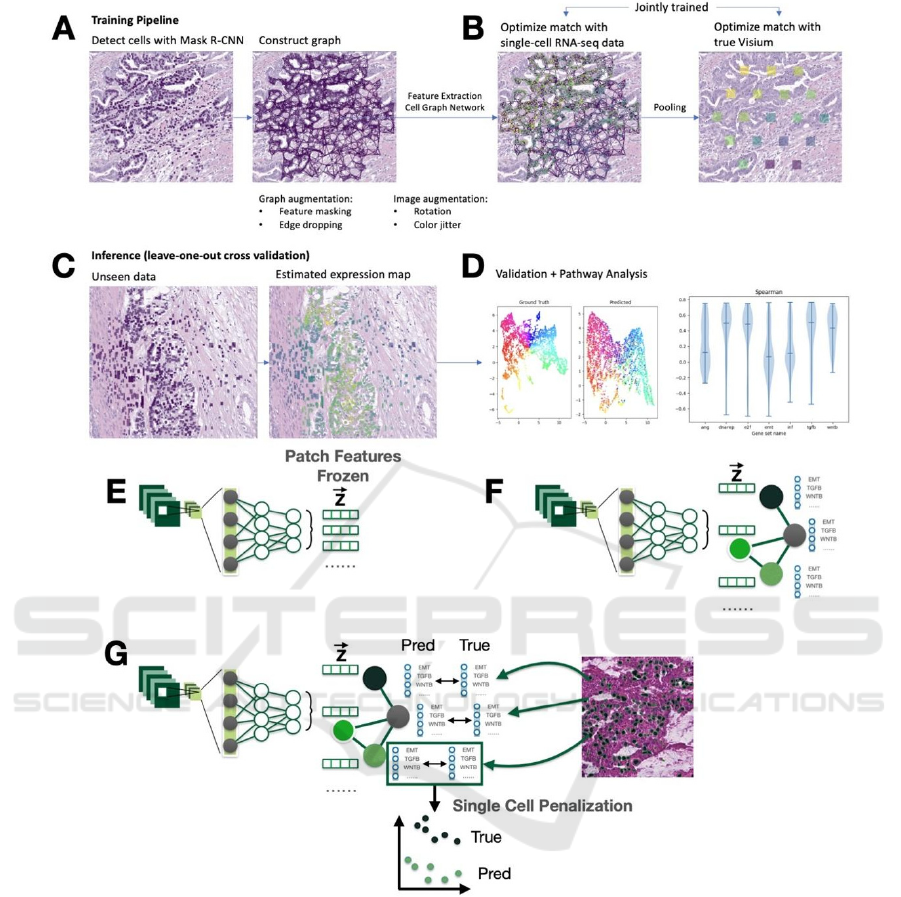
Figure 2: Schematic Representation of the Neural Network Workflow for Single-Cell Analysis. During the training phase,
(A) a pre-trained Mask R-CNN model is applied to histology images to detect individual cells, after which a 6-nearest
neighbors graph is constructed for the detected cells. (B) Features for each cell are extracted using a ResNet-50 neural
network, and the aggregation of neighboring cell information is modeled using a Graph Attention Network (GAT). For each
Visium spot, the node features are aggregated using sum pooling. (C) Pre-pooled node values are jointly optimized against
single-cell RNA-sequencing (scRNA-seq) data, and (D) pooled Visium spot predictions are optimized against the
corresponding ground truth data, using a mean-squared-error loss computed across log-transformed counts. (E)-(G) Visual
description of neural network architectures and penalizations employed: (E) a two-stage neural network comprising a feature
extraction stage and a prediction stage, this was not used in this work, (F) an end-to-end neural network encompassing the
entire process from cell detection to feature extraction, graph convolutions and prediction, utilized in this study, and (G) the
incorporation of single-cell-level penalties into the loss function to enforce consistent predictions with scRNA-seq data.
BIOINFORMATICS 2025 - 16th International Conference on Bioinformatics Models, Methods and Algorithms
448
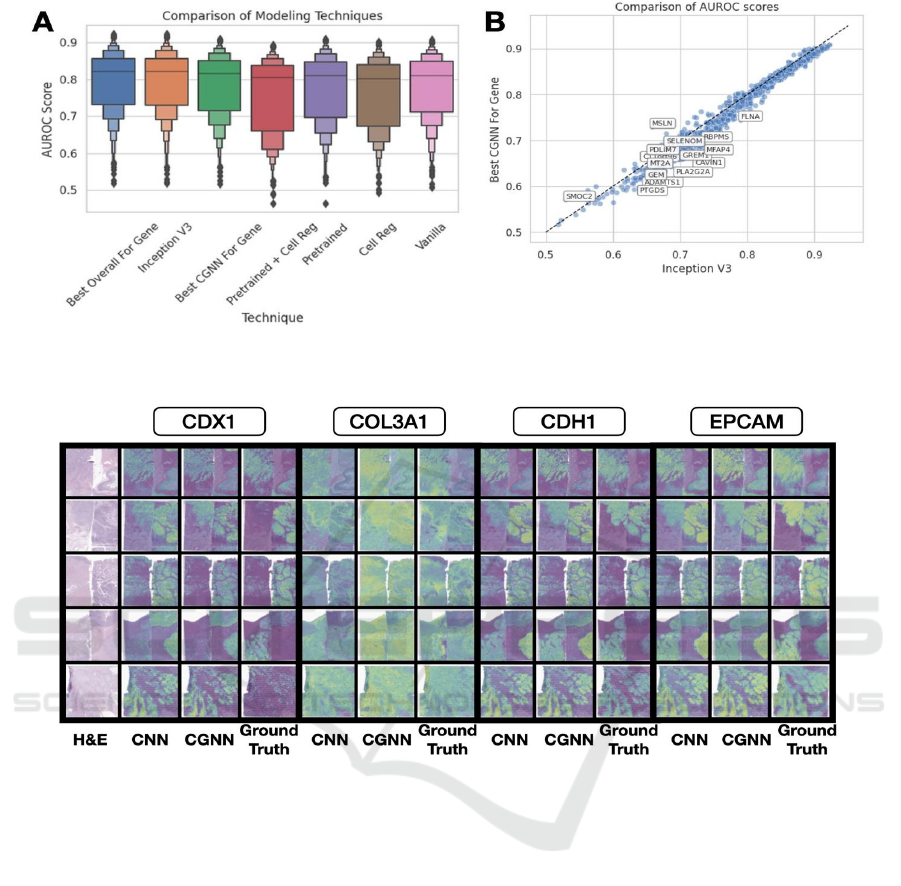
Figure 3: Performance comparison between methods. A) Boxplot of AUROC scores from each method; B) comparison of
AUROC for best CGNN and CNN for each gene.
Figure 4: Predicted expression for various genes: CNN, CGNN, compared to ground truth for genes CDX1, COL3A1, CDH1
and EPCAM across sections from all nine patients.
2.3 Single-Cell Attribution Maps Point
to Spatial Cellular Heterogeneity
Single-cell regularization significantly improved
alignment of cellular information extracted from
located cells, as measured by the Earth Mover's
(Wasserstein) distance between cells assigned to
spots using Tangram and their closest detected
matches (EMD=0.1415 ± 0.0018 with penalization,
0.2113 ± 0.0018 without penalization). This
improvement does not negatively impact AUROC.
Cells were embedded using UMAP based on the
ground truth and predicted expression, with and
without penalization with scRNASeq. Visual
inspection of these UMAP embeddings confirmed the
quantitative results of differences in EMD (Appendix
Figure 2), that single-cell penalization causes node-
level predicted expression from cellular
histomorphology for genes to more closely resemble
the distribution of single-cell data assigned to the
Visium spot.
Overall, more than 80% of the genes exhibited a
positive correlation between ground truth and
predicted single-cell expression when single-cell
regularization was employed, compared to around
20-30% of the genes without such regularization was
not used (Appendix Figure 3). As illustrated in Figure
5E-G, we juxtapose the predicted level of EPCAM
expression for each cell against ground truth data
from a Visium assay. Our model's predictions and the
ground truth at cellular resolution are visually
consistent (Figure 5A-D), corroborating the high
accuracy reported in the previous section as well as
the lower EMD reported through single-cell
penalization.
Feasibility of Inferring Spatial Transcriptomics from Single-Cell Histological Patterns for Studying Colon Cancer Tumor Heterogeneity
449
2.4 Topological Consistency of Inferred
Expression Patterns
Across all capture areas, predicted spot level
expression clustered similarly to the true expression
(Figure 6). However, overlaying the clusters assigned
to ground truth embeddings over the predicted
expression embeddings, we found that clusters were
less separated and fuzzier than the ground truth.
Nonetheless, overlaying cluster assignments across
the whole slide image demonstrates the ability of
these models to derive expression signatures that can
delineate key histological architectures.
2.5 Pathway Analysis
To compare performance across prediction targets,
we selected pathways from MSigDB's Hallmark
Gene Sets (Liberzon et al., 2011; Subramanian et al.,
2005) and reported average AUC for genes from
these sets. Across modeling approaches, genes
involved in DNA repair and E2F targets were
predicted with higher performance as compared to
other molecular pathways (Appendix Figure 4).
Dysregulation of DNA repair can accelerate tumor
progression (L. Li et al., 2021), and therefore
accurately detecting the presence of relevant genes
may be useful in prognostication. We did notice that
for some pathways, e.g., Epithelial to Mesenchymal
Transition, penalizing by single-cell expression led to
some loss of performance in distinguishing these
molecular signatures (Appendix Figure 4).
We performed a pathway analysis by
subsetting the top 10% of genes per modeling
approach for further analysis using the Enrichr
software/database (E. Y. Chen et al., 2013; Xie et al.,
2021). Notably, we found that the WNT in Epithelial
to Mesenchymal Transition in Cancer pathway, a
chief contributor to the migration and metastasis of
cancer cells, and several pathways associated with
desmosome assembly (which regulate intercellular
adhesion between metastasizing cells) were among
the top ten most statistically significant gene sets
detected in all four techniques, and EPCAM in
Cancer Cell Motility and Proliferation is a
statistically significant gene set in all four techniques.
The WNT in Epithelial to Mesenchymal Transition in
Cancer pathway has an AUROC of 0.8686 ± 0.0273
for the Inception model and 0.8638 ± 0.0238 for the
"vanilla" cell graph model.
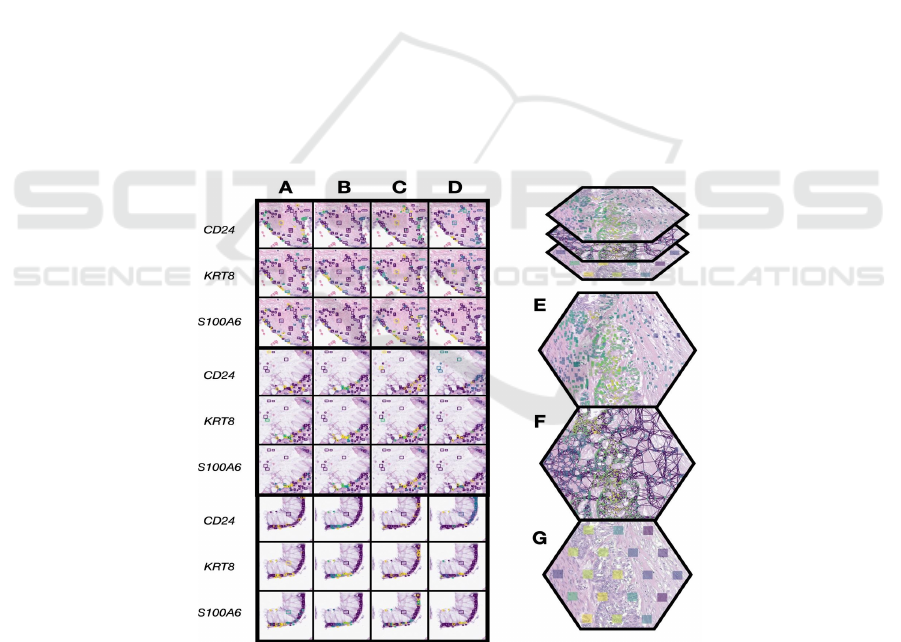
Figure 5: Alignment of True and Predicted Single-Cell and Visium-Spot Level Expression on a Histological Section.
Illustration of the relationship between true and predicted single-cell expression on a histological section for genes CD24,
KRT8, and S100A6. A) and C) display the ground truth of single-cell expression with and without single-cell regularization,
respectively. B) and D) visualize the respective predicted single-cell expressions. Progressing from individual cellular
predictions to a broader view, D)-G) detail the transition through EPCAM expression: from predicted cell-level expression
in D) to an overarching cell graph across multiple Visium spots in E) and concluding with spot-level Visium expression in
G).
BIOINFORMATICS 2025 - 16th International Conference on Bioinformatics Models, Methods and Algorithms
450

Figure 6: UMAP embeddings of tissue slides from selected capture areas, color-coded by HDBSCAN clusters. Comparisons
include CGNN, CGNN with single-cell penalization, and patch-based methods against the ground truth. Clusters derived
from the ground truth are overlaid on the slides for context. Patients with/without metastasis (METS) included.
3 DISCUSSION
Our primary objective was to draw inferences about
spatial mRNA expression patterns from whole slide
images (WSI), specifically by fusing single-cell
histological and transcriptomic data. Instead of
relying on expensive spatial molecular assays, our
technique offers an economical avenue method which
can subsequently aid in the risk evaluation of
recurrence. Our results highlight the viability of
utilizing spatial transcriptomics as a rich pretraining
source, using scRNASeq to guide single-cell level
interpretations that could benefit from graph-based
representations.
Our study revealed that by considering cells'
histomorphology and spatial relationships, we could
effectively predict gene expression patterns across
whole slide images. In some instances, these
approaches outperformed traditional patch-based
computer vision methods that analyze cropped
images around each Visium spot. However, the
predictive capacity of these approaches was found to
be similar to patch-based methods, which is
reasonable considering that the cells are contained
within these patches and should present some loss of
information. By explicitly incorporating cells as
nested observations, attribution methods enabled the
identification of structural cell organizations that
exhibited the strongest correlation with the
expression of specific genes.
3.1 Comparison of Cell-Level
Approach to Patch-Based Methods
The performance of the CNN model does not surpass
that of the cell-based approaches. Interestingly, our
basic cell model demonstrates a bootstrapped
AUROC confidence interval overlapping with that of
the Inception model. This indicates that even when
operating with potentially less diverse information
like the extracellular matrix and connective tissue, the
cell-based model remains competitive against its
CNN counterpart. Although CNN may show a slight
performance advantage, its insights are limited to
single-pixel attributions, neglecting the broader scope
of cell-cell interactions. Conversely, the GNN model
offers superior explainability, permitting direct
visualization of pivotal cell-cell interactions for
particular genes and topological methods for
deciphering important structural motifs.
3.2 Impact of Single-Cell Penalization
Single-cell penalization and contrastive pretraining
showed minimal influence on the final outcome. This
indicates that employing single-cell penalization can
Feasibility of Inferring Spatial Transcriptomics from Single-Cell Histological Patterns for Studying Colon Cancer Tumor Heterogeneity
451

shed light on the spatial nuances of cellular disparities
without compromising performance. We believe this
is due to the large dataset size (more than 60,000
Visium spots), which may mitigate the need or
potential benefit of pretraining. Additionally,
although we hoped that single-cell penalization
would improve the model's robustness (by grounding
predictions in real single-cell RNA quantification),
the penalization provided modest performance gains
over other methods. This suggests that models may
produce the same optimum regardless of the
intermediate feature values (i.e., cell-level
predictions). Notably, single-cell data is not required
during model inference as it is used solely for
regularization during training
3.3 Revisiting Topological Consistency
and Intermediate
Histologically-Associated
Molecular States
We discovered that although the predicted expression
patterns mirrored the essential topological
relationships tied to specific histological structures,
they were more intertwined compared to the true
expression, resulting in less pronounced clustering.
Such mixed clustering might suggest that these
clusters signify different degrees of cellular activity
for various phenomena. It seems easier for machine
learning models to distinguish between low and high
activity levels, but interpolating intermediate levels of
activity poses a challenge from a visual standpoint.
Nevertheless, overall, the model's predictions are
topologically in line with the ground truth. Areas of
tissue with similar ground truth measurements also
exhibit similar predicted expressions.
3.4 Reflections on Pathway Analysis
and Immunological Considerations
The WNT in Epithelial to Mesenchymal Transition in
Cancer and EPCAM in Cancer Cell Motility and
Proliferation were notable pathways from the results
section. Wnt/β-catenin signaling is implicated in cell
differentiation and proliferation and has been
implicated in increasing the number of "stem-like"
cells in a tumor (Pai et al., 2017). EPCAM is
responsible for modulating epithelial cell adhesion,
and - while having conflicting trends in recent
research - can result in adhesive and migratory cell
activity, potentially impacting the potential for
metastasis (Fagotto & Aslemarz, 2020).
Our approach to unveil single-cell heterogeneity
from whole slide images through alignment with
single-cell expression bears several important
immunological implications. First, the spatial
arrangement of immune cells not only influences
processes governing the anti-tumoral response but
may offer insights as to the efficacy of
immunotherapies including checkpoint inhibitors
which has been a timely subject of inquiry (Dermani
et al., 2019, p. 1; X. Wang et al., 2022). Deciphering
the spatial make-up may also further reveal how
tumors can establish immunosuppressive
environments or contribute to an immune exhaustion
phenotype (Ando et al., 2020; Yang et al., 2019).
These topics underscore work being done to study
how tumors can alter their immunogenicity and
immune evasion tactics, potentially informing CAR
T-cell therapies or selection of specific antibodies
which can be applied in a personalized manner (Z.
Liu et al., 2022; Peng et al., 2022; F. Wang et al.,
2023). Revealing additional heterogeneity may refine
selection of adjuvant therapy choices outside of
existing prognostic measures.
3.5 Limitations and Future Directions
Our study has several limitations that offer avenues
for future research. First, while our cohort of nine
samples is large for a Visium study, we plan to amass
a larger, more diverse cohort to bolster the robustness
of our findings by accounting for further tumor
heterogeneity. As our cohort was restricted to pT3
patients, future work will examine the predictiveness
of these algorithms at additional tumor sites and
levels of TME invasiveness. Inaccurate mapping of
single-cell profiles to Visium spots may have also
impacted the validity of single-cell associations and
could improve with the adoption of other spatial
mapping methods. We will also investigate how
performance of single cell disaggregation is different
based on level of expression. Overall, our study
signifies a crucial step towards improving cancer
diagnostics and prognosis by incorporating spatial
transcriptomics into histological images, and future
efforts will focus on refining these techniques.
4 CONCLUSION
Our study revealed that by considering cell
histomorphology and spatial relationships, we could
effectively predict gene expression patterns across
whole slide images and recover local patterns of
cellular heterogeneity. Identifying structural cell
organizations that exhibited the strongest correlation
with the expression of specific genes has the potential
BIOINFORMATICS 2025 - 16th International Conference on Bioinformatics Models, Methods and Algorithms
452

to drastically improve our understanding of the
tumor-immune microenvironment and potentially
guide personalized treatment. Future applications of
this method could include predicting response to
immunotherapy based on the spatial distribution and
expression patterns of immune cells in the tumor
microenvironment. Our work is a promising direction
for enhancing not only the diagnosis and prognosis of
cancer but also our broader understanding of the
clinical and immunological intricacies of tumor
microenvironments.
5 METHODS
5.1 Data Collection
The dataset used in this study comprised nine patients
with pathologic T Stage-III (pT3) colorectal cancer.
Following IRB approval, these patients were selected
through a retrospective review of pathology reports
from 2016 to 2019. Patients were matched based on
various criteria such as age, sex, tumor grade, tissue
size, mismatch repair/microsatellite instability
(MMR/MSI/MSS) status, and tumor site, balanced
representation across these factors. Specific regions
of interest within these sections, including
epithelium, tumor-invasive front, intratumoral areas,
and lymphatics, were annotated by a board-certified
GI pathologist. Following annotation, these regions
were dissected from the tissue, and subjected to H&E
staining, imaging, and Visium profiling at the
Pathology Shared Resource at Dartmouth Cancer
Center and Single Cell Genomics Core in the Center
for Quantitative Biology.
To achieve uniform staining and enhance image
quality, we incorporated the CytAssist workflow,
which allows Visum profiling of tissues on standard
histology slides, enabling the use of automated
staining (Sakura Tissue-Tek Prisma Stainer– Sakura
Finetek USA, Inc. 1750 West 214th Street, Torrance,
CA 90501) and WSI at 40x resolution (0.25 micron
per pixel) via Aperio GT450s to obtain high-quality
images. Following the preparation of the tissue slides,
we employed the Visium assay using the CytAssist
technology according to the manufacturer’s protocol
(CG000495) (Rosasco et al., 2023). For data
processing, we utilized Spaceranger V to align the
CytAssist images with the corresponding 40X H&E
stains, conduct quality control, and convert the
Visium Spatial Transcriptomics (ST) data into genes
expression matrices (Sun et al., 2020).
We utilized the Chromium Flex assay to acquire
single-cell RNA-Seq data, specifically from serial
sections of patients identified in Capture Areas 2 (left
section) and 5 (right section), as detailed in Table 2.
This method allows for single cell profiling of
disaggregated FFPE tissue sections using the same
transcriptomic probe set as the Visium assay,
revealing the diverse cell types within the tissue. Data
were processed using CellRanger v7.1.0 to generate
quality control metrics and a cells by genes
expression matrices for downstream processing.
Notably, this single cell data was profiled from
different serial sections than the Visium experiments.
5.2 Preprocessing and Augmentation
We curated a list of 1,000 target genes by initially
filtering out those not appearing in at least 100 spots
per patient. These genes were subsequently ranked
based on the fraction of their spatial variance, as
determined through SpatialDE analysis. To rectify
aberrant gene expression levels, we applied a
transformation to both prediction and target gene
counts using the expression log(1 + counts).
Cell detection was performed using the Mask-
RCNN framework, which was trained on both the
Lizard dataset and our internal dataset (Graham et al.,
2021; K. He et al., 2017; Vuola et al., 2019). The
nuclei detection model, available through the public
Detectron2 Model Zoo, served as our pre-trained
base. This model was fineturned on our dataset for up
to 5,000 epochs. After training, this cell detection
model was systematically applied across each Whole
Slide Image (WSI).
The associated image was normalized for each
detected cell through standard scaling applied over
the image channels. We implemented data
augmentation techniques to enhance our dataset,
including random rotations (up to 90º) and color jitter
adjustments. These augmentations were specifically
applied to the images and cell detections cropped
around the Visium spots during the training phase.
5.3 Deep Learning to Integrate
Information from Localized Cells
to Predict Spatial Gene Expression
Cell graph neural networks (CGNN) facilitate the
exchange of messages between adjacent cells,
enabling the exchange/incorporation of contextual
information (Jaume et al., 2021; Levy et al., 2021; M.
M. Li et al., 2022; Reddy et al., 2022). This approach
effectively captures the relationships between
different cell populations within the tissue, including
tumor cells and surrounding immune and other cell
subpopulations. Leveraging these relationships can
Feasibility of Inferring Spatial Transcriptomics from Single-Cell Histological Patterns for Studying Colon Cancer Tumor Heterogeneity
453

enhance the predictive performance of our spatial
RNA inference algorithms while providing additional
information as to relevant cells for these predictions.
We implemented an end-to-end training strategy
that integrates the simultaneous training of a
Convolutional Neural Network (CNN) and a Graph
Neural Network (GNN). The CNN is designed to
extract cell-level features from histological images,
while the GNN contextualizes these features by
incorporating information from neighboring cells.
Our end-to-end approach aims to harmonize the
feature extraction and contextualization processes,
enabling the CNN to learn cell-level features that are
more effectively contextualized through iterative,
integrated training with the GNN (Figure 1,2).
The backbone of the model is a four-layer graph
attention network (GAT) (Raju et al., 2020;
Veličković et al., 2018), which uses self-attention
mechanisms to update the representation of each cell
with the information of its neighbors. We extract
nodal attributes from detected cells using a ResNet-
50 model, which is trained jointly with the graph
attention layers. The Euclidean distances between the
spatial locations of detected cells are used to form k-
nearest-neighbor cell graphs (k=6, determined
through a sensitivity analysis). The model maps each
cell to 512-dimensional vectors, and final node
embeddings pass through a linear layer producing a
vector representing each gene's relative pseudocount-
transformed expression for each cell. Cells
corresponding to the same Visium spot are
aggregated through global sum pooling to predict
expression for the spot. This is compared to the
pseudocount-transformed ground-truth Visium data
with mean squared error.
5.4 Comparison of Cell-Graph Neural
Network Regularization Strategies
In addition to evaluating the congruence between
ground truth and predicted expression at the spot
level, we explored the following methodological
variations:
1. Vanilla Supervised Learning Objective:
This baseline approach focuses solely on the
supervised learning objective, serving as a reference
for evaluating the potential gains from additional
regularization strategies.
2. Incorporating Graph Contrastive Learning:
This approach introduces a self-supervised
regularization term that encourages the model to learn
embeddings through the comparison of augmented
viewpoints of the same cell graph / Visium spot to
different cell-graphs / Visium spot. This can enhance
the model's sensitivity to spatial patterns in the data,
potentially improving its predictive accuracy for
spatial transcriptomics patterns.
3. Incorporating Single-Cell RNA-Seq
Penalization through Optimal Transport: This
strategy introduces a penalty term that encourages the
model to align cell-level histological features more
closely with corresponding single-cell RNA-Seq
data. By leveraging optimal transport theory, this
term effectively "guides" the model towards a
solution where the spatial patterns inferred from
histology are maximally consistent with independent
single-cell RNA-Seq measurements, thereby
enhancing the biological validity of the model's
predictions.
4. Combining Graph Contrastive Learning
and Single-Cell Penalization: This approach
synergistically combines both the graph contrastive
learning and the single-cell RNA-Seq penalization
strategies, aiming to leverage the benefits of both
spatial context awareness and alignment with single-
cell RNA-Seq data. This dual-regularization strategy
is designed to promote a model that is both sensitive
to spatial patterns and tightly aligned with
independent molecular measurements, potentially
offering a balance between spatial sensitivity and
biological validity.
5.5 Graph Contrastive Learning
Using the PyGCL package, graph contrastive learning
was implemented through augmentations to random
cell positions in the nearest neighbor graph
construction, dropping edges with a probability of
0.1, and masking out features with a probability of
0.3. Graph contrastive learning is a form of self-
supervised learning that can improve the
generalizability and robustness of graphs (Qiu et al.,
2020; Zhu et al., 2021). By intentionally adding noise
to the training cell graphs and comparing these
representations at different Visium spots, we aimed to
improve the model's generalizability when tested on
held-out data.
5.6 Incorporating Single Cell
Expression
By encouraging the predictions derived from
histological images of individual cells to align closely
with the corresponding true single-cell expression
profiles, we aim to enhance the interpretability of our
models through more consistent and biologically
meaningful cellular information, and increase the
likelihood that our predictions accurately reflect the
BIOINFORMATICS 2025 - 16th International Conference on Bioinformatics Models, Methods and Algorithms
454

true cellular composition at each spatial location.
Single-cell profiles are only utilized during model
training, and are not needed during ultimate
inference.
We initiated our analysis by mapping scRNA
profiles to Visium spots using Tangram (Biancalani
et al., 2021), and we selected the top k most likely
cells to be assigned to each spot, where k represents
the number of detected cells in that spot. Tangram
generates unique 1:1 mappings from single cell
expression profiles to spatial transcriptomics spots
based on transcriptomic similarity. We leveraged the
Wasserstein loss – which measures the work required
to transform one distribution into another (Flamary et
al., 2021; Villani, 2009) – as an effective metric for
aligning our predictive single-cell expression profiles
with the true expression profiles derived from scRNA
data.
5.7 Comparison to Convolutional
Neural Network Approaches
The CGNN approaches were compared to patch-
based convolutional neural network methodologies
deemed highly predictive from previous works –
namely the InceptionV3 neural network trained on
images of tissue patches encompassing multiple cells
inclusive of surrounding tissue architecture. We
initialize the model with ImageNet weights (with the
final layer truncated) and apply the same visual
transformations as for the cell embeddings.
5.8 Training and Validation
CGNN models were implemented with the torch-
geometric Python package (Fey & Lenssen, 2019).
We use PyGCL (Zhu et al., 2021) to apply graph
augmentations. CGNN were trained using the Adam
optimizer (Kingma & Ba, 2017) with a learning rate
of 0.0001 on one Nvidia V100, quickly converging
after two epochs. Similarly, the CNN model was
trained for around 100000 iterations on a Nvidia
V100 GPU.
The final performances of these models were
compared using leave-one-patient-out cross-
validation. Statistics are reported with the Spearman
correlation coefficients. We also sought to assess the
performance of predicting binary gene expression
(low/high), by dichotomizing expression according to
(Levy-Jurgenson et al., 2020). We used this to
calculate the area under the receiver operating
characteristic curve (AUROC) as another
performance measure. Performance statistics were
generated for each cross-validation fold, including
Spearman's correlation coefficients and area under
the receiver operating characteristic curves
(AUROCs) by gene. The results were then averaged
across all folds to assess the best-performing model
on a gene-specific basis. We calculated 95%
confidence intervals for all performance statistics,
reported using 1000 sample non-parametric
bootstrapping.
5.9 Model Interpretation Through
Gene Embedding and Pathway
Analysis
We sought to understand how well each approach
could recapitulate the relationships between the
Visium spots. This was accomplished by applying
Uniform Manifold Approximation and Projection
(UMAP) to each predicted expression profile
(McInnes et al., 2018). Each method's predicted and
actual gene expressions were aligned and clustered
using the AlignedUMAP method. Clusters determined
by running HDBSCAN (McInnes et al., 2017) on the
ground truth expression data were overlaid on top of
the UMAP plots for the other methods. Then, we
annotated each of our prediction points with the
corresponding HDBSCAN cluster of the ground truth
and performed an aligned UMAP, jointly minimizing
the distance between similar expressions in the
embedding space and between paired ground truth and
true locations. In addition, we annotated our histology
images with the HBDSCAN clusters to interpret the
tissue type of origin for each point.
Pathway analyses were performed to assess the
ability of the methods to capture broader biological
phenomena. We used separate methods: 1) aggregating
the Spearman correlation and AUROC statistics across
genes associated with pathways identified from the
MSigDB Hallmarks gene set, and 2) evaluating the
enrichment of the highest genes as ranked using their
performance statistics, utilizing enrichR, which
employs a modified Fisher's exact test. By examining
the average performance across pathway analysis and
overlap tests for the top-performing genes, we can gain
insights into which biological phenomena each method
effectively represents.
DECLARATIONS
Ethics Approval, Funding, Acknowledgements
Ethics approval and consent to participate: Human
Research Protection Program IRB of Dartmouth
Health gave ethical approval for this work.
Feasibility of Inferring Spatial Transcriptomics from Single-Cell Histological Patterns for Studying Colon Cancer Tumor Heterogeneity
455

JL is supported by Department of Defense grant
545 PR220927, and NIH awards P20GM130454, 546
P20GM104416, R24GM141194, R01CA277810.
This study was carried out in the Genomics and
Molecular Biology Shared Resource (GMBSR) at
Dartmouth which is supported by NCI Cancer Center
Support Grant 5P30CA023108 and NIH S10
(1S10OD030242) awards. Single cell studies were
conducted through the Dartmouth Center for
Quantitative Biology in collaboration with the
GMBSR with support from NIGMS (P20GM130454)
and NIH S10 (S10OD025235) awards.
REFERENCES
Ando, M., Ito, M., Srirat, T., Kondo, T., & Yoshimura, A.
(2020). Memory T cell, exhaustion, and tumor
immunity. Immunological Medicine, 43(1), 1–9.
https://doi.org/10.1080/25785826.2019.1698261
Biancalani, T., Scalia, G., Buffoni, L., Avasthi, R., Lu, Z.,
Sanger, A., Tokcan, N., Vanderburg, C. R.,
Segerstolpe, Å., Zhang, M., Avraham-Davidi, I.,
Vickovic, S., Nitzan, M., Ma, S., Subramanian, A.,
Lipinski, M., Buenrostro, J., Brown, N. B., Fanelli, D.,
… Regev, A. (2021). Deep learning and alignment of
spatially resolved single-cell transcriptomes with
Tangram. Nature Methods, 18(11), Article 11.
https://doi.org/10.1038/s41592-021-01264-7
Chen, E. Y., Tan, C. M., Kou, Y., Duan, Q., Wang, Z.,
Meirelles, G. V., Clark, N. R., & Ma’ayan, A. (2013).
Enrichr: Interactive and collaborative HTML5 gene list
enrichment analysis tool. BMC Bioinformatics, 14(1),
128. https://doi.org/10.1186/1471-2105-14-128
Chen, G., Peng, J., Xiao, Q., Wu, H.-X., Wu, X., Wang, F.,
Li, L., Ding, P., Zhao, Q., Li, Y., Wang, D., Shao, Y.,
Bao, H., Pan, Z., Ding, K.-F., Cai, S., Wang, F., & Xu,
R.-H. (2021). Postoperative circulating tumor DNA as
markers of recurrence risk in stages II to III colorectal
cancer. Journal of Hematology & Oncology, 14(1), 80.
https://doi.org/10.1186/s13045-021-01089-z
Chen, K. H., Boettiger, A. N., Moffitt, J. R., Wang, S., &
Zhuang, X. (2015). Spatially resolved, highly
multiplexed RNA profiling in single cells. Science,
348(6233). https://doi.org/10.1126/science.aaa6090
Cheng, E., Ou, F.-S., Ma, C., Spiegelman, D., Zhang, S.,
Zhou, X., Bainter, T. M., Saltz, L. B., Niedzwiecki, D.,
& Mayer, R. J. (2022). Diet-and Lifestyle-Based
Prediction Models to Estimate Cancer Recurrence and
Death in Patients With Stage III Colon Cancer (CALGB
89803/Alliance). Journal of Clinical Oncology, JCO-21.
Choi, Y. H., & Kim, J. K. (2019). Dissecting Cellular
Heterogeneity Using Single-Cell RNA Sequencing.
Molecules and Cells, 42(3), 189–199.
https://doi.org/10.14348/molcells.2019.2446
Collier, J. L., Weiss, S. A., Pauken, K. E., Sen, D. R., &
Sharpe, A. H. (2021). Not-so-opposite ends of the
spectrum: CD8+ T cell dysfunction across chronic
infection, cancer and autoimmunity. Nature
Immunology, 22(7), Article 7.
https://doi.org/10.1038/s41590-021-00949-7
Dalerba, P., Sahoo, D., Paik, S., Guo, X., Yothers, G., Song,
N., Wilcox-Fogel, N., Forgó, E., Rajendran, P. S.,
Miranda, S. P., Hisamori, S., Hutchison, J., Kalisky, T.,
Qian, D., Wolmark, N., Fisher, G. A., van de Rijn, M.,
& Clarke, M. F. (2016). CDX2 as a Prognostic
Biomarker in Stage II and Stage III Colon Cancer. The
New England Journal of Medicine, 374(3), 211–222.
https://doi.org/10.1056/NEJMoa1506597
de Visser, K. E., & Joyce, J. A. (2023). The evolving tumor
microenvironment: From cancer initiation to metastatic
outgrowth. Cancer Cell, 41(3), 374–403.
Dermani, F. K., Samadi, P., Rahmani, G., Kohlan, A. K., &
Najafi, R. (2019). PD-1/PD-L1 immune checkpoint:
Potential target for cancer therapy. Journal of Cellular
Physiology, 234(2), 1313–1325.
https://doi.org/10.1002/jcp.27172
Duan, H., Cheng, T., & Cheng, H. (2022). Spatially
resolved transcriptomics: Advances and applications.
Blood Science, 5(1), 1–14.
https://doi.org/10.1097/BS9.0000000000000141
Fagotto, F., & Aslemarz, A. (2020). EpCAM cellular
functions in adhesion and migration, and potential
impact on invasion: A critical review. Biochimica et
Biophysica Acta (BBA) - Reviews on Cancer, 1874(2),
188436. https://doi.org/10.1016/j.bbcan.2020.188436
Fatemi, M., Feng, E., Sharma, C., Azher, Z., Goel, T.,
Ramwala, O., Palisoul, S. M., Barney, R. E., Perreard,
L., Kolling, F. W., Salas, L. A., Christensen, B. C.,
Tsongalis, G. J., Vaickus, L. J., & Levy, J. J. (2023).
Inferring spatial transcriptomics markers from whole
slide images to characterize metastasis-related spatial
heterogeneity of colorectal tumors: A pilot study.
Journal of Pathology Informatics, 14, 100308.
https://doi.org/10.1016/j.jpi.2023.100308
Fey, M., & Lenssen, J. E. (2019). Fast Graph
Representation Learning with PyTorch Geometric.
arXiv:1903.02428 [Cs, Stat].
http://arxiv.org/abs/1903.02428
Flamary, R., Courty, N., Gramfort, A., Alaya, M. Z.,
Boisbunon, A., Chambon, S., Chapel, L., Corenflos, A.,
Fatras, K., & Fournier, N. (2021). Pot: Python optimal
transport. Journal of Machine Learning Research,
22(78), 1–8.
Galon, J., Mlecnik, B., Bindea, G., Angell, H. K., Berger,
A., Lagorce, C., Lugli, A., Zlobec, I., Hartmann, A.,
Bifulco, C., Nagtegaal, I. D., Palmqvist, R., Masucci,
G. V., Botti, G., Tatangelo, F., Delrio, P., Maio, M.,
Laghi, L., Grizzi, F., … Pagès, F. (2014). Towards the
introduction of the ‘Immunoscore’ in the classification
of malignant tumours. The Journal of Pathology,
232(2), 199–209. https://doi.org/10.1002/path.4287
Graham, S., Jahanifar, M., Azam, A., Nimir, M., Tsang, Y.-
W., Dodd, K., Hero, E., Sahota, H., Tank, A., & Benes,
K. (2021). Lizard: A large-scale dataset for colonic
nuclear instance segmentation and classification.
Proceedings of the IEEE/CVF International Conference
on Computer Vision, 684–693.
BIOINFORMATICS 2025 - 16th International Conference on Bioinformatics Models, Methods and Algorithms
456

https://openaccess.thecvf.com/content/ICCV2021W/C
DPath/html/Graham_Lizard_A_Large-
Scale_Dataset_for_Colonic_Nuclear_Instance_Segme
ntation_and_ICCVW_2021_paper.html
He, B., Bergenstråhle, L., Stenbeck, L., Abid, A.,
Andersson, A., Borg, Å., Maaskola, J., Lundeberg, J.,
& Zou, J. (2020). Integrating spatial gene expression
and breast tumour morphology via deep learning.
Nature Biomedical Engineering, 4(8), 827–834.
https://doi.org/10.1038/s41551-020-0578-x
He, K., Gkioxari, G., Dollár, P., & Girshick, R. (2017).
Mask r-cnn. Proceedings of the IEEE International
Conference on Computer Vision, 2961–2969.
http://openaccess.thecvf.com/content_iccv_2017/html/
He_Mask_R-CNN_ICCV_2017_paper.html
Hu, J., Schroeder, A., Coleman, K., Chen, C., Auerbach, B.
J., & Li, M. (2021). Statistical and machine learning
methods for spatially resolved transcriptomics with
histology. Computational and Structural Biotechnology
Journal, 19, 3829–3841.
https://doi.org/10.1016/j.csbj.2021.06.052
Jaume, G., Pati, P., Anklin, V., Foncubierta, A., & Gabrani,
M. (2021). Histocartography: A toolkit for graph
analytics in digital pathology. MICCAI Workshop on
Computational Pathology, 117–128.
Kingma, D. P., & Ba, J. (2017). Adam: A Method for
Stochastic Optimization (arXiv:1412.6980). arXiv.
https://doi.org/10.48550/arXiv.1412.6980
Levy, J., Haudenschild, C., Barwick, C., Christensen, B., &
Vaickus, L. (2021). Topological Feature Extraction and
Visualization of Whole Slide Images using Graph
Neural Networks. Pacific Symposium on
Biocomputing. Pacific Symposium on Biocomputing,
26, 285–296.
Levy-Jurgenson, A., Tekpli, X., Kristensen, V. N., &
Yakhini, Z. (2020). Spatial transcriptomics inferred
from pathology whole-slide images links tumor
heterogeneity to survival in breast and lung cancer.
Scientific Reports, 10(1), 18802.
https://doi.org/10.1038/s41598-020-75708-z
Lewis, S. M., Asselin-Labat, M.-L., Nguyen, Q., Berthelet,
J., Tan, X., Wimmer, V. C., Merino, D., Rogers, K. L.,
& Naik, S. H. (2021). Spatial omics and multiplexed
imaging to explore cancer biology. Nature Methods,
18(9), 997–1012.
Li, H., Jing, C., Wu, J., Ni, J., Sha, H., Xu, X., Du, Y., Lou,
R., Dong, S., & Feng, J. (2019). Circulating tumor DNA
detection: A potential tool for colorectal cancer
management (Review). Oncology Letters, 17(2), 1409–
1416. https://doi.org/10.3892/ol.2018.9794
Li, L., Guan, Y., Chen, X., Yang, J., & Cheng, Y. (2021).
DNA Repair Pathways in Cancer Therapy and
Resistance. Frontiers in Pharmacology, 11.
https://www.frontiersin.org/articles/10.3389/fphar.202
0.629266
Li, M. M., Huang, K., & Zitnik, M. (2022). Graph
representation learning in biomedicine and healthcare.
Nature Biomedical Engineering, 1–17.
Liberzon, A., Subramanian, A., Pinchback, R.,
Thorvaldsdóttir, H., Tamayo, P., & Mesirov, J. P.
(2011). Molecular signatures database (MSigDB) 3.0.
Bioinformatics, 27(12), 1739–1740.
https://doi.org/10.1093/bioinformatics/btr260
Liu, J., Tran, V., Vemuri, V. N. P., Byrne, A., Borja, M.,
Kim, Y. J., Agarwal, S., Wang, R., Awayan, K., Murti,
A., Taychameekiatchai, A., Wang, B., Emanuel, G., He,
J., Haliburton, J., Oliveira Pisco, A., & Neff, N. F.
(2022). Concordance of MERFISH spatial
transcriptomics with bulk and single-cell RNA
sequencing. Life Science Alliance, 6(1), e202201701.
https://doi.org/10.26508/lsa.202201701
Liu, Z., Zhou, Z., Dang, Q., Xu, H., Lv, J., Li, H., & Han,
X. (2022). Immunosuppression in tumor immune
microenvironment and its optimization from CAR-T
cell therapy. Theranostics, 12(14), 6273.
McInnes, L., Healy, J., & Astels, S. (2017). hdbscan:
Hierarchical density based clustering. Journal of Open
Source Software, 2(11), 205.
https://doi.org/10.21105/joss.00205
McInnes, L., Healy, J., Saul, N., & Großberger, L. (2018).
UMAP: Uniform Manifold Approximation and
Projection. Journal of Open Source Software, 3(29),
861. https://doi.org/10.21105/joss.00861
Monjo, T., Koido, M., Nagasawa, S., Suzuki, Y., &
Kamatani, Y. (2022). Efficient prediction of a spatial
transcriptomics profile better characterizes breast
cancer tissue sections without costly experimentation.
Scientific Reports, 12(1), 4133.
https://doi.org/10.1038/s41598-022-07685-4
Moses, L., & Pachter, L. (2022). Museum of spatial
transcriptomics. Nature Methods, 19(5), 534–546.
https://doi.org/10.1038/s41592-022-01409-2
Pai, S. G., Carneiro, B. A., Mota, J. M., Costa, R., Leite, C.
A., Barroso-Sousa, R., Kaplan, J. B., Chae, Y. K., &
Giles, F. J. (2017). Wnt/beta-catenin pathway:
Modulating anticancer immune response. Journal of
Hematology & Oncology, 10(1), 101.
https://doi.org/10.1186/s13045-017-0471-6
Peng, Z., Ye, M., Ding, H., Feng, Z., & Hu, K. (2022).
Spatial transcriptomics atlas reveals the crosstalk
between cancer-associated fibroblasts and tumor
microenvironment components in colorectal cancer.
Journal of Translational Medicine, 20(1), 302.
https://doi.org/10.1186/s12967-022-03510-8
Qiu, J., Chen, Q., Dong, Y., Zhang, J., Yang, H., Ding, M.,
Wang, K., & Tang, J. (2020). Gcc: Graph contrastive
coding for graph neural network pre-training.
Proceedings of the 26th ACM SIGKDD International
Conference on Knowledge Discovery & Data Mining,
1150–1160.
Raju, A., Yao, J., Haq, M. M., Jonnagaddala, J., & Huang,
J. (2020). Graph Attention Multi-instance Learning for
Accurate Colorectal Cancer Staging. Medical Image
Computing and Computer Assisted Intervention –
MICCAI 2020: 23rd International Conference, Lima,
Peru, October 4–8, 2020, Proceedings, Part V, 529–
539. https://doi.org/10.1007/978-3-030-59722-1_51
Reddy, R., Reddy, R., Sharma, C., Jackson, C., Palisoul, S.,
Barney, R., Kolling, F., Salas, L., Christensen, B.,
Brooks, G., Tsongalis, G., Vaickus, L., & Levy, J.
Feasibility of Inferring Spatial Transcriptomics from Single-Cell Histological Patterns for Studying Colon Cancer Tumor Heterogeneity
457

(2022). Graph Neural Networks Ameliorate Potential
Impacts of Imprecise Large-Scale Autonomous
Immunofluorescence Labeling of Immune Cells on
Whole Slide Images. Proceedings of the First
International Workshop on Geometric Deep Learning
in Medical Image Analysis, 15–33.
https://proceedings.mlr.press/v194/reddy22a.html
Rosasco, M. G., Ho, C.-S., Luo, T., Stein, M. M., Lonini,
L., Stumpe, M. C., Venkataraman, J., Khare, S., &
Salahudeen, A. A. (2023). Abstract 4692: Comparison
of interassay similarity and cellular deconvolution in
spatial transcriptomics data using Visum CytAssist.
Cancer Research, 83(7_Supplement), 4692.
https://doi.org/10.1158/1538-7445.AM2023-4692
Saad, R. S., Ghorab, Z., Khalifa, M. A., & Xu, M. (2011).
CDX2 as a marker for intestinal differentiation: Its
utility and limitations. World Journal of
Gastrointestinal Surgery, 3(11), 159–166.
https://doi.org/10.4240/wjgs.v3.i11.159
Siegel, R. L., Miller, K. D., Goding Sauer, A., Fedewa, S.
A., Butterly, L. F., Anderson, J. C., Cercek, A., Smith,
R. A., & Jemal, A. (2020). Colorectal cancer statistics,
2020. CA: A Cancer Journal for Clinicians, 70(3), 145–
164.
Siegel, R. L., Miller, K. D., Wagle, N. S., & Jemal, A.
(2023). Cancer statistics, 2023. CA: A Cancer Journal
for Clinicians, 73(1), 17–48. https://doi.org/1
0.3322/caac.21763
Srinivasan, G., Davis, M., LeBoeuf, M., Fatemi, M., Azher,
Z., Lu, Y., Diallo, A., Montivero, M. S., Kolling, F.,
Perrard, L., Salas, L., Christensen, B., Palisoul, S.,
Tsongalis, G., Vaickus, L., Preum, S., & Levy, J.
(2023). Potential to Enhance Large Scale Molecular
Assessments of Skin Photoaging through Virtual
Inference of Spatial Transcriptomics from Routine
Staining (p. 2023.07.30.551188). bioRxiv.
https://doi.org/10.1101/2023.07.30.551188
Subramanian, A., Tamayo, P., Mootha, V. K., Mukherjee,
S., Ebert, B. L., Gillette, M. A., Paulovich, A.,
Pomeroy, S. L., Golub, T. R., Lander, E. S., & Mesirov,
J. P. (2005). Gene set enrichment analysis: A
knowledge-based approach for interpreting genome-
wide expression profiles. Proceedings of the National
Academy of Sciences, 102(43), 15545–15550.
https://doi.org/10.1073/pnas.0506580102
Sun, S., Zhu, J., & Zhou, X. (2020). Statistical analysis of
spatial expression patterns for spatially resolved
transcriptomic studies. Nature Methods, 17(2), Article
2. https://doi.org/10.1038/s41592-019-0701-7
Tarazona, N., Gimeno-Valiente, F., Gambardella, V.,
Huerta, M., Roselló, S., Zuniga, S., Calon, A.,
Carbonell-Asins, J. A., Fontana, E., Martinez-
Ciarpaglini, C., Eason, K., Rentero-Garrido, P., Fleitas,
T., Papaccio, F., Moro-Valdezate, D., Nyamundanda,
G., Castillo, J., Espí, A., Sadanandam, A., …
Cervantes, A. (2020). Detection of postoperative
plasma circulating tumour DNA and lack of CDX2
expression as markers of recurrence in patients with
localised colon cancer. ESMO Open, 5(5), e000847.
https://doi.org/10.1136/esmoopen-2020-000847
Veličković, P., Cucurull, G., Casanova, A., Romero, A.,
Liò, P., & Bengio, Y. (2018). Graph Attention
Networks. arXiv:1710.10903 [Cs, Stat].
http://arxiv.org/abs/1710.10903
Villani, C. (2009). Optimal Transport (Vol. 338). Springer
Berlin Heidelberg. https://doi.org/10.1007/978-3-540-
71050-9
Vuola, A. O., Akram, S. U., & Kannala, J. (2019). Mask-
RCNN and U-Net Ensembled for Nuclei Segmentation.
2019 IEEE 16th International Symposium on
Biomedical Imaging (ISBI 2019), 208–212.
https://doi.org/10.1109/ISBI.2019.8759574
Wang, F., Long, J., Li, L., Wu, Z.-X., Da, T.-T., Wang, X.-
Q., Huang, C., Jiang, Y.-H., Yao, X.-Q., Ma, H.-Q.,
Lian, Z.-X., Zhao, Z.-B., & Cao, J. (2023). Single-cell
and spatial transcriptome analysis reveals the cellular
heterogeneity of liver metastatic colorectal cancer.
Science Advances, 9(24), eadf5464.
https://doi.org/10.1126/sciadv.adf5464
Wang, X., Barrera, C., Bera, K., Viswanathan, V. S.,
Azarianpour-Esfahani, S., Koyuncu, C., Velu, P.,
Feldman, M. D., Yang, M., Fu, P., Schalper, K. A.,
Mahdi, H., Lu, C., Velcheti, V., & Madabhushi, A.
(2022). Spatial interplay patterns of cancer nuclei and
tumor-infiltrating lymphocytes (TILs) predict clinical
benefit for immune checkpoint inhibitors. Science
Advances, 8(22), eabn3966. https://doi.org/10.112
6/sciadv.abn3966
Xie, Z., Bailey, A., Kuleshov, M. V., Clarke, D. J. B.,
Evangelista, J. E., Jenkins, S. L., Lachmann, A.,
Wojciechowicz, M. L., Kropiwnicki, E., Jagodnik, K.
M., Jeon, M., & Ma’ayan, A. (2021). Gene Set
Knowledge Discovery with Enrichr. Current Protocols,
1(3), e90. https://doi.org/10.1002/cpz1.90
Yang, L., Li, A., Lei, Q., & Zhang, Y. (2019). Tumor-
intrinsic signaling pathways: Key roles in the regulation
of the immunosuppressive tumor microenvironment.
Journal of Hematology & Oncology, 12(1), 125.
https://doi.org/10.1186/s13045-019-0804-8
Zeng, Y., Wei, Z., Yu, W., Yin, R., Yuan, Y., Li, B., Tang,
Z., Lu, Y., & Yang, Y. (2022). Spatial transcriptomics
prediction from histology jointly through Transformer
and graph neural networks. Briefings in Bioinformatics,
23(5), bbac297. https://doi.org/10.1093/bib/bbac297
Zhu, Y., Xu, Y., Liu, Q., & Wu, S. (2021). An empirical
study of graph contrastive learning. arXiv Preprint
arXiv:2109.01116.
APPENDIX
Appendix materials can be found at:
https://zenodo.org/records/14538826.
BIOINFORMATICS 2025 - 16th International Conference on Bioinformatics Models, Methods and Algorithms
458
