
Analyzing Male Depression Using Empirical Mode Decomposition
Xavier S
´
anchez Corrales
1,2 a
, Jordi Sol
´
e-Casals
2,3 b
, Enrique Arroyo Garc
´
ıa
4 c
and Diego Palao Vidal
4 d
1
Researcher, Mental Health Department, Consorci Corporaci
´
o Sanit
`
aria Parc Taul
´
ı, Sabadell, Barcelona, Spain
2
Data and Signal Processing Research Group, University of Vic–Central University of Catalonia, Vic, Spain
3
Department of Psychiatry, University of Cambridge, Cambridge, U.K.
4
Consorci Corporaci
´
o Sanit
`
aria Parc Taul
´
ı, Sabadell, Barcelona, Spain
Keywords:
Depression, IMF (Intrinsic Mode Functions), EMD (Empirical Mode Decomposition), Bootstrapping,
Gaussian Kernel.
Abstract:
This study investigates the differences in male voice between healthy individuals and individuals with depres-
sion, using Empirical Mode Decomposition (EMD) analysis. Voice recordings from 25 men with depression
and 76 without were analyzed. The methodology consisted of extracting 16 Intrinsic Mode Functions (IMFs)
from 20-second voice segments, followed by statistical analyses including bootstrapping of means and stan-
dard deviations with False Discovery Rate (FDR) correction, comparison of probability density functions,
and the application of a Gaussian kernel. The results showed significant differences between the means and
standard deviations, The application of the Gaussian kernel revealed more pronounced differences in IMFs 2
to 6, providing more specific discrimination than traditional statistical methods. The study contributes to the
development of non-invasive and objective diagnostic tools for depression.
1 INTRODUCTION
Depression is a widespread mental health disorder
that affects millions of people worldwide. Tradition-
ally, its identification and monitoring has been based
on subjective methods such as clinical interviews and
standardized questionnaires. However, there is a
growing need to develop more objective and quantifi-
able assessment tools.
Speech processing has been widely applied in var-
ious health-related fields, including the diagnosis of
sleep apnoea (Sol
´
e-Casals et al., 2014), early detec-
tion of Alzheimer’s disease (L
´
opez-de Ipi
˜
na et al.,
2015; Lopez-de Ipi
˜
na et al., 2015), Parkinson’s dis-
ease (Mekyska et al., 2018), and stroke recovery
through brain-computer interfaces (Tong et al., 2023).
Additional examples and applications can be found
in the works of Sol
´
e-Casals et al. (2010) and Es-
posito et al. (2016). Despite these advancements,
research in the field of mental health remains rela-
a
https://orcid.org/0009-0002-4335-6851
b
https://orcid.org/0000-0002-6534-1979
c
https://orcid.org/0000-0002-3323-6568
d
https://orcid.org/0009-0009-8937-3623
tively limited. Within this context, voice analysis has
emerged as a promising tool for the detection and
evaluation of mental disorders, including depression
(Krishnan et al., 2021; Akkaralaertsest and Yingth-
awornsuk, 2019; Alghowinem et al., 2013; Espinola
et al., 2022).
Our study focuses on voice signal analysis to dif-
ferentiate between men with depression and those
who are healthy, using Empirical Mode Decompo-
sition (EMD). Due to space limitations, this study
will focus solely on the male sample. In future stud-
ies, we will address the analysis of the female sam-
ple, considering the comparison between both. This
method, based on the Hilbert-Huang Transform (Liu
et al., 2020), is particularly well-suited for the anal-
ysis of nonlinear and non-stationary signals such as
voice (Chen et al., 2021). EMD decomposes the sig-
nal, the raw signal in our case, into Intrinsic Mode
Functions (IMFs); this method is used to separate the
voice into modes from which differentiable character-
istics between depression and health can be extracted
(Sharma et al., 2017).
The primary objective of this study is to iden-
tify the most representative Intrinsic Mode Functions
(IMFs) in the depressive voice of men by comparing
886
Corrales, X. S., Solé-Casals, J., García, E. A. and Vidal, D. P.
Analyzing Male Depression Using Empirical Mode Decomposition.
DOI: 10.5220/0013157600003911
Paper published under CC license (CC BY-NC-ND 4.0)
In Proceedings of the 18th International Joint Conference on Biomedical Engineering Systems and Technologies (BIOSTEC 2025) - Volume 1, pages 886-892
ISBN: 978-989-758-731-3; ISSN: 2184-4305
Proceedings Copyright © 2025 by SCITEPRESS – Science and Technology Publications, Lda.

the probability density in the distributions of IMFs be-
tween the depression and healthy groups. This study
contributes to the identification of differentiable char-
acteristics in the male voice through the evaluation of
IMFs. Firstly, the most important statistical features
for extracting these characteristics from voice data are
identified. Then, the statistical feature that shows sig-
nificant differences based on its distribution density is
compared. Finally, the data are filtered using a kernel
that considers this statistical feature (sigma) as a filter
for extracting the characteristics.
We must take into account that, the real-time ap-
plicability represents a significant advancement in the
clinical and hospital setting, as it allows for the col-
lection and processing of voice signals on-site, di-
rectly during the interaction between the patient and
the healthcare professional. This type of immediate
processing could facilitate faster and more accurate
diagnoses without the need for advanced equipment
or prolonged waiting times for analysis. Instead of
relying on remote servers or lengthy processing times
required by Deep Learning models, an EMD-based
system could analyze the vocal characteristics of the
patient within seconds, contributing to faster clini-
cal decisions, optimizing care, and improving over-
all efficiency in high-demand settings such as hospi-
tals or medical consultations. According to the study
of Tasnim and Novikova (2022), the use of Deep
Learning features only resulted in a marginal per-
formance improvement (0.0004%), while consuming
1000 times more memory and 3000 times more com-
putation time compared to Machine Learning mod-
els, like the Gaussian kernel approach we used in this
study. This could have significant implications for
rapid and efficient diagnosis in clinical settings.
Our hypothesis is that statistical analysis and the
Gaussian distribution of IMFs will provide robust fea-
tures for identifying differences, and that these fea-
tures will help effectively classify between the voices
of subjects with depression and those who are healthy.
This study aims to contribute to the development
of non-invasive and objective assessment tools for de-
tecting and monitoring depression in clinical settings,
advancing the understanding of voice characteristics
associated with depression in men. The way to con-
tribute knowledge to this field is by aiding in the iden-
tification of differentiable classification characteris-
tics in voice using a model based on a Gaussian ker-
nel.
2 METHODOLOGY
The data used in this study come from the Dis-
tress Analysis Interview Corpus (DAIC) at the Uni-
versity of Southern California (Gratch et al., 2014).
Data download was conducted following the ethical
protocol established by the university, adhering to
anonymization standards to protect the participants
identities.
The data segmentation was performed over the to-
tal length of the voice data for each group individu-
ally, dividing it into 20-second segments, which were
subsequently randomised. The inclusion of more than
one voice in a single segment was not considered.
This methodology ensures that potential uncontrolled
variables in the voice do not interfere with the study.
Our methodological approach involves extracting 16
IMFs from each 20-second voice segment, followed
by statistical analysis that includes bootstrapping cal-
culations with the statistics of mean, median, standard
deviation, kurtosis, and skewness, corrected with the
False Discovery Rate (FDR) method. We also per-
formed a probability density function analysis of the
IMFs comparing the depression and healthy groups,
and conducted comparisons between both groups us-
ing a Gaussian kernel.
To clearly and concisely illustrate the methodol-
ogy employed in this study, a flowchart is presented
in Fig. 1.
From this database, we used the male voice
data files, totaling 101 wav files. Of these, 25
are from men with depression and 76 are from
men without depression (healthy). The depression
identification was based on results from the PHQ-
8 (Patient Health Questionnaire depression scale)
(Kroenke et al., 2009).
The data were downloaded from the aforemen-
tioned source (DAIC) in an Excel file for diagnostic
differentiation. After separating the depression and
healthy data, silence longer than 0.5 seconds was re-
moved, and all recordings were consolidated into a
single file. The voice recordings from the depression
group amounted to 20 minutes and 35 seconds, while
the healthy group data totaled 1 hour and 00 seconds.
Silence removal was performed using the open-source
program Audacity version 3.5.1 (Audacity, 2023).
The original voice signal was recorded at a sam-
pling frequency of 16 kHz. However, upon analyzing
the spectrograms, it was observed that the relevant
content of the signal did not exceed 10 kHz in any
case. Given that processing data at 16 kHz incurs a
high computational cost, the sampling frequency was
reduced to 10 kHz. This reduction was performed
using the Librosa library (version 0.10.1) in Python
Analyzing Male Depression Using Empirical Mode Decomposition
887
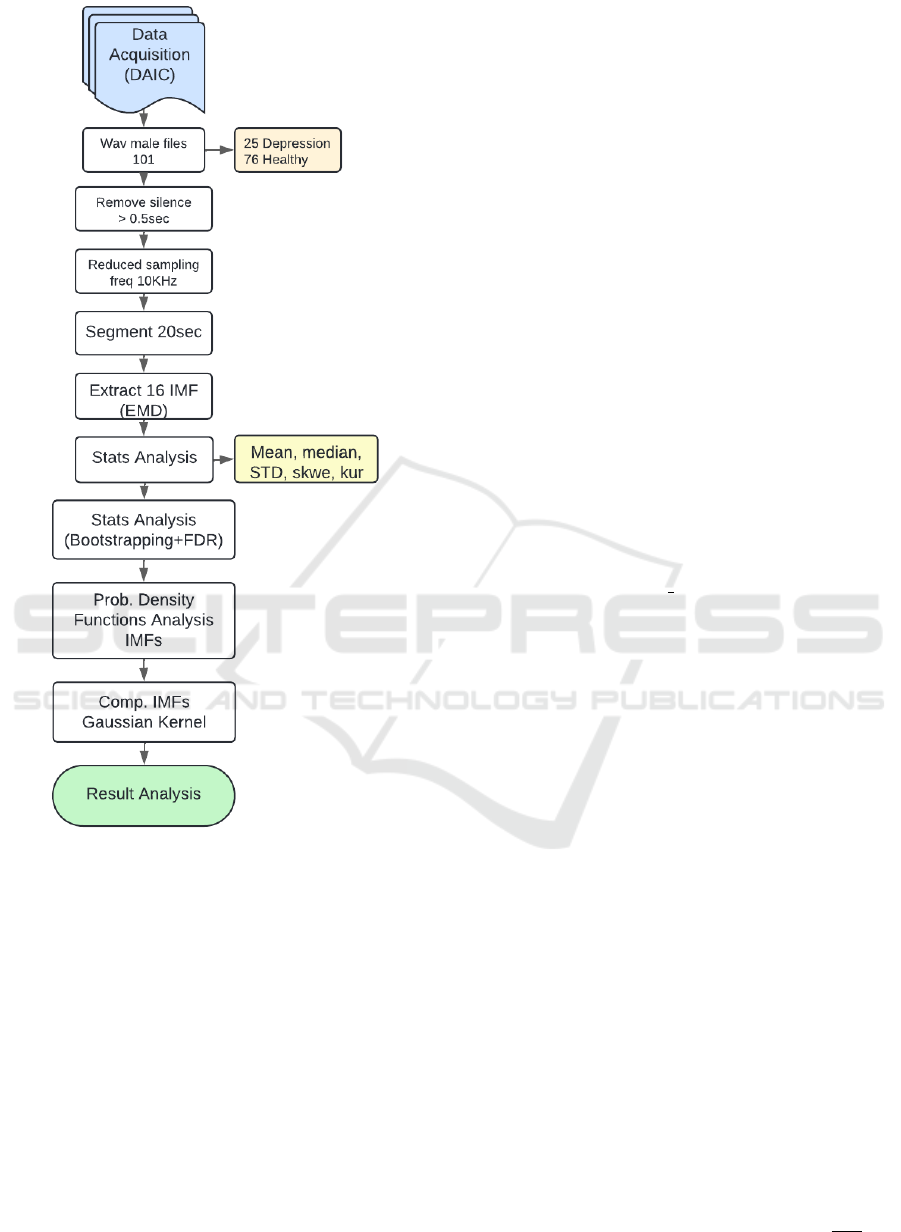
Figure 1: Flowchart of the methodological procedure used
in this study. In statistical analysis, STD refers to standard
deviation, Skew to skewness, and Kur to kurtosis.
(version 3.11.9), which is the programming environ-
ment used for all analysis in this study. This opti-
mization allowed for more efficient processing with-
out loss of information in the voice signal. During the
frequency reduction, the procedure with the Librosa
library also performed a min-max normalization to
the range [-1, 1].
Next, both audio files (depression and healthy)
were segmented into 20-second parts. The audio
from the depression group was divided into 62 20-
second segments, and after discarding the last one
due to its smaller size after the cut, 61 segments re-
mained. For the healthy group, 179 segments were
initially obtained, and after applying the same pro-
cedure, 178 segments were retained. Both groups of
segments, depression and healthy, were randomized
individually. From these two voice groups, 16 Intrin-
sic Mode Functions (IMFs) were extracted from each
20-second signal.
For this, Empirical Mode Decomposition (EMD)
was used from the library of the same name in the
open-source programming language Python (version
3.11.9). The number of IMFs was determined by
stopping the extraction of modes when the informa-
tion in the last IMF was practically flat.
Next, we performed a comparison of means, stan-
dard deviations, kurtosis, and skewness of the 16
IMFs using the bootstrapping method for depression
and healthy groups. For this, the statistics for each
vector corresponding to a 20-second voice segment
(depression n = 61, healthy n = 178) were calculated
for each IMF (n = 16), resulting in a matrix of (61,
16) for the depression group and a matrix of (178, 16)
for the healthy group.
On these matrices, we performed bootstrapping
calculations comparing the aforementioned statistics
of the first IMF from the depression group with the
first IMF from the healthy group, and so on for each
IMF. In this process, the number of iterations in the
bootstrapping method (n iterations) was set to 10,000.
Subsequently, the False Discovery Rate (FDR)
method was applied to the 16 p-values resulting from
each statistic to control for the possibility of false pos-
itives among all significant results. In biological sig-
nal data such as voice, which can be inherently vari-
able and not always follow a normal distribution, the
bootstrapping method with FDR correction provides
a more robust and conservative approach, as reflected
in Fig. 2.
Next, to compare the probability density func-
tion estimates between depression and healthy groups
across different IMFs, we plotted the mean and stan-
dard deviation statistics for each IMF, comparing de-
pression (dark bar) with healthy (light bar). The re-
sults can be seen in Fig. 3.
Subsequently, a Gaussian kernel was applied. In
equation (1), we can see the equation applied directly
to the data derived from the Empirical Mode Decom-
position, specifically the Intrinsic Mode Functions
(IMFs). Where x and x’ in the formula, represent spe-
cific points in these IMFs that are being compared (for
example: x represents the points of IMF1 from the de-
pression group and x’ the points of the same IMF in
the healthy group). The comparison is made at each
point of the IMFs, and then the average of all the point
similarities is taken for each particular IMF.
K(x, x
′
) = exp
−γ∥x − x
′
∥
2
, where γ =
1
2σ
2
(1)
BIOSIGNALS 2025 - 18th International Conference on Bio-inspired Systems and Signal Processing
888
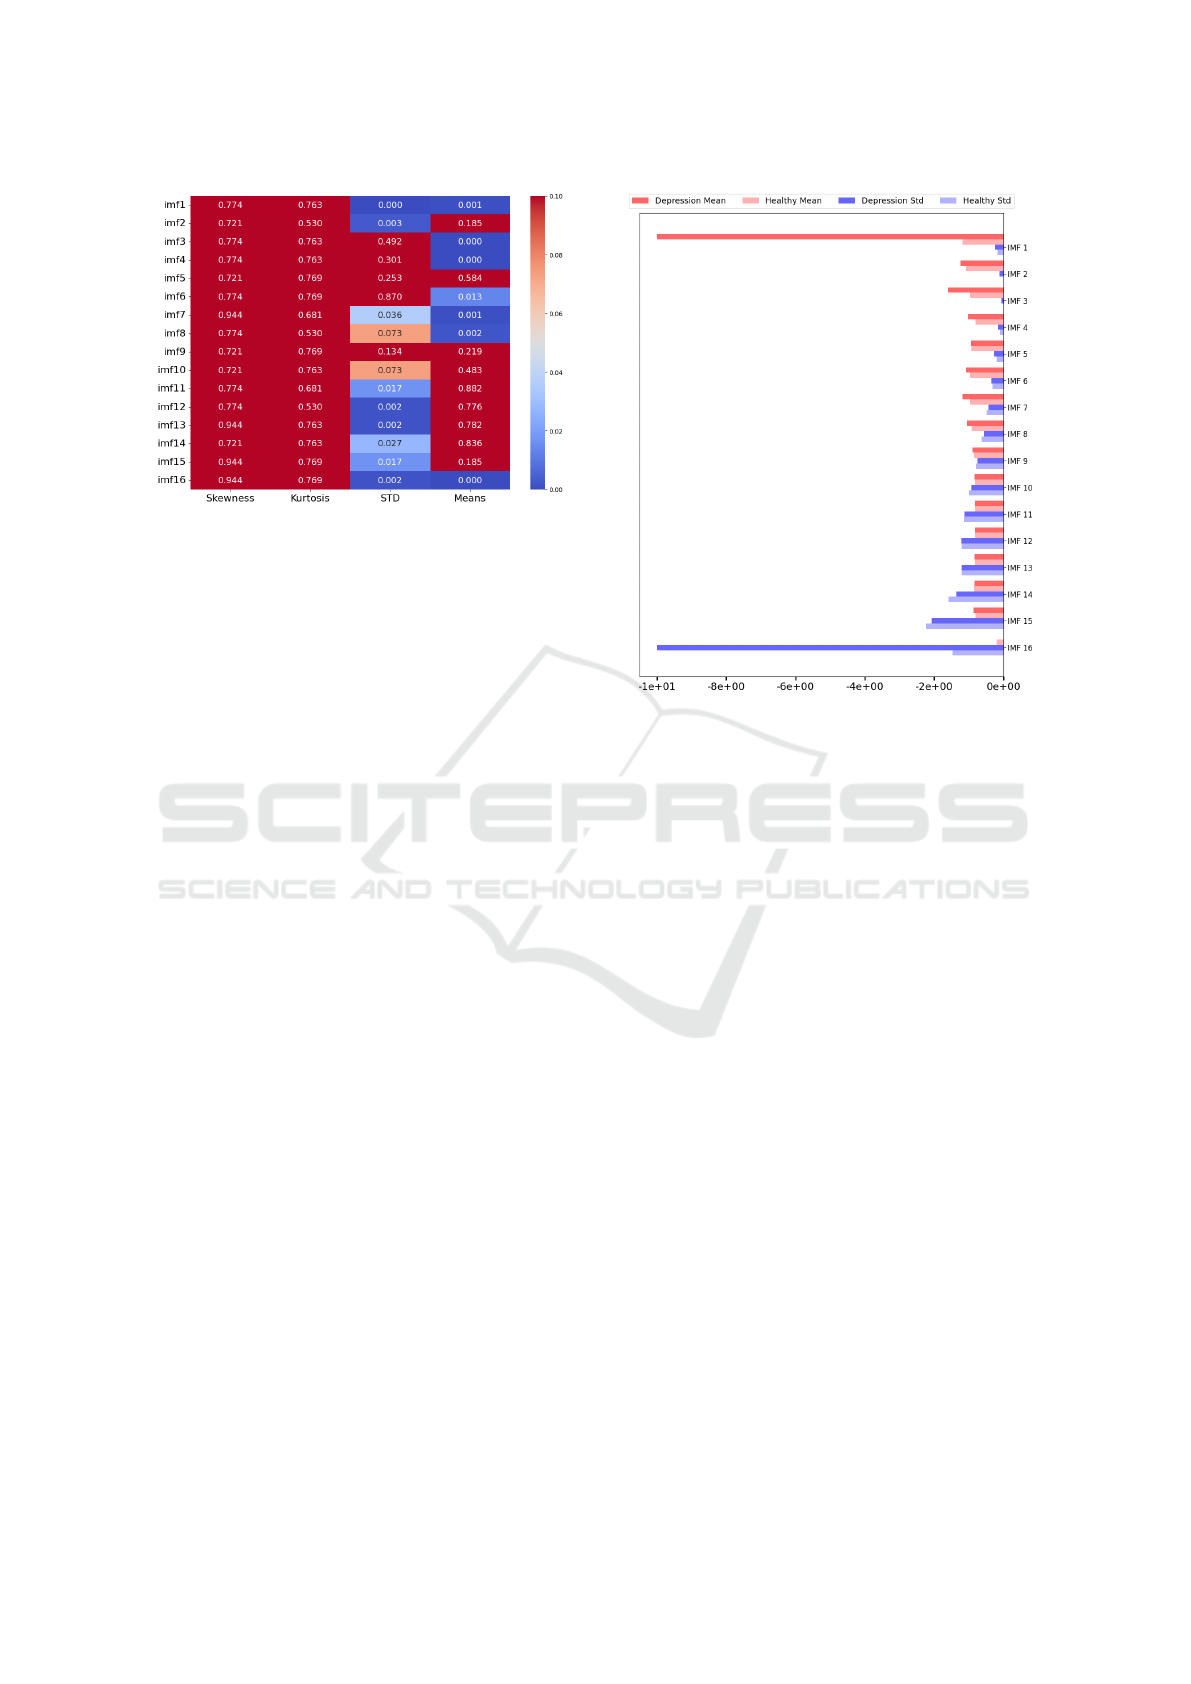
Figure 2: Heatmap of p-values (p < 0.05 in blue) from
applying bootstrapping to statistics with FDR correction.
This kernel works by applying a convolutional fil-
ter to each point in the signal, thereby smoothing the
signal without affecting its significant patterns.
The purpose of this type of kernel is to find dis-
tribution similarities between the elements (points)
of the IMFs. In our case, we compared the IMFs
from the depression group with those from the healthy
group, as obtained from the Empirical Mode Decom-
position. The results are shown in Fig. 3.
3 RESULTS
The results of the statistical comparisons with boot-
strapping corrected using the False Discovery Rate
method (Fig. 2). indicate significant differences in the
means of the first 8 IMFs and the last IMF between
depression and healthy groups, except for IMF 2 and
IMF 5.
For standard deviations, differences are observed
in the first two IMFs, IMF 7, and from IMF 11 on-
wards. The relationship between the comparisons of
means and standard deviations appears to be inverse;
up to the midpoint of the IMFs, the means show sig-
nificant differences (p value < 0.05), except for IMFs
2, 5, and 16. In contrast, significant differences in
standard deviations are seen in the higher IMFs, ex-
cept for IMF 1 and IMF 2. Notably, both IMF 1 and
IMF 16 show significant differences between depres-
sion and healthy groups in both statistics. In compar-
isons of kurtosis and skewness using the bootstrap-
ping method, we did not find significant differences
in p-values for any IMF.
The probability density functions of the means of
the IMFs (Fig. 3) show differences between the prob-
abilities of the IMFs in depression and healthy groups,
with an inverse relationship between means and stan-
Figure 3: Comparisons of the mean and std probability den-
sity function between depression and health of the IMFs.
dard deviations. Despite being on a logarithmic scale,
the present graph includes some bars with values so
close to zero that they are not visible.
For the means, density significantly decreases af-
ter IMF 1 and then decreases more gradually, with
more pronounced differences in density probabilities
between depression and healthy groups in the first
IMFs, which stabilize from IMF 9 onwards. Con-
versely, for standard deviations, density progressively
increases in the IMFs, with generally less significant
inequalities between depression and healthy groups,
except in the last IMF.
The results of applying the Gaussian kernel, ac-
cording to equation (1) and shown in Fig. 4, high-
light significant differences between depression and
healthy groups in the first 7 IMFs. These differences
are most pronounced from IMF 2 to IMF 6, inclu-
sive. From IMF 7 onwards, the similarity between
the IMFs is very high.
4 DISCUSSION
As has been verified in other studies such as Krish-
nan et al. (2021) or Liu et al. (2020), in the compari-
son of IMFs, the first (high-frequency) IMFs are more
important for differentiating characteristics. Accord-
ing to our data, the means are a more reliable statistic
than the standard deviations for the first IMFs. Con-
Analyzing Male Depression Using Empirical Mode Decomposition
889
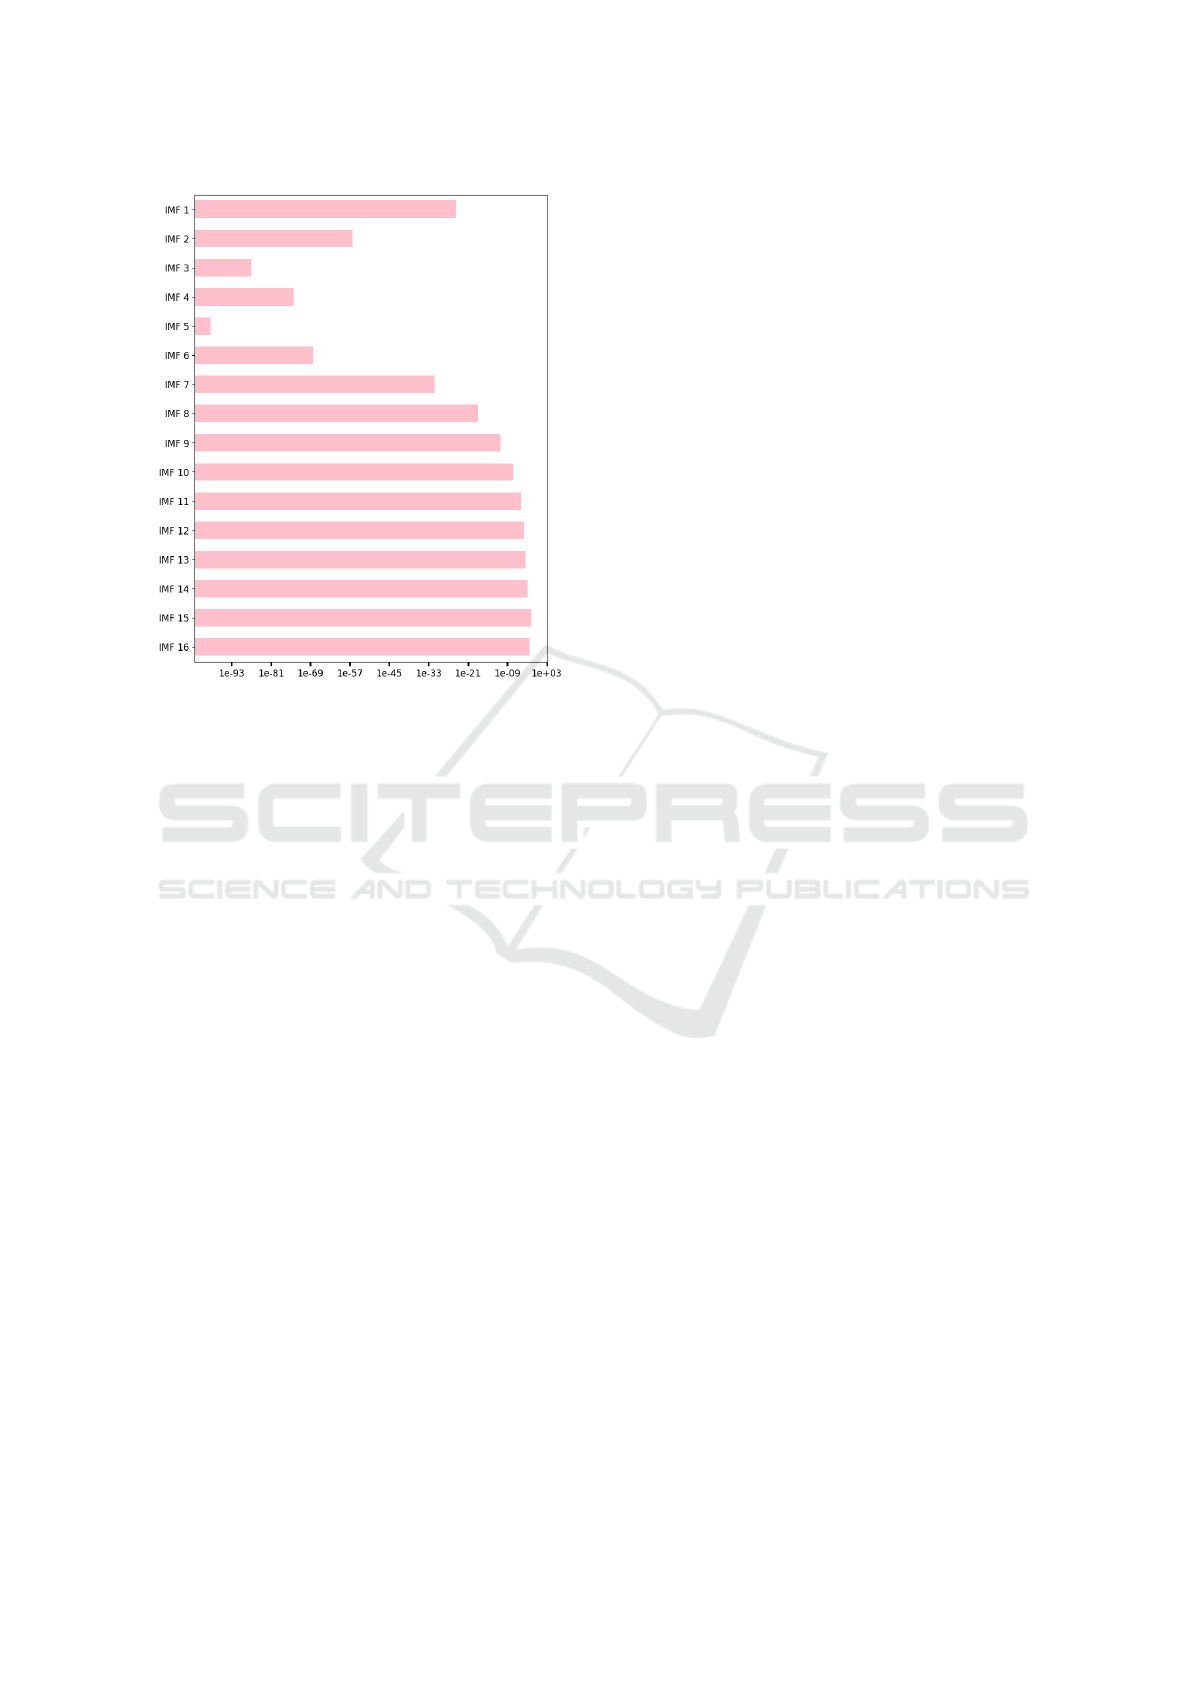
Figure 4: Comparison of similarities in the distributions of
IMFs between depression and health applying the Gaussian
kernel, with the x-axis presented on a logarithmic scale.
versely, the standard deviations are less reliable in this
case. This is because as the IMF increases, the em-
pirical decomposition data approaches zero, and our
standard deviation data, as shown in Fig. 3, deviates
from zero. This indicates a greater dispersion of the
data, which does not effectively discriminate between
depression and healthy groups.
The differences between groups in the means for
IMF 1 may be due to low frequencies in the voices of
individuals with depression overlapping with noise,
which is more common in this IMF during the initial
phase of Empirical Mode Decomposition (EMD).
In the last IMF, the dispersion of data in the de-
pression group might increase the likelihood that the
trend toward low frequencies in the voices of individ-
uals with depression results in a higher probability of
belonging to this data range.
The results regarding the comparison of proba-
bility density indicate a more stable discrimination
of mean distributions across the first IMFs compared
to standard deviations in the depression and healthy
groups. The use of means in identifying differences
appears to be more robust. In comparisons of stan-
dard deviation distributions, the distribution does not
seem to be a discriminative criterion. The probability
density functions of the means of the IMFs in differ-
entiating between depression and healthy characteris-
tics reflect a situation similar to that found with the
bootstrapping method corrected.
By examining the results in Fig.2 and Fig.3 and
comparing them with those from the Gaussian kernel
application in Fig. 4, we see that the Gaussian kernel,
by simulating a ’locally weighted mean’, is able to
extract differences more specifically than the mean or
standard deviation with the bootstrapping method or
density distributions.
In the kernel, the standard deviation controls the
extent of this influence: a small sigma considers only
the closest neighbors, preserving more details but
with less smoothing, while a large sigma covers a
broader region, resulting in more intense smoothing
that removes more noise but also more fine details.
In this way, by adjusting sigma, a balance can be
achieved between noise reduction and the preserva-
tion of important features in the signal.
The analysis using various methods, particularly
the Gaussian kernel approach, reveals significant dif-
ferences between depression and healthy states in the
first 7 IMFs of voice data in men. This method proves
more effective than simple means or standard devia-
tions in discriminating between these groups, espe-
cially for IMFs 2 through 6. These differences in
IMFs could reflect subtle changes in voice charac-
teristics associated with depression in men. For in-
stance, the first IMFs (1-3) might represent changes
in high-frequency components of the voice, possibly
indicating alterations in speech clarity or crispness in
depressed men. The intermediate IMFs (4-6) could
capture modifications in the mid-frequency range, po-
tentially related to changes in pitch and voice modula-
tion, which are often described as more monotonous
in depression. Lastly, IMF 7 might reflect varia-
tions in low-frequency components, possibly associ-
ated with changes in speech rhythm or cadence, which
tend to be slower in depressive states.
However, it is crucial to note that whilst these
mathematical differences are evident, the study lacks
a detailed explanation of how these differences trans-
late into clinically actionable insights for depression
diagnosis. While identifying these statistical dispar-
ities in voice characteristics is a promising start, the
clinical utility of such findings remains unclear with-
out additional investigation. Future studies could aim
to correlate specific IMF patterns with established
diagnostic criteria for depression in men, making
the findings more relevant to real-world applications.
Moreover, there is a need to explore how these IMF
changes relate to specific symptoms of male depres-
sion, such as irritability, aggression, or social with-
drawal. Such insights could enhance the understand-
ing of how voice analysis might aid in detecting or
monitoring depression and pave the way for develop-
ing non-invasive diagnostic tools.
BIOSIGNALS 2025 - 18th International Conference on Bio-inspired Systems and Signal Processing
890

5 CONCLUSION
Due to the minimal differences in the data ranges
and the rapid variations between them, distinguish-
ing their characteristics using basic statistical calcu-
lations, such as mean and standard deviation with the
bootstrapping method, is challenging. Despite apply-
ing the FDR correction, this method remains unsta-
ble. In contrast, the distribution density of the data
is somewhat more robust; however, due to the nar-
row range of the data, it has difficulties in differen-
tiating between depressed and healthy data based on
the IMF, especially when using the standard deviation
as a statistic.
The Gaussian kernel, while not complex or com-
putationally expensive, is better at distinguishing
characteristics by accounting for variance and per-
forming local weighting through the filter. It again
highlights the first IMFs as relevant for differentiat-
ing features between depression and health.
We believe that future research should focus on
applying a more specific kernel, considering the range
and rapid fluctuations in voice data. Additionally, in-
corporating a larger database with samples from both
genders would be beneficial to analyze if there are
gender differences and whether these overlap with the
discrepancies between depression and health. In any
case, identifying depression through voice is a very
promising field where, as we have seen, we are likely
to establish a diagnostic differentiation method poten-
tially useful in digital screening of depression.
Although it is not the aim of this study, we be-
lieve that it could be interesting to compare Gaussian
analysis of IMFs with machine learning methods or
to incorporate the results into such models to test pre-
diction methods. Furthermore, the integration of this
type of diagnosis into the clinical setting would be
crucial, allowing for the real-time assessment of pa-
tients with depression in hospital environments. Ethi-
cal applicability must be considered, as it involves the
collection and analysis of patients voices, which re-
quires their consent for the collection and handling of
their voice data.
ACKNOWLEDGEMENTS
X.S.C. carried out this work as part of the PhD
programme in Experimental Sciences and Technol-
ogy at the University of Vic - Central University
of Catalonia. We would like to thank the Univer-
sity of Southern California for providing voice data
and questionnaire information, without which this re-
search would not have been possible. We finally
thank the support of the Spanish Ministry of Sci-
ence and Innovation/ISCIII/FEDER (PI21/01148));
the Secretaria d’Universitats i Recerca del Departa-
ment d’Economia i Coneixement of the Generalitat de
Catalunya (2021 SGR 01431); the CERCA program
of the I3PT; the Instituto de Salud Carlos III; and the
CIBER of Mental Health (CIBERSAM).
CONFLICT OF INTEREST
D.P. has received grants and also served as a consul-
tant or advisor for Rovi, Angelini, Janssen and Lund-
beck, with no financial or other relationship relevant
to the subject of this article. The other authors declare
no conflicts of interest.
REFERENCES
Akkaralaertsest, T. and Yingthawornsuk, T. (2019). Classi-
fication of depressed speech samples with spectral en-
ergy ratios as depression indicator. In 2019 IEEE Sym-
posium Series on Computational Intelligence (SSCI).
Alghowinem, S., Goecke, R., Wagner, M., Epps, J.,
Gedeon, T., Breakspear, M., and Parker, G. (2013).
A comparative study of different classifiers for de-
tecting depression from spontaneous speech. In 2013
IEEE International Conference on Acoustics, Speech
and Signal Processing (ICASSP), pages 8022–8026.
IEEE.
Audacity (2023). http://sourceforge.net/projects/audacity/.
(accessed 1 October 2023).
Chen, L., Wang, C., Chen, J., Xiang, Z., and Hu, X. (2021).
Voice disorder identification by using hilbert-huang
transform (hht) and k nearest neighbor (knn). Jour-
nal of Voice, 35(6):932.e1–932.e11.
Espinola, C. W., Gomes, J. C., Pereira, J. M. S., and dos
Santos, W. P. (2022). Detection of major depressive
disorder, bipolar disorder, schizophrenia and general-
ized anxiety disorder using vocal acoustic analysis and
machine learning: An exploratory study. Research on
Biomedical Engineering, 38(3):813–829.
Esposito, A., Faundez-Zanuy, M., Esposito, A. M., Cor-
dasco, G., Drugman, T., Sol
´
e-Casals, J., and Mora-
bito, F. C. (2016). Recent Advances in Nonlin-
ear Speech Processing: Directions and Challenges.
Springer.
Gratch, J., Artstein, R., Lucas, G., Stratou, G., Scherer,
S., Nazarian, A., Wood, R., Boberg, J., DeVault, D.,
Marsella, S., Traum, D., Rizzo, S., and Morency,
L.-P. (2014). The distress analysis interview corpus
of human and computer interviews. In LREC 2014
- Ninth International Conference on Language Re-
sources and Evaluation, pages 3123–3128. European
Language Resources Association (ELRA).
Krishnan, P., Joseph Raj, A., and Rajangam, V. (2021).
Emotion classification from speech signal based on
Analyzing Male Depression Using Empirical Mode Decomposition
891

empirical mode decomposition and non-linear fea-
tures: Speech emotion recognition. Complex and In-
telligent Systems, 7(4):1919–1934.
Kroenke, K., Strine, T. W., Spitzer, R. L., Williams, J.
B. W., Berry, J. T., and Mokdad, A. H. (2009).
The phq-8 as a measure of current depression in the
general population. Journal of Affective Disorders,
114(1–3):163–173.
Liu, Z., Xu, Y., Ding, Z., and Chen, Q. (2020). Time-
frequency analysis based on hilbert-huang transform
for depression recognition in speech. In 2020
IEEE International Conference on Bioinformatics and
Biomedicine (BIBM), pages 1072–1076.
Lopez-de Ipi
˜
na, K., Alonso-Hern
´
andez, J., Sol
´
e-Casals,
J., Travieso-Gonz
´
alez, C. M., Ezeiza, A., Faundez-
Zanuy, M., Calvo, P. M., and Beitia, B. (2015). Fea-
ture selection for automatic analysis of emotional re-
sponse based on nonlinear speech modeling suitable
for diagnosis of alzheimer’s disease. Neurocomput-
ing, 150:392–401.
L
´
opez-de Ipi
˜
na, K., Sol
´
e-Casals, J., Eguiraun, H., Alonso,
J. B., Travieso, C. M., Ezeiza, A., Barroso, N., Ecay-
Torres, M., Martinez-Lage, P., and Beitia, B. (2015).
Feature selection for spontaneous speech analysis to
aid in alzheimer’s disease diagnosis: A fractal di-
mension approach. Computer Speech & Language,
30(1):43–60.
Mekyska, J., Galaz, Z., Kiska, T., Zvoncak, V., Mucha, J.,
Smekal, Z., Eliasova, I., Kostalova, M., Mrackova,
M., Fiedorova, D., Faundez-Zanuy, M., Sol
´
e-Casals,
J., Gomez-Vilda, P., and Rektorova, I. (2018). Quan-
titative analysis of relationship between hypokinetic
dysarthria and the freezing of gait in parkinson’s dis-
ease. Cognitive Computation, 10(6):1006–1018.
Sharma, R., Prasanna, S. R. M., Bhukya, R. K., and Das,
R. K. (2017). Analysis of the intrinsic mode func-
tions for speaker information. Speech Communica-
tion, 91:1–16.
Sol
´
e-Casals, J., Munteanu, C., Mart
´
ın, O. C., Barb
´
e, F.,
Queipo, C., Amilibia, J., and Dur
´
an-Cantolla, J.
(2014). Detection of severe obstructive sleep ap-
nea through voice analysis. Applied Soft Computing,
23:346–354.
Sol
´
e-Casals, J., Zaiats, V., and Monte-Moreno, E. (2010).
Non-linear and non-conventional speech process-
ing: Alternative techniques. Cognitive Computation,
2:133–134.
Tasnim, M. and Novikova, J. (2022). Cost-effective mod-
els for detecting depression from speech. In Wani,
M. A., Kantardzic, M., Palade, V., Neagu, D., Yang,
L., and Chan, K. Y., editors, 2022 21ST IEEE INTER-
NATIONAL CONFERENCE ON MACHINE LEARN-
ING AND APPLICATIONS (ICMLA), pages 1687–
1694. IEEE Computer Soc.
Tong, J., Xing, Z., Wei, X., Yue, C., Dong, E., Du, S.,
Sun, Z., Sol
´
e-Casals, J., and Caiafa, C. F. (2023). To-
wards improving motor imagery brain–computer in-
terface using multimodal speech imagery. Journal of
Medical and Biological Engineering, 43(3):216–226.
BIOSIGNALS 2025 - 18th International Conference on Bio-inspired Systems and Signal Processing
892
