
Inductive Self-Supervised Dimensionality Reduction for Image Retrieval
Deryk Willyan Biotto
a
, Guilherme Henrique Jardim
b
, Vinicius Atsushi Sato Kawai
c
,
Bionda Rozin
d
, Denis Henrique Pinheiro Salvadeo
e
and Daniel Carlos Guimar
˜
aes Pedronette
f
Department of Statistics, Applied Mathematics, and Computing (DEMAC), State University of S
˜
ao Paulo (UNESP),
Rio Claro, Brazil
{deryk.biotto, guilherme.jardim, vinicius.kawai, bionda.rozin, denis.salvadeo, daniel.pedronette}@unesp.br
Keywords:
Dimensionality Reduction, Self-Supervised Learning, Neural Networks, Content-Based Image Retrieval.
Abstract:
The exponential growth of multimidia data creates a pressing need for approaches that are capable of efficiently
handling Content-Based Image Retrieval (CBIR) in large and continuosly evolving datasets. Dimensionality
reduction techniques, such as t-SNE and UMAP, have been widely used to transform high-dimensional fea-
tures into more discriminative, low-dimensional representations. These transformations improve the effec-
tiveness of retrieval systems by not only preserving but also enhancing the underlying structure of the data.
However, their transductive nature requires access to the entire dataset during the reduction process, limiting
their use in dynamic environments where data is constantly added. In this paper, we propose ISSDiR, a self-
supervised, inductive dimensionality reduction method that generalizes to unseen data, offering a practical
solution for continuously expanding datasets. Our approach integrates neural networks-based feature extrac-
tion with clustering-based pseudo-labels and introduces a hybrid loss function that combines cross-entropy
and constrastive loss, weighted by cluster distances. Extensive experiments demonstrate the competitive per-
formance of the proposed method in multiple datasets. This indicates its potential to contribute to the field of
image retrieval by introducing a novel inductive approach specifically designed for dimensionality reduction
in retrieval tasks.
1 INTRODUCTION
The exponential growth of visual data in the digital
age has driven the need for efficient Content-Based
Image Retrieval (CBIR) systems. As visual databases
continue to expand, it becomes increasingly challeng-
ing to develop methods that not only extract relevant
features from images but are also scalable and capable
of handling ever-growing datasets.
Traditionally, neural networks have been success-
fully employed for feature extraction, providing ro-
bust representations for CBIR tasks (Wan et al., 2014;
Gkelios et al., 2021). However, as datasets grow
larger, achieving high retrieval accuracy becomes in-
creasingly challenging. To address this, dimensional-
ity reduction methods, such as t-distributed Stochastic
Neighbor Embedding (t-SNE) (Van der Maaten and
a
https://orcid.org/0009-0003-4693-0510
b
https://orcid.org/0000-0001-6218-8801
c
https://orcid.org/0000-0003-0153-7910
d
https://orcid.org/0000-0002-5993-6570
e
https://orcid.org/0000-0001-8942-0033
f
https://orcid.org/0000-0002-2867-4838
Hinton, 2008) and Uniform Manifold Approxima-
tion and Projection (UMAP) (McInnes et al., 2018),
have been introduced to enhance the discriminabil-
ity of features by transforming high-dimensional data
into smaller, low-dimensional spaces. While effec-
tive, these methods rely on transductive processes that
require access to the entire dataset during dimension-
ality reduction, limiting their applicability in scenar-
ios with continuously expanding datasets.
In this context, we propose the Inductive
Self-Supervised Dimensionality Reduction (ISSDiR)
method, which leverages the generalization power of
neural networks and has the potential to efficiently
handle large-scale data. Our approach is unsupervised
and relies on training the network with pseudo-labels
generated from clusters of extracted features. We im-
plement a hybrid loss function that integrates cross-
entropy and contrastive loss, further incorporating a
weighting factor based on the distances between clus-
ters. This combination enables the network to learn
more discriminative representations in only two di-
mensions while maintaining the generalization capac-
ity for new data.
The main contributions of this work are:
Biotto, D. W., Jardim, G. H., Kawai, V. A. S., Rozin, B., Salvadeo, D. H. P. and Pedronette, D. C. G.
Inductive Self-Supervised Dimensionality Reduction for Image Retrieval.
DOI: 10.5220/0013158600003912
Paper published under CC license (CC BY-NC-ND 4.0)
In Proceedings of the 20th International Joint Conference on Computer Vision, Imaging and Computer Graphics Theory and Applications (VISIGRAPP 2025) - Volume 2: VISAPP, pages
383-391
ISBN: 978-989-758-728-3; ISSN: 2184-4321
Proceedings Copyright © 2025 by SCITEPRESS – Science and Technology Publications, Lda.
383

• Introduction of a hybrid loss function that com-
bines cross-entropy and contrastive loss, enhanc-
ing the unsupervised learning process and im-
proving the model’s ability to learn effective fea-
ture representations.
• Adaptive margin weighting based on intercluster
distances, which helps to refine contrastive loss
by assigning larger margins to more distant clus-
ters, thereby enhancing the separability between
different data clusters.
• A composite neural network architecture capable
of learning both high- and low-dimensional
embeddings simultaneously, where high-
dimensional representations serve as a richer and
more discriminative foundation for the encoder,
resulting in more effective and representative
low-dimensional embeddings.
We believe this work represents a significant
contribution in inductive dimensionality reduction,
proposing a novel approach to address existing chal-
lenges and inspire further research in the field.
2 RELATED WORK
Traditional Content-Based Image Retrieval (CBIR)
methods often rely on pairwise similarity measures,
such as Euclidean distance, applied to features ex-
tracted from CNNs or Transformer-based models (El-
Nouby et al., 2021; Kawai et al., 2024b; Li et al.,
2021). However, these methods often fall short in
capturing the intricate relationship present in high-
dimensional spaces, resulting in suboptimal retrieval
results (Leticio et al., 2024).
To address the challenges of improving re-
trieval performance in Content-Based Image Re-
trieval (CBIR), re-ranking techniques and dimen-
sionality reduction methods have been recently ex-
plored (Kawai et al., 2024a; Leticio et al., 2024). Re-
ranking approaches, such as Rank Flow Embedding
(RFE) and Log-based Hypergraph of Ranking Ref-
erences (LHRR), enhance retrieval results by refin-
ing rankings based on contextual similarities (Valem
et al., 2023; Pedronette et al., 2019). Similarly,
dimensionality reduction techniques, such as t-SNE
and UMAP, transform high-dimensional features into
compact representations, preserving key relationships
between data points (Van der Maaten and Hinton,
2008; McInnes et al., 2018). Both approaches have
shown significant gains in the quality of image re-
trieval tasks (Kawai et al., 2024a; Leticio et al., 2024).
However, both the original t-SNE and UMAP
methods are transductive approaches, which means
they require access to the entire dataset during the
dimensionality reduction process. This limitation
makes them less practical in scenarios where new
data points are continuosly added, as the embeddings
needs to be recalculated every time. To adress this
challenge, inductive approaches have been developed,
allowing models to generalize to new data without
the need to reprocess the entire dataset. For exam-
ple, Parametric UMAP (Sainburg et al., 2021), Para-
metric t-SNE (Gisbrecht et al., 2015), and Inductive
t-SNE (Roman-Rangel and Marchand-Maillet, 2019)
extend their respective methods by integrating neural
networks to learn a parametric mapping. In the case of
Inductive t-SNE, this approach has also been applied
to retrieval tasks, demonstrating its utility in scenarios
where efficient generalization to unseen data is essen-
tial.
In addition, several neural network-based ap-
proaches, such as scvis (Ding et al., 2018) and
ivis (Szubert et al., 2019), focus on capturing both
local and global data structures, with a priority on
explainability in dimensionality reduction. Self-
Supervised Network Projection (SSNP) (Espadoto
et al., 2021) enhances autoencoders with clustering-
based pseudo-labels to improve cluster separation and
enable out-of-sample projection.
In this context, our focus was on generating low-
dimensional embeddings in a novel inductive man-
ner that enhance performance in retrieval tasks, rather
than prioritizing analysis and visualization, as other
methods typically do (Van der Maaten and Hinton,
2008; McInnes et al., 2018) . The use of generated
pseudo-labels is a promising approach to improve
representation (Caron et al., 2018; Asano et al., 2020)
and we follow this principle in our work. Although
ISSDiR shares some similarities with SSNP (Es-
padoto et al., 2021), it does not rely on projection and
reconstruction systems. Instead, we employ a hybrid
loss function that enhances both the high-dimensional
representations used by the dimensionality reducer
and the separability of the low-dimensional represen-
tations. Additionally, we introduced a weighted mar-
gin adjustment based on inter-cluster distances to fur-
ther improve data separability. The low-dimensional
representations produced by our model are capable of
preserving essential features within the data and gen-
eralizing well to unseen data, making this approach
suitable for different datasets and scenarios.
3 PROPOSED METHOD
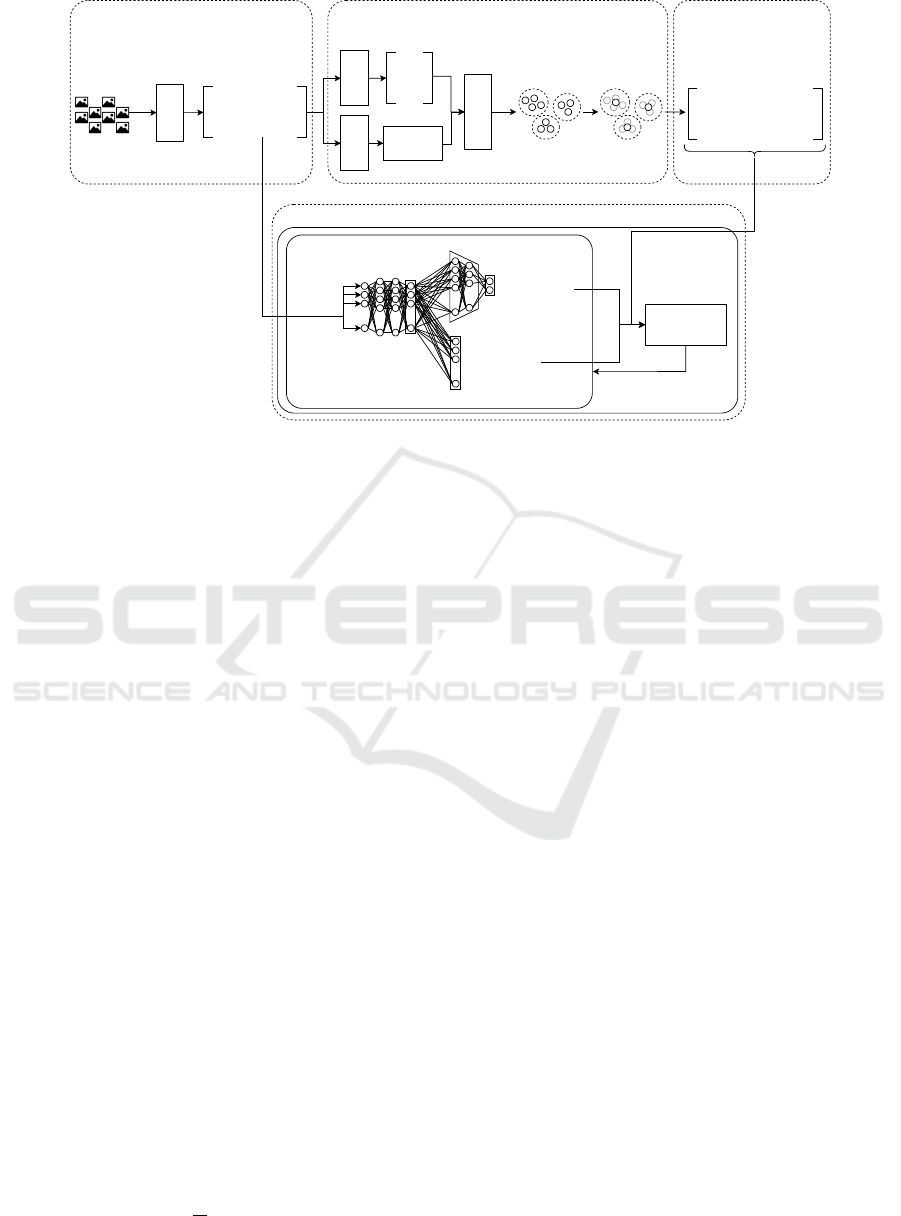
Figure 1 gives a broad overview of the ISSDiR
method. It comprises the following steps: feature ex-
VISAPP 2025 - 20th International Conference on Computer Vision Theory and Applications
384

traction; clustering and centroid computation; inter-
cluster distances based on centroids; and a neural net-
work trained through a hybrid loss function. These
steps are explained in depth through the current Sec-
tion.
3.1 Feature Extraction
In this work, we use two pre-trained deep neural
networks, DINOv2 (Oquab et al., 2023) and Con-
vNeXt (Liu et al., 2022), for feature extraction. The
selected networks have demonstrated high capability
in computer vision tasks due to their ability to capture
both local and global patterns in images.
The use of pre-trained networks allows the model
to benefit from high-quality representations, transfer-
ring the knowledge accumulated from large volumes
of data to the context of our task (Wan et al., 2014;
Gkelios et al., 2021). Obtained features ensures that
most relevant information from images are preserved
and effectively used in the next steps.
3.2 Clustering and Centroid
Computation
In this step, we use t-SNE (Van der Maaten and Hin-
ton, 2008) to reduce the dimensionality of the data,
followed by the silhouette coefficient method to de-
termine the optimal number of clusters. t-SNE aids in
processing high-dimensional data, accelerating clus-
tering and enhancing the coherence and quality of the
resulting groups. After this initial reduction, we use
the embeddings produced by UMAP (McInnes et al.,
2018) to apply the Agglomerative Clustering algo-
rithm (Chidananda Gowda and Krishna, 1978; Jain
et al., 1999), which groups samples based on their
similarities. To ensure precise clustering, we multiply
the number of clusters by 1.1 to avoid underestimat-
ing the actual number of groups.
After clustering, we compute the centroids of each
group, where each centroid is a representative point
for a cluster in the feature space, summarizing the
overall position of the group.
3.3 Intercluster Distances Based on
Centroids
Understanding the relationships between clusters in a
feature space is essential for increasing the discrimi-
native power of learned representations. A effective
method to achieve this is by considering the distances
between cluster centroids, which allows for better in-
terclass distinction. This enhanced distinction is fun-
damental for tasks such as contrastive learning.
The intercluster distances are obtained by calculat-
ing a distance matrix A by using the Euclidean Dis-
tance. Smaller values indicate closer proximity be-
tween clusters and larger values reflect greater sepa-
ration. The obtained distances are normalized to the
range [0,1], ensuring that the subsequent calculations
are not skewed by varying magnitudes of distances,
allowing for consistent comparisons between clusters
regardless of their original scale.
3.4 Neural Network and Hybrid Loss
Function
The proposed inductive learning model employs a
neural network with a hybrid loss training. The
network first produces high-dimensional embeddings,
which preserve detailed feature representations. Sub-
sequently, it reduces these embeddings to lower-
dimensional features, enabling a more compact and ef-
ficient representation. The hybrid loss function plays a
crucial role in enhancing both the discrimination of the
high-dimensional embeddings and the effectiveness of
the lower-dimensional feature representations.
3.4.1 Neural Network Architecture
Multilayer Perceptron (MLP)-based neural networks
with fully connected layers are known as universal
function approximators (Hornik et al., 1989; Chen
and Chen, 1995). Recently, fully connected layers
have gained renewed attention as an alternative to ad-
vanced architectures based on transformers and CNNs
(Ding et al., 2022; Tolstikhin et al., 2021; Tang et al.,
2022). In light of this, the proposed neural network is
a Multilayer Perceptron (MLP) consisting of multiple
fully connected layers, designed to produce two out-
puts: classification logits and reduced representations
through an encoder.
The network input consists of features extracted
from pre-trained models. The MLP generates high-
dimensional embeddings, which are simultaneously
sent to both the classification layer and the encoder.
The classification layer processes these embeddings to
generate logits corresponding to the number of clus-
ters. These logits are then passed through a log-
softmax (Goodfellow, 2016) function, and the error is
calculated using the cross-entropy component of the
hybrid loss function. This process ensures that the
MLP learns to produce more discriminative represen-
tations for the encoder.
At the same time, high-dimensional embeddings
are also fed into an encoder composed of several fully
connected layers, which reduces their dimensionality
to a 2-dimensional vector. This reduced-dimensional
representation is used to compute the contrastive loss,
Inductive Self-Supervised Dimensionality Reduction for Image Retrieval
385
(D) Neural network model, and hybrid loss function
(C) Intercluster distances
based on centroids
(B) Clustering and centroid computation(A) Feature extraction
Images
Dino or
ConvNext
Agglomerative
Clustering
Clusters
(pseudo-labels)
Centroids
Features
Distance matrix
⋮
⋮ ⋮
⋮
⋮
Base MLP layers
Encoder
Input
Feature
extraction
Output
(reduced
dimensionality)
0.05 0.80 0.10 ... 0.20
0.42 0.18 0.92 ... 0.94
... ... ... ... ...
0.83 0.42 0.82 ... 0.84
Hybrid loss
function
Backpropagation
training
UMAP
Initial dimensionality
reduction
0.18 0.72
0.91 0.28
... ...
0.01 0.83
⋮
⋮
Output
(log-softmax
classification)
0 ρ(1,2) ρ(2,3) ... ρ(1,n)
ρ(2,1) 0 ρ(2,3) ... ρ(2,n)
... ... ... ... ...
ρ(n,1) ρ(n,2) ρ(n,3) ... 0
t-SNE
Silhouette
Score
Figure 1: Overview of ISSDiR, considering the training steps.
which aims to minimize the similarity between sam-
ples within the same cluster and maximize the similar-
ity between samples from different clusters. The hy-
brid loss function, combining both the cross-entropy
and contrastive losses, allows the network to optimize
classification accuracy while improving feature dis-
crimination.
3.4.2 Hybrid Loss Function
The proposed hybrid loss function combines the cross-
entropy loss and the contrastive loss, where each
loss is weighted by a factor α ∈ [0, 1] ⊂ R. The
cross-entropy loss is applied to the log-softmax trans-
formed logits from the classification layer, adjusting
the network to generate more discriminative represen-
tations for the encoder. The contrastive loss, calcu-
lated from the reduced representations generated by
the encoder, minimizes the distance between samples
within the same cluster and maximizes the distance
between samples from different clusters, using a mar-
gin weighted by the normalized distances between
cluster centroids.
The complete definition of the hybrid loss function
is presented at the end, after the detailed explanation
of its individual components.
Cross-Entropy Loss: the cross-entropy loss L
CE
(Bishop and Nasrabadi, 2006) is used to encourage the
network to correctly classify samples according to the
pseudo-labels assigned during the clustering process.
The cross-entropy loss equation is given by:
L
CE
= −
1
N
N
∑
i=1
y
i
log( ˆy
i
), (1)
where:
• N is the number of samples in the batch.
• y
i
is the pseudo-label (cluster assignment) of sam-
ple i.
• ˆy
i
is the predicted probability distribution over
clusters output by the network for sample i.
This loss function adjusts the network parame-
ters to produce more discriminative representations
for encoder.
Weighting Factor Calculation for Adaptive Mar-
gin. The weighting factor ∆
i j
for a pair of samples
i and j, belonging to the centroids µ
i
and µ
j
, respec-
tively, is computed as:
∆
i j
=
ρ
′
(µ
i
, µ
j
) + 1
2
− 1, (2)
where ρ
′
(µ
i
, µ
j
) represents the normalized distance
between the centroids µ
i
and µ
j
. This quadratic func-
tion amplifies the effect of larger distances between
centroids, increasing the influence of greater inter-
cluster separations on the adaptive margin in the con-
trastive loss function. As the normalized distance be-
tween centroids increases, the contribution to the mar-
gin grows more significantly, enhancing the contrast
between clusters that are further apart.
Contrastive Loss with Adaptive Margin: the con-
trastive loss L
Cr
(Chopra et al., 2005; Hadsell et al.,
2006) aims to bring similar samples closer in the fea-
ture space and push dissimilar samples apart. Studies
employing contrastive functions suggest that weight-
ing the error calculation according to specific criteria
is an effective strategy to improve generalization, al-
lowing for better discrimination of subtle differences
VISAPP 2025 - 20th International Conference on Computer Vision Theory and Applications
386
(Wang et al., 2019a; Wang et al., 2019b; Fu et al.,
2021). In this work, we modified the traditional con-
trastive loss by introducing an adaptive margin m
i j
,
which depends on the distances between the cluster
centroids. The equation is given by:
L
Cr
=
1
N
N
∑
i=1
h
(1 − l
i j
)D
2
i j
+ l
i j
(max(0, m
i j
− D
i j
))
2
i
,
(3)
where:
• N is the number of samples in the batch.
• l
i j
is a binary label indicating whether samples i
and j are similar (l
i j
= 0) or dissimilar (l
i j
= 1).
• D
i j
=
z
i
− z
j
is the Euclidean distance between
the feature representations z
i
and z
j
of samples i
and j.
• m
i j
= ˜m + ∆
i j
is the adaptive margin, where ˜m
is the base margin and ∆
i j
is a weighting factor
based on the distances between cluster centroids.
The adaptive margin dynamically adjusts the sep-
aration between samples from different clusters, max-
imizing the effectiveness of contrastive learning.
Hybrid Loss Function Definition: the final hybrid
loss function is a weighted combination of the two
losses described above:
L
Total
= αL
CE
+ (1 − α)L
Cr
, (4)
where α is the weighting factor that balances the im-
portance between the classification loss and the con-
trastive loss. This balance allows the model to both
correctly classify samples and generate discrimina-
tive representations that preserve the cluster structure
in the feature space. In this study, we arbitrally set
α = 0.5, so both loss functions are equally weighted
in the equation.
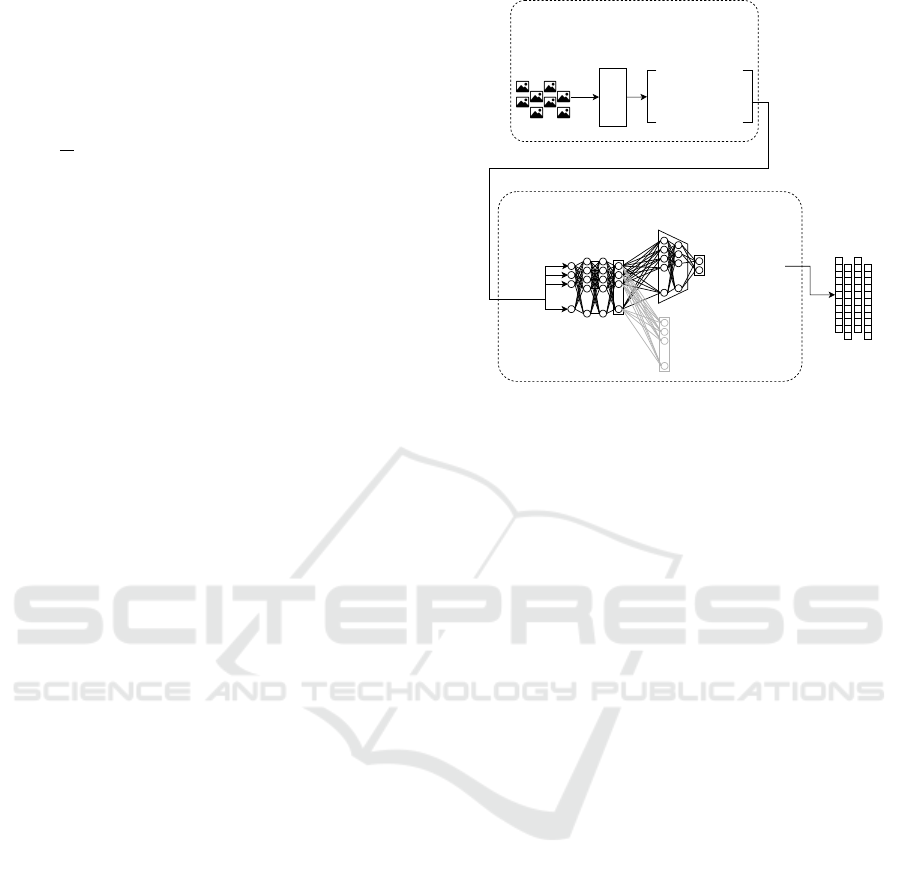
3.5 Final Inductive Model
After completing the inductive training, the neural
network model is integrated with the feature extrac-
tion model, resulting in the final inductive model.
This model is capable of generating discriminative
representations in reduced dimensions for unseen
data. To obtain these embeddings, we pass the unseen
samples through the final inductive model, producing
a set of low-dimensional embedding vectors. Figure
2 illustrates the final inductive model developed using
the proposed approach.
3.5.1 Embedding Inference
To generate embeddings for unseen data, we perform
inference using the trained inductive model. Given an
(A) Feature extraction
(B) Neural network model
Input
⋮
⋮ ⋮
⋮
⋮
Base MLP layers
Encoder
Output
(reduced
dimensionality)
⋮
⋮
Output
(log-softmax
classification)
Ranked lists
Images
Dino or
ConvNext
Features
Feature
extraction
0.05 0.80 0.10 ... 0.20
0.42 0.18 0.92 ... 0.94
... ... ... ... ...
0.83 0.42 0.82 ... 0.84
Figure 2: Final inference model. Compared to the Figure
1, it doesn’t comprise the clustering, centroid computation,
intercluster distances, and hybrid loss function steps.
unseen sample x, we pass this sample through the fea-
ture extraction component followed by the neural net-
work to obtain its corresponding embedding E. For-
mally, the embedding generation process can be de-
scribed as:
E = f
NN
( f
FE
(x)),
where f
FE
denotes the feature extraction function and
f
NN
represents the neural network of the inductive
model. By applying this process to all unseen sam-
ples, we obtain a set of low-dimensional embedding
vectors E = {E
1
, E
2
, . . . , E
m
}.
3.5.2 Ranked Lists
Finally, we generate the ranked lists for each
embedding vector, used for information retrieval
tasks (Kawai et al., 2024b). Let E = {E
1
, E
2
, ..., E
m
}
represent the set of m embedding vectors, where E
i
,
corresponds to a low-dimensional representation pro-
duced by the model. For each pair of embeddings
(E
i
, E
j
), we compute the distance δ(E
i
, E
j
), con-
structing a new matrix B of dimensions m ×m, where:
B
i j
= δ(E
i
, E
j
). (5)
Here, δ(E
i
, E
j
) denotes the distance between embed-
dings E
i
and E
j
, calculated using an appropriate dis-
tance metric such as the Euclidean distance. Based
on these distances, we create a ranked list τ
q
for each
embedding E
q
. The ranked list τ
q
(i) contains the in-
dices of the embeddings sorted in ascending order
of their distance from E
q
, i.e., if τ
q
(i) < τ
q
( j), then
δ(q, i) < δ(q, j).
The complete set of ranked lists for all embed-
dings in E is defined as R = {τ
1
, τ
2
, . . . , τ
m
}, where
Inductive Self-Supervised Dimensionality Reduction for Image Retrieval
387

each τ
q
represents the rankings of all other embed-
dings relative to E
q
.
4 EXPERIMENTAL EVALUATION
In this Section, we describe the experimental protocol
adopted to evaluate the performance of the proposed
method. Our implementation, along with all the code
used in the experiments conducted, is publicly avail-
able at https://github.com/derykroot/issdir.
4.1 Datasets
The experimental analysis considered four distinct
datasets: (i) MNIST, 70,000 images, 10 classes
(LeCun et al., 1998); (ii) Corel5K, 5,000 images,
50 classes (Liu and Yang, 2013); (iii) Fashion-
MNIST, 70,000 images, 10 classes (Xiao et al.,
2017); (iv) CIFAR-10, 60,000 images, 10 classes
(Krizhevsky and Hinton, 2009).
4.2 Experimental Protocol
All datasets employed predefined training and test-
ing splits, with the test set comprising approximately
20% of the data, except for Corel5K, which utilized
5-fold cross-validation due to the absence of a prede-
fined test split. Inductive methods, such as Parametric
t-SNE, Parametric UMAP, and our proposed method,
were trained using the training set. In contrast, trans-
ductive methods, including PCA, t-SNE, and UMAP,
were applied directly to the test set without a prior
training phase, as their adjustment process occurs dur-
ing inference. Furthermore, all methods were evalu-
ated using only the testing set as queries for the re-
trieval task.
Regarding the evaluation method, we used mean
Average Precision (mAP), which gives a broad evalu-
ation of precision values in retrieval tasks (Manning,
2008).
We used a Multilayer Perceptron (MLP) with four
layers. The hidden layers have 12,288 neurons each,
while the input and output layers have 1,536 neu-
rons when using DINOv2 features, and 3,072 neurons
when using ConvNeXt features. The encoder network
has the same input size as the MLP output, with four
hidden layers, and reduces the dimensionality to two
neurons in the final layer.
For training, we used a batch size of 2,048 and the
AdamW optimizer with a learning rate of 0.0014. The
model was trained for 1,000 epochs, here each epoch
corresponds to a single iteration, as we employed a
random sampling strategy for selecting the training
data.
4.3 Results and Analysis
The Table 1 presents the results of experiments
conducted with two feature extraction models, DI-
NOv2 and ConvNeXt, evaluated on different datasets:
CIFAR-10, MNIST, FashionMNIST, and Corel5K.
For the experiments, the predefined test set split from
each dataset was used. The Table compares the per-
formance obtained with a fixed margin and with a
margin weighted based on the distances between the
centroids of the clusters to which the samples belong.
Description of Table 1 Columns:
• Feature Extractor: Neural network model used
for feature extraction.
• Dataset (Test Set): Dataset employed for evalua-
tion, with results for each test query.
• Margin Fixed: Accuracy results from a fixed
margin in the contrastive loss function during
training.
• With Weighted Margin: Results from using a
margin weighted by distances between cluster
centroids, enhancing discriminative learning.
• Weighted Margin Gain (%): Performance dif-
ference between models trained with weighted
and fixed margins, where positive values show
gains and negative values indicate declines.
Based on the results, it can be observed that
the use of the ”weighted margin” resulted in sig-
nificant gains for some datasets, such as CIFAR-
10 and FashionMNIST with ConvNeXt, while other
datasets, such as MNIST with DINOv2, showed a
slight drop in performance with the weighted mar-
gin. The “Weighted Margin Gain (%)” column high-
lights these variations, allowing for a clear compara-
tive analysis of the impact of the margin adjustment
in the different experiments.
It is notable that the application of the ‘weighted
margin‘ resulted in a performance decrease in the
Corel5K dataset for both feature extractors, DINOv2
and ConvNeXt. One characteristic of Corel5K is that
it contains fewer images per class compared to the
other datasets used. This suggests that the use of the
weighted margin tends to be more effective in datasets
with a larger number of samples per class. In sce-
narios with fewer samples per class, as observed in
Corel5K, the weighted margin may not adequately
capture intra-class variations, leading to lower perfor-
mance. Therefore, the effectiveness of the weighted
margin may be correlated with the density and the
VISAPP 2025 - 20th International Conference on Computer Vision Theory and Applications
388
Table 1: Impact of the Weighted Margin considering mAP values. We compare results with and without weighted margin.
Feature Extractor Dataset (Test Set) Margin Fixed
With Weighted
Margin
Weighted Margin
Gain
DINOv2
CIFAR-10 94.27% 94.87% +0.60%
MNIST 76.03% 75.57% -0.46%
FashionMNIST 73.98% 74.29% +0.31%
Corel5K 86.31% 84.90% -1.41%
ConvNeXt
CIFAR10 89.69% 93.32% +3.63%
MNIST 95.85% 97.89% +2.04%
FashionMNIST 66.19% 71.11% +4.92%
Corel5K 90.85% 89.99% -0.86%
Table 2: Comparison with mAP results of other methods on the test set.
Feature Method Datasets
Extractor CIFAR-10 MNIST FashionMNIST Corel5K
DINOv2
Original Features 64.66% 41.77% 59.07% 76.92%
PCA 55.12% 30.81% 37.27% 23.17%
t-SNE 85.74% 63.87% 71.27% 85.72%
UMAP 91.11% 69.28% 74.30% 85.59%
Parametric t-SNE 87.74% 52.10% 70.54% 68.90%
Parametric UMAP 94.33% 74.71% 74.70% 73.88%
ISSDiR (Ours) 94.87% 75.57% 74.29% 84.90%
ConvNeXt
Original Features 64.55% 73.73% 63.36% 73.17%
PCA 53.57% 46.57% 54.03% 28.89%
t-SNE 86.45% 91.09% 74.24% 88.24%
UMAP 90.59% 95.70% 75.53% 89.69%
Parametric t-SNE 88.70% 87.02% 76.73% 71.30%
Parametric UMAP 91.47% 96.60% 75.58% 79.08%
ISSDiR (Ours) 93.32% 97.89% 71.11% 89.99%
amount of data available per class, indicating that its
application is more advantageous in contexts where
there is an abundance of examples for each category.
After analyzing the impact of the weighted mar-
gin in the previous experiments, we proceed by com-
paring our proposed method, ISSDiR, with other di-
mensionality reduction techniques. Table 2 presents
a comparison of ISSDiR with PCA, t-SNE, UMAP,
parametric t-SNE and parametric UMAP as well
as the performance using the original features, for
two feature extraction models (DINOv2 and Con-
vNeXt). The comparison is conducted on four
datasets: CIFAR-10, MNIST, FashionMNIST, and
Corel5K, using the test set of each dataset for eval-
uation.
Description of Table 2 Columns:
• Feature Extractor. Refers to the feature extrac-
tion model used (DINOv2 or ConvNeXt).
• Method. Represents the method applied for di-
mensionality reduction or the direct use of the
original features.
– Original Features. Performance obtained by
directly using the features extracted by the
model, without applying dimensionality reduc-
tion.
– PCA. Results obtained by applying Principal
Component Analysis (PCA) for dimensionality
reduction.
– t-SNE. Results using t-distributed Stochastic
Neighbor Embedding (t-SNE).
– UMAP. Results obtained using Uniform Mani-
fold Approximation and Projection (UMAP).
– Parametric t-SNE. Results obtained using the
Parametric t-distributed Stochastic Neighbor
Embedding (t-SNE).
– Parametric UMAP. Results obtained using the
Parametric Uniform Manifold Approximation
and Projection (UMAP).
– ISSDiR (Ours). Performance of the proposed
method, ISSDiR.
• Datasets. Shows the Mean Average Precision ob-
tained on each dataset, consideiring the query el-
ements of the test set: CIFAR-10, MNIST, Fash-
ionMNIST, and Corel5K.
In Table 2, it is noteworthy that ISSDiR consis-
tently achieves competitive or superior performance
across different datasets and feature extraction meth-
ods. Specifically, ISSDiR outperforms the other
methods on CIFAR-10, achieving its best result with
DINOv2 (94.87%) and ConvNeXt (93.32%). This
shows that ISSDiR is highly effective when dealing
with large-scale image classification tasks, particu-
larly when feature extraction is done by DINOv2.
For the MNIST dataset, ISSDiR achieves its high-
est performance with ConvNeXt (97.89%), outper-
forming both UMAP (95.70%) and t-SNE (91.09%),
Inductive Self-Supervised Dimensionality Reduction for Image Retrieval
389
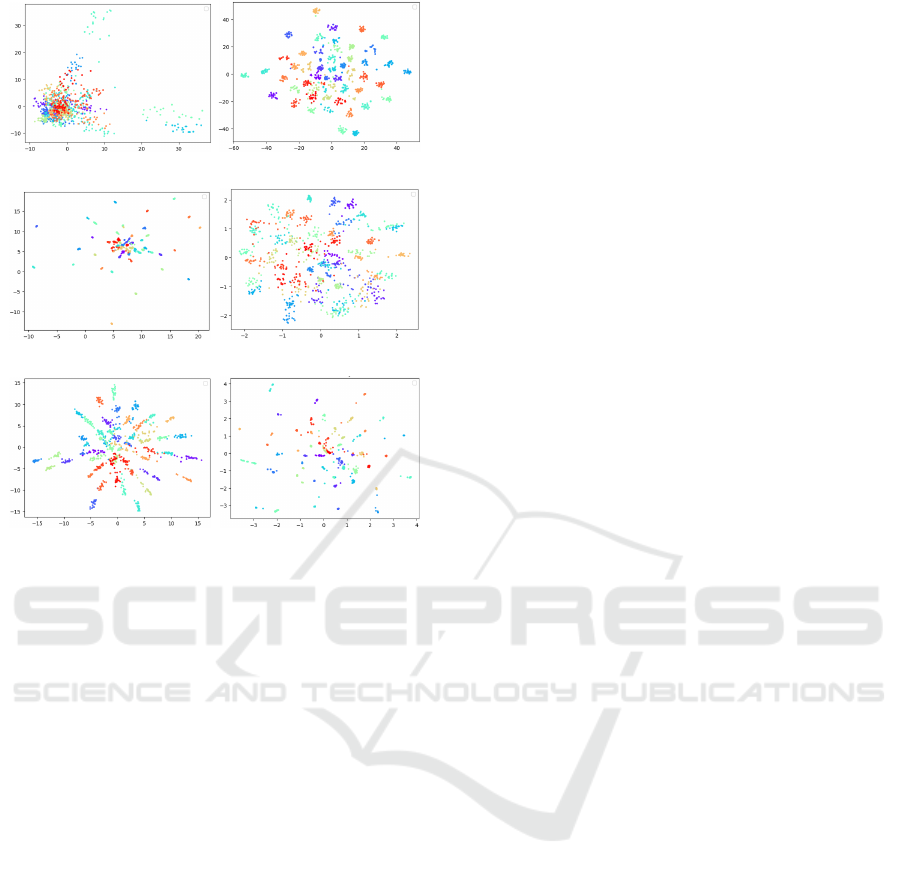
(a) PCA (b) t-SNE
(c) UMAP (d) Parametric t-SNE
(e) Parametric UMAP (f) ISSDiR (Ours)
Figure 3: Different projections of Corel5K dataset with
ConvNeXt features.
as well as their respective parametric versions
(Parametric UMAP: 96.60% and Parametric t-SNE:
87.02%). In the Corel5K dataset, ISSDiR also per-
forms competitively (89.99%), slightly surpassing
UMAP (89.69%). However, UMAP performs bet-
ter on FashionMNIST (75.53%) compared to ISSDiR
(71.11%).
Figure 3 shows different dimensionality reduction
methods applied to the Corel5K dataset, using fea-
tures extracted by the ConvNeXt model. The pro-
posed method, ISSDiR, causes many points from
the same cluster to converge into compact regions,
while still maintaining good separability between dif-
ferent clusters. UMAP similarly compacts clusters
but keeps central clusters closer together. Paramet-
ric UMAP also compacts clusters and enhances sep-
arability. t-SNE achieves a more uniform distribu-
tion, improving visual explainability by making clus-
ters easily distinguishable, whereas Parametric t-SNE
shows more dispersed separability. In contrast, PCA
results in a less defined and more elongated distribu-
tion, indicating a reduced ability to clearly separate
clusters compared to the other methods.
5 CONCLUSION
In this study, we introduced a robust inductive dimen-
sionality reduction method aimed at enhancing dis-
criminative power for image retrieval tasks across di-
verse datasets. By adjusting the adaptive margin to
assign larger margins to more distant clusters, our
method improves group discrimination and facilitates
effective learning of the feature space.
We evaluated our approach against both trans-
ductive methods and other inductive dimensionality
reduction techniques, achieving competitive perfor-
mance metrics. Future work will focus on apply-
ing this method in more scalable contexts, compar-
ing it with a broader range of inductive techniques
to further enhance performance, and exploring addi-
tional loss functions and neural network architectures
to strengthen the overall framework.
ACKNOWLEDGEMENTS
The authors are grateful to Petrobras (grant
#2023/00095-3) for supporting this research. This
study was also financed in part by the Coordenac¸
˜
ao
de Aperfeic¸oamento de Pessoal de N
´
ıvel Superior -
Brasil (CAPES).
REFERENCES
Asano, Y. M., Rupprecht, C., and Vedaldi, A. (2020). Self-
labelling via simultaneous clustering and representa-
tion learning. In International Conference on Learn-
ing Representations (ICLR).
Bishop, C. M. and Nasrabadi, N. M. (2006). Pattern recog-
nition and machine learning, volume 4. Springer.
Caron, M., Bojanowski, P., Joulin, A., and Douze, M.
(2018). Deep clustering for unsupervised learning of
visual features. In Proceedings of the European con-
ference on computer vision (ECCV), pages 132–149.
Chen, T. and Chen, H. (1995). Universal approximation
to nonlinear operators by neural networks with arbi-
trary activation functions and its application to dy-
namical systems. IEEE transactions on neural net-
works, 6(4):911–917.
Chidananda Gowda, K. and Krishna, G. (1978). Agglom-
erative clustering using the concept of mutual nearest
neighbourhood. Pattern Recognition, 10(2):105–112.
Chopra, S., Hadsell, R., and LeCun, Y. (2005). Learning
a similarity metric discriminatively, with application
to face verification. In 2005 IEEE computer society
conference on computer vision and pattern recogni-
tion (CVPR’05), volume 1, pages 539–546. IEEE.
Ding, J., Condon, A., and Shah, S. P. (2018). Interpretable
dimensionality reduction of single cell transcriptome
VISAPP 2025 - 20th International Conference on Computer Vision Theory and Applications
390

data with deep generative models. Nature communi-
cations, 9(1):2002.
Ding, X., Chen, H., Zhang, X., Han, J., and Ding, G.
(2022). Repmlpnet: Hierarchical vision mlp with
re-parameterized locality. In Proceedings of the
IEEE/CVF conference on computer vision and pattern
recognition, pages 578–587.
El-Nouby, A., Neverova, N., Laptev, I., and J
´
egou, H.
(2021). Training vision transformers for image re-
trieval. arXiv preprint arXiv:2102.05644.
Espadoto, M., Hirata, N. S. T., and Telea, A. C. (2021).
Self-supervised dimensionality reduction with neural
networks and pseudo-labeling. In Proceedings.
Fu, Z., Li, Y., Mao, Z., Wang, Q., and Zhang, Y. (2021).
Deep metric learning with self-supervised ranking. In
Proceedings of the AAAI Conference on Artificial In-
telligence, volume 35, pages 1370–1378.
Gisbrecht, A., Schulz, A., and Hammer, B. (2015). Para-
metric nonlinear dimensionality reduction using ker-
nel t-sne. Neurocomputing, 147:71–82. Advances
in Self-Organizing Maps Subtitle of the special is-
sue: Selected Papers from the Workshop on Self-
Organizing Maps 2012 (WSOM 2012).
Gkelios, S., Sophokleous, A., Plakias, S., Boutalis, Y., and
Chatzichristofis, S. A. (2021). Deep convolutional
features for image retrieval. Expert Systems with Ap-
plications, 177:114940.
Goodfellow, I. (2016). Deep learning.
Hadsell, R., Chopra, S., and LeCun, Y. (2006). Dimension-
ality reduction by learning an invariant mapping. In
2006 IEEE computer society conference on computer
vision and pattern recognition (CVPR’06), volume 2,
pages 1735–1742. IEEE.
Hornik, K., Stinchcombe, M., and White, H. (1989). Multi-
layer feedforward networks are universal approxima-
tors. Neural networks, 2(5):359–366.
Jain, A. K., Murty, M. N., and Flynn, P. J. (1999). Data
clustering: a review. ACM Comput. Surv., 31(3).
Kawai, V. A. S., Leticio, G. R., Valem, L. P., and Pedronette,
D. C. G. (2024a). Neighbor embedding projection and
rank-based manifold learning for image retrieval. In
2024 37th SIBGRAPI Conference on Graphics, Pat-
terns and Images (SIBGRAPI), pages 1–6.
Kawai, V. S., Valem, L. P., Baldassin, A., Borin, E., Pe-
dronette, D. C. G. a., and Latecki, L. J. (2024b). Rank-
based hashing for effective and efficient nearest neigh-
bor search for image retrieval. ACM Trans. Multime-
dia Comput. Commun. Appl., 20(10).
Krizhevsky, A. and Hinton, G. (2009). Learning multiple
layers of features from tiny images. Technical Re-
port 0, University of Toronto, Toronto, Ontario.
LeCun, Y., Bottou, L., Bengio, Y., and Haffner, P. (1998).
Gradient-based learning applied to document recogni-
tion. Proceedings of the IEEE, 86(11):2278–2324.
Leticio, G. R., Kawai, V. S., Valem, L. P., Pedronette, D.
C. G., and da S. Torres, R. (2024). Manifold informa-
tion through neighbor embedding projection for image
retrieval. Pattern Recognition Letters, 183:17–25.
Li, X., Yang, J., and Ma, J. (2021). Recent developments of
content-based image retrieval (cbir). Neurocomputing,
452:675–689.
Liu, G.-H. and Yang, J.-Y. (2013). Content-based image
retrieval using color difference histogram. Pattern
recognition, 46(1):188–198.
Liu, Z., Mao, H., Wu, C.-Y., Feichtenhofer, C., Darrell, T.,
and Xie, S. (2022). A convnet for the 2020s. In Pro-
ceedings of the IEEE/CVF conference on computer vi-
sion and pattern recognition, pages 11976–11986.
Manning, C. D. (2008). Introduction to information re-
trieval. Syngress Publishing,.
McInnes, L., Healy, J., Saul, N., and Großberger, L. (2018).
Umap: Uniform manifold approximation and projec-
tion. Journal of Open Source Software, 3(29):861.
Oquab, M., Darcet, T., Moutakanni, T., Vo, H., Szafraniec,
M., Khalidov, V., Fernandez, P., Haziza, D., Massa, F.,
El-Nouby, A., et al. (2023). Dinov2: Learning robust
visual features without supervision. arXiv preprint
arXiv:2304.07193.
Roman-Rangel, E. and Marchand-Maillet, S. (2019). In-
ductive t-sne via deep learning to visualize multi-label
images. Engineering Applications of Artificial Intelli-
gence, 81:336–345.
Sainburg, T., McInnes, L., and Gentner, T. Q. (2021).
Parametric umap embeddings for representation and
semisupervised learning. Neural Computation,
33(11):2881–2907.
Szubert, B., Cole, J. E., Monaco, C., and Drozdov, I.
(2019). Structure-preserving visualisation of high
dimensional single-cell datasets. Scientific reports,
9(1):8914.
Tang, C., Zhao, Y., Wang, G., Luo, C., Xie, W., and Zeng,
W. (2022). Sparse mlp for image recognition: Is self-
attention really necessary? In Proceedings of the
AAAI conference on artificial intelligence, volume 36,
pages 2344–2351.
Tolstikhin, I. O., Houlsby, N., Kolesnikov, A., Beyer, L.,
Zhai, X., Unterthiner, T., Yung, J., Steiner, A., Key-
sers, D., Uszkoreit, J., et al. (2021). Mlp-mixer: An
all-mlp architecture for vision. Advances in neural in-
formation processing systems, 34:24261–24272.
Van der Maaten, L. and Hinton, G. (2008). Visualizing data
using t-sne. Journal of machine learning research,
9(11).
Wan, J., Wang, D., Hoi, S. C. H., Wu, P., Zhu, J., Zhang, Y.,
and Li, J. (2014). Deep learning for content-based im-
age retrieval: A comprehensive study. In Proceedings
of the 22nd ACM international conference on Multi-
media, pages 157–166.
Wang, X., Han, X., Huang, W., Dong, D., and Scott,
M. R. (2019a). Multi-similarity loss with general pair
weighting for deep metric learning. In Proceedings
of the IEEE/CVF conference on computer vision and
pattern recognition, pages 5022–5030.
Wang, X., Hua, Y., Kodirov, E., Hu, G., Garnier, R., and
Robertson, N. M. (2019b). Ranked list loss for deep
metric learning. In Proceedings of the IEEE/CVF con-
ference on computer vision and pattern recognition,
pages 5207–5216.
Xiao, H., Rasul, K., and Vollgraf, R. (2017). Fashion-
mnist: a novel image dataset for benchmarking ma-
chine learning algorithms. arXiv e-prints, pages
arXiv–1708.
Inductive Self-Supervised Dimensionality Reduction for Image Retrieval
391
