
A Multitier Approach for Dynamic and Partially Observable Multiagent
Path-Finding
Anıl Do
˘
gru
1 a
, Amin Deldari Alamdari
1 b
, Duru Balpınarlı
2 c
and Reyhan Aydo
˘
gan
1,3,4 d
1
Department of Computer Science, Özye˘gin University,
˙
Istanbul, Turkey
2
Department of Industrial Engineering, Özye˘gin University,
˙
Istanbul, Turkey
3
Department of Artificial Intelligence and Data Engineering, Özye˘gin University,
˙
Istanbul, Turkey
4
Delft University of Technology, Delft, The Netherlands
Keywords:
Multiagent Path-Finding, Uncertainty, Ant Colony Optimization, Consensus.
Abstract:
This paper introduces a novel Dynamic and Partially Observable Multiagent Path-Finding (DPO-MAPF) prob-
lem and presents a multitier solution approach accordingly. Unlike traditional MAPF problems with static
obstacles, DPO-MAPF involves dynamically moving obstacles that are partially observable and exhibit un-
predictable behavior. Our multitier solution approach combines centralized planning with decentralized exe-
cution. In the first tier, we apply state-of-the-art centralized and offline path planning techniques to navigate
around static, known obstacles (e.g., walls, buildings, mountains). In the second tier, we propose a decentral-
ized and online conflict resolution mechanism to handle the uncertainties introduced by partially observable
and dynamically moving obstacles (e.g., humans, vehicles, animals, and so on). This resolution employs a
metaheuristic-based revision process guided by a consensus protocol to ensure fair and efficient path alloca-
tion among agents. Extensive simulations validate the proposed framework, demonstrating its effectiveness in
finding valid solutions while ensuring fairness and adaptability in dynamic and uncertain environments.
1 INTRODUCTION
As defined by (Stern et al., 2021), Multiagent Path-
Finding (MAPF) involves the allocation of conflict-
free paths to rational agents, facilitating their travel
from initial to target locations and is crucial for tack-
ling various real-world challenges, including logistics
and robot rescue operations. Due to its practical appli-
cations, it has attracted significant attention from re-
searchers, leading to the exploration of various prob-
lem variants over time. While some researchers fo-
cus on the MAPF with fixed (i.e., static) obstacles for
the agents to avoid along their paths (Sharon et al.,
2015), others have introduced uncertainty by incorpo-
rating partial observability where agents lack all rel-
evant information regarding the presence/location of
those static obstacles (Shofer et al., 2023).
Besides, uncertainty in real-world scenarios arises
from the stochastic or unpredictable behaviors of
a
https://orcid.org/0000-0002-9951-8912
b
https://orcid.org/0000-0002-3124-7677
c
https://orcid.org/0000-0002-5349-0563
d
https://orcid.org/0000-0002-5260-9999
other entities in the environment. For instance, birds
in a multi-drone path-finding problem contribute to
uncertainty since agents may not be able to predict
their presence or movement patterns, nor can they
communicate with them. Similarly, the movement
of pedestrians and animals or sudden blockage on
the road, such as car accidents or building crashes,
pose dynamic and unpredictable challenges for au-
tonomous driving. These entities and events do not
only create uncertainty but also result in dynamically
unavailable regions in the environment, acting as ob-
stacles that can potentially lead to conflict. To the
best of our knowledge, none have comprehensively
addressed the MAPF problem involving partially ob-
servable and dynamically moving obstacles that also
exhibit unpredictable behaviors.
In this study, we extend the classical MAPF prob-
lem by introducing partially observable and dynamic
obstacles (e.g., humans, vehicles, animals, and non-
rational entities) that move unpredictably over time,
while agents have limited vision to detect them. In our
formulation, agents cannot communicate with these
obstacles at any point and have no prior knowledge of
their existence, positions, or velocities until they enter
562
Do
ˇ
gru, A., Alamdari, A. D., Balpınarlı, D. and Aydo
ˇ
gan, R.
A Multitier Approach for Dynamic and Partially Observable Multiagent Path-Finding.
DOI: 10.5220/0013159800003890
In Proceedings of the 17th International Conference on Agents and Artificial Intelligence (ICAART 2025) - Volume 3, pages 562-573
ISBN: 978-989-758-737-5; ISSN: 2184-433X
Copyright © 2025 by Paper published under CC license (CC BY-NC-ND 4.0)

their field of view (i.e., partial observability). Conse-
quently, our formulation introduces the challenge of
navigating through both static and dynamic obstacles
while coping with limited knowledge about environ-
ment. We refer to this problem as the Dynamic and
Partially Observable Multiagent Path-Finding (DPO-
MAPF) problem.
Regarding the potential solution approaches, two
categories emerge: centralized and decentralized.
Centralized approaches employ a single authority that
uses all available knowledge to optimize paths for all
agents, which can be effective for global optimiza-
tion but faces scalability challenges as the number of
agents increases. Decentralized approaches, on the
other hand, grant autonomy to individual agents, of-
fering scalability benefits but may struggle to find
optimal solutions in complex environments. Hence,
we propose a multitier strategy combining both ap-
proaches to leverage their strengths for effectively
tackling the DPO-MAPF problem.
In both tiers, the primary objective remains guid-
ing agents from their initial locations to their goal
destinations while minimizing total travel time and
avoiding collisions. In the first tier, we employ a cen-
tralized and offline pathfinding strategy, particularly
in regions where static obstacles (e.g., walls, moun-
tains, buildings) are pre-known and globally observ-
able. This tier can integrate well-known centralized
algorithms, such as (Sharon et al., 2015; Li et al.,
2021b; Okumura et al., 2022; Lam et al., 2022).
To address the uncertainty introduced by DPO-
MAPF problem, the second tier applies a decentral-
ized and online conflict resolution approach, which
includes a revising strategy along with a consensus
protocol. The second tier primarily aims for decen-
tralized execution of the centralized plan in a DPO-
MAPF environment. If any conflicts arising from the
uncertainty are detected in the current plan, the revis-
ing strategy employing a metaheuristic method (i.e.,
Ant Colony Optimization) resolves them. Further-
more, a consensus protocol inspired by (Eran et al.,
2021) manages conflict resolution among agents by
prioritizing them based on specific criteria, such as
urgency in reaching their goals, objective functions,
fairness among them, or specific task requirements.
Our proposed strategy encourages collaboration,
information sharing, fairness, and self-organization
among agents in dynamic and uncertain environ-
ments. Consequently, this study seeks to develop
adaptive and responsive path-finding techniques that
incorporate both offline and online decision-making
processes, effectively addressing the challenges posed
by static and dynamic obstacles and enhancing multi-
agent coordination in real-world scenarios.
The rest of the paper is organized as follows: Sec-
tion 2 reviews related work, and Section 3 defines the
problem. Section 4 presents the mathematical formal-
ization, and Section 5 outlines the proposed multitier
approach. Section 6 introduces proposed decentral-
ized and online conflict resolution. Section 7 details
the experimental setup and the performance evalua-
tion results. Finally, Section 8 discusses the main con-
tributions and future work directions.
2 RELATED WORK
The MAPF problem has been widely studied, gen-
erally categorized into centralized and decentralized
approaches. Centralized approaches utilize compre-
hensive knowledge and coordination, employing op-
timal solvers that consider all agents’ paths for effi-
cient conflict resolution and optimization. The A*
algorithm is foundational in MAPF solvers, known
for its efficiency in finding shortest paths (Ryan,
2008; Standley, 2010). Building on A*, (Sharon
et al., 2015) introduce Conflict-Based Search (CBS),
which coordinates multiple agents and is widely used
in MAPF. CBS operates as a two-level search al-
gorithm, resolving conflicts by branching into sub-
problems and replanning paths when needed. Sub-
sequent enhancements like Meta-Agent CBS (MA-
CBS) improve performance in conflict-heavy scenar-
ios by coupling agents into meta-agents based on con-
flict frequency (Sharon et al., 2015). (Lam et al.,
2022) advance CBS through the Branch-and-Cut-and-
Price (BCP) algorithm, integrating mixed-integer pro-
gramming (MIP) for better performance. (Li et al.,
2021a) further enhance CBS with CBSH2-RTC, ef-
fectively resolving symmetric conflicts and reducing
node expansions, significantly improving scalability.
As the number of agents increases, the state space
expands exponentially, leading to the utilization of
suboptimal solvers to handle this growth. In such
cases, suboptimal solvers prove beneficial for find-
ing paths quickly. (Semiz and Polat, 2021) introduce
the Incremental MAPF (I-MAPF) problem and pro-
pose CBS-D*-lite, which combines CBS with D*-
lite. This approach efficiently updates only affected
agents’ paths in dynamic environments without re-
planning from scratch, enhancing adaptability and
computational efficiency over traditional CBS, al-
though it may not yield optimal solutions in rapidly
changing scenarios. (Li et al., 2021b) present Ex-
plicit Estimation CBS (EECBS), which employs on-
line learning to obtain inadmissible heuristics of each
high-level node and uses Explicit Estimation Search
to select which high-level node to expand next. (Oku-
A Multitier Approach for Dynamic and Partially Observable Multiagent Path-Finding
563
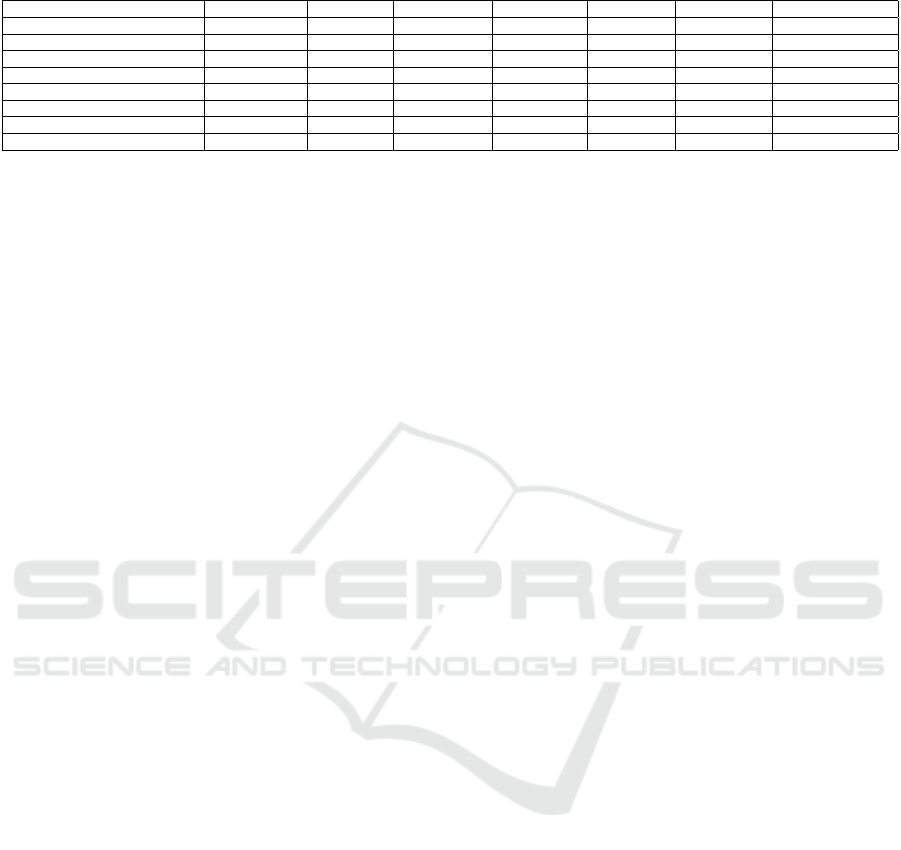
Table 1: Comparison of the Most Promising Multiagent Path-Finding Approaches.
Approach Optimality Completeness Environment Uncertainty Observability Solver Type
CBS (Sharon et al., 2015) Centralized Optimal Complete Static No Fully Rule-based
CBSH2-RTC (Li et al., 2021a) Centralized Optimal Complete Static No Fully Rule-based
EECBS (Li et al., 2021b) Centralized Suboptimal Complete Static No Fully Rule-based
PIBT (Okumura et al., 2022) (De)centralized Suboptimal Incomplete Static Yes Partially Priority/Rule-based
PRIMAL (Sartoretti et al., 2019) Decentralized Suboptimal Incomplete Static Yes Partially Learning-based
BCP (Lam et al., 2022) Centralized Optimal Complete Static No Fully Systematic
I-MAPF (Semiz and Polat, 2021) Centralized Optimal Complete Static Yes Partially Systematic
Our Approach Mixed Suboptimal Complete Dynamic Yes Partially Multitier
mura et al., 2022) introduce Priority Inheritance with
Backtracking (PIBT), a two-level decoupled approach
that uses dynamic prioritization to manage agent
movements, ensuring reachability in large, real-time
environments. Despite its scalability and efficiency,
PIBT may struggle in dense settings.
Although CBS and its variants excel at providing
promising solutions, they struggle in highly dynamic
environments with unpredictable movements. Most
studies assume dynamic settings but typically focus
on partial observability (Shofer et al., 2023) or the
change in the number of agents in a team of coop-
erative and collaborative agents as a dynamic envi-
ronment (Wan et al., 2018). The static assumption
in many MAPF models can lead to inefficiencies and
suboptimal performance when dealing with such dy-
namic elements. Additionally, their centralized nature
demands high computational resources and full ob-
servability, often impractical in real applications. In
contrast, this study addresses dynamic environments
with partially observable and unpredictable entities,
offering a more realistic perspective.
On the other hand, decentralized approaches
in multi-agent pathfinding have gained significant
attention, particularly for managing dynamic and
large-scale environments by distributing path plan-
ning tasks among local decision-makers. These ap-
proaches offer a flexible and scalable solution when
centralized coordination becomes impractical or com-
putationally intensive. Due to limited knowledge, de-
centralized approaches do not guarantee optimality
but offer reasonable solutions in a shorter time. Con-
sequently, various techniques have been developed to
address the challenges of decentralized multi-agent
pathfinding (DMAPF) and coordination in dynamic
environments. DMAPF requires multiple agents to
coordinate their movements to avoid collisions and
achieve their individual goals (Verbari et al., 2019).
(Desaraju and How, 2012) utilize rapidly explor-
ing random tree (RRT), a popular technique used in
DMAPF to quickly explore the search space and find
a feasible path for each agent.
Moreover, decentralized approaches offer diverse
applications for MAPF beyond traditional methods.
(Morag et al., 2023) introduce a learning-based mo-
tion planning framework where each agent constructs
a graph of boundary value problems based on con-
straints. (Peng, 2023) combine heuristic search, em-
pirical rules, and multiagent reinforcement learning
with real-time and heuristic planners. (Netter and
Vamvoudakis, 2023) present a decentralized motion
planning algorithm that leverages game theory for
online path updates in dynamic environments, miti-
gating the freezing robot problem while considering
kinodynamic constraints. (Kasaura et al., 2023) pro-
pose periodic MAPP, using constraint relaxation and
optimization for periodic agent appearances. Lastly,
(Keskin et al., 2024) suggest a decentralized ne-
gotiation strategy using token protocols and path-
aware/heatmap in grid environments.
Given the inherent complexities and dynamic na-
ture of MAPF, bioinspired algorithms have emerged
as a promising approach to enhance adaptability and
collision avoidance in complex and dynamic settings
(Aljalaud et al., 2023). For example, (Dai et al.,
2019) introduces an improved Ant Colony Algorithm
(ACO) for MAPF, combining features of the A* algo-
rithm and the MAX-MIN Ant System to handle intri-
cate environments. (Huang et al., 2021) optimize the
ACO algorithm by refining parameters and addressing
vertex conflicts. Their approach introduces adaptive
pheromone intensity, reduction factors, and an initial
pheromone distribution, which help to prevent the al-
gorithm from getting stuck in local optima.
Finally, Table 1 summarizes the cutting-edge ap-
proaches mentioned above for the MAPF problem. In
contrast to these studies mentioned above, our study
proposes a novel multitier approach, leveraging the
advantages of centralized and decentralized processes
and integrating ACO into a decentralized and online
framework to address the challenges of DPO-MAPF.
3 PROBLEM DEFINITION
MAPF problem involves the allocation of conflict-
free paths to agents, guiding them from their ini-
tial locations to their goal locations. In the context
of the MAPF problem, we consider m agents rep-
resented by a = {a
1
,a
2
,...,a
m
} navigating within a
graph G = (V, E). The initial and goal locations for
ICAART 2025 - 17th International Conference on Agents and Artificial Intelligence
564

an agent a
i
are denoted as s
i
∈ V and g
i
∈ V , respec-
tively, and an agent can traverse from vertex v ∈ V to
vertex v
′
∈ V if there is an edge such that (v,v
′
) ∈ E.
Time is considered discrete, and at each time step, an
agent can occupy only one vertex of the graph and
execute a single action for moving to an adjacent ver-
tex. The path of every agent a
i
is represented by a
sequence of vertices (v
i
∈ V ) identified at each time
step t and denoted as π
i
(single-agent plan). At a
given time step, agents cannot be located in the same
vertex, π
t
i
̸= π
t
j
∀ i ̸= j, and cannot traverse the same
edge, (π
t
i
= π
t+1
j
) =⇒ (π
t+1
i
̸= π
t
j
) ∀ i ̸= j, where π
t
i
is the location of a
i
at t (Stern, 2019). A valid solution
for the MAPF problem is a set of single-agent plans
without any conflict with the obstacles and each other.
As in the classical MAPF problem, the environ-
ment contains static obstacles, such as walls, build-
ings, or permanent structures, that remain in fixed
and known locations throughout the path-finding pro-
cess. Our DPO-MAPF problem also has partially ob-
servable and dynamically moving obstacles with un-
known positions and behaviors. Let’s assume that n
dynamic obstacles represented by o = {o
1
,o
2
,...,o
n
}
moving within the graph G = (V,E). Like agents,
each dynamic obstacle (o
j
) has an initial location
(s
o
j
∈ V) and can traverse from vertex v ∈ V to vertex
v
′
∈ V if there is an edge such that (v,v
′
) ∈ E. The dy-
namic obstacles can only be positioned in one of the
graph’s vertices at each time step (see the red cells in
Figure 1) and execute a single action at each time step
t. The agents cannot be located in the same vertex
and traverse the same edge with dynamic obstacles as
well (π
t
a
i
̸= π
t
o
j
and π
t
a
i
= π
t+1
o
j
=⇒ π
t+1
a
i
̸= π
t
o
j
∀a
i
∈
a∧o
j
∈ o, where π
t
a
i
is the location of a
i
and π
t
o
j
is the
location of o
j
at t). It is worth noting that the agents
cannot communicate with these dynamic obstacles.
Agents also disappear when they reach the goal po-
sition to prevent post-goal collisions, as addressed in
(Sharon et al., 2015). Additionally, the agents have
a limited vision to detect dynamic obstacles. Agents
can observe dynamic obstacles only if they fall within
their field of view. This means that agents are not pro-
vided with any information about the existence, po-
sition and velocity of dynamic obstacles before the
agents’ observation. Finally, the maximum total time
step to complete the mission is limited.
To address this, we developed a simulation frame-
work
1
for the DPO-MAPF task visualized in Figure
1. This framework enables grid-like DPO-MAPF sce-
1
To ensure the reproducibility and trans-
parency of our study, the correspond-
ing GitHub repository is publicly available:
https://github.com/aniltrue/DPO_MAPF_ICAART_2025
Figure 1: Illustration of the Simulation Framework.
narios, including different densities of dynamic and
static obstacles, map sizes and number of agents.
Each agent can move between neighboring cells
based on available actions such as “Up”, “Down”,
“Right”, “Left”, and “Wait”. Note that the grid en-
vironment, commonly used for path-finding prob-
lems, can be equivalently represented as an undirected
graph where the connectivity between cells (i.e., ver-
tices) is defined by their adjacency in the grid. This
structured representation simplifies certain operations
while maintaining the general properties of graph-
based representations, thus ensuring that the classical
MAPF problem defined on graphs is consistent with
our grid-based implementation. Besides, inspired by
(Eran et al., 2021), each agent’s field of view is rep-
resented by a fixed-sized square (i.e., 5 × 5), with the
agent always positioned at the center of this square.
Consequently, this simulation framework facilitates
the generation of environments, evaluation of pro-
posed approaches, and visualization of agent move-
ments within the DPO-MAPF environment.
4 LP FORMALIZATION
The linear programming (LP) approach has already
been used to find optimal solutions for classical
MAPF problems. However, it struggles with scala-
bility issues due to the N P -Hard nature of the MAPF
problem, highlighting the necessity for alternative ap-
proaches such as heuristic algorithms.
In our context, we introduce an LP formalization
of the DPO-MAPF problem for validation during the
scenario-making process. Since LP models must be
deterministic and solvable by commercial solvers, the
uncertainty introduced by partial observability makes
the LP approach less suitable for DPO-MAPF. In
other words, the mathematical model requires com-
plete information about the environment, including
A Multitier Approach for Dynamic and Partially Observable Multiagent Path-Finding
565

both dynamic and static obstacles. Nonetheless, it still
provides a solid baseline for evaluation purposes.
The parameters and decision variables are sum-
marized below, followed by a formulation of the
DPO-MAPF problem:
Indices:
i = Index representing a node in the graph
t = Discrete time-step
m = Index of an agent
Sets:
T = The set of time-steps, [0,T
max
].
I = The set of all nodes in the graph.
M = The set of agents, indexed from 1 to m.
E = The set of all edges, where each edge is
a pair (i,i
′
) indicating a direct connection
between nodes i and i
′
.
N (i) = The set of neighboring nodes of node i,
defined as N (i) = {i
′
∈ I | (i, i
′
) ∈ E}.
Parameters:
o
it
= Indicates whether node i is occupied
by an obstacle at time-step t.
s
im
= Indicates whether node i is the
starting position of agent m.
g
im
= Indicates whether node i is the goal
position of agent m.
t
m
max
= The maximum available time step for
agent m to complete its travel.
d
ii
′
= The distance between node i and node
i
′
in the graph.
Decision Variables:
X
itm
= Indicates whether agent m is located
at node i at time-step t.
A
tm
= Indicates whether agent m has reached
its goal position at time-step t.
Y
ii
′
tm
= Indicates whether agent m moves from
node i
′
to node i at time-step t.
Mathematical Model:
minimize
∑
m∈M
∑
t∈T
∑
i∈I
∑
i
′
∈N (i)
d
ii
′
·Y
ii
′
tm
(1)
subject to:
X
itm
≤ 1 − o
it
, ∀m, t, i (2)
X
i0m
= s
im
, ∀m, i (3)
∑
i∈I
X
itm
= 1 − A
tm
, ∀m, t (4)
∑
t∈T
X
itm
≥ g
im
, ∀m, i (5)
X
itm
≤
∑
i
′
∈N (i)
X
i
′
(t−1)m
, ∀m, i, t ∈ T \ {0} (6)
∑
t∈T
∑
i∈I
X
itm
(1 − g
im
) ≤ t
m
max
, ∀m (7)
A
(t+1)m
≤ A
tm
+
∑
i∈I
∑
j∈J
X
i jtm
· g
i jm
, ∀m,t (8)
Y
ii
′
tm
≤ X
i
′
tm
, ∀m, i, t ∈ T \ {0}, i
′
∈ N (i) (9)
Y
ii
′
tm
≤ X
itm
, ∀m, t, i, i
′
∈ N (i) (10)
Y
ii
′
tm
≥ X
itm
+ X
i
′
(t−1)m
− 1, (11)
∀m, i, t ∈ T \ {0}, i
′
∈ N (i)
X
itm
∈ {0,1}, ∀m, t, i (12)
Y
ii
′
tm
∈ {0,1}, ∀m, t, i, i
′
(13)
A
tm
∈ {0,1}, ∀m, t (14)
The objective function (1) aims to minimize the
total travel distance of all agents across the graph for
the agents from their starting positions to their respec-
tive goal positions while ensuring collision-free paths.
Constraint (2) prevents agents from entering nodes
blocked by any obstacle type at any time step. Con-
straint (3) guarantees that agents start their journey
from their predefined starting points. Constraint (4)
reinforces the condition that an agent is either present
at a node or inactive once it reaches its goal, prevent-
ing collisions. Constraint (5) indicates whether agents
have reached their predefined goals. Constraint (6) re-
stricts agents to move only to adjacent nodes, ensur-
ing valid movements within the graph. Constraint (7)
sets a maximum time limit for each agent to complete
its path. Constraint (8) specifies that an agent must
actively move toward its goal if not yet reached, but
once at the goal, it may remain stationary. Constraints
(9 & 10 & 11) ensure the flow variable accurately rep-
resents agent movements between nodes only when
both nodes are occupied consecutively. Finally, Con-
straints (12 & 13 & 14) enforce that all decision vari-
ables are binary.
5 PROPOSED MULTITIER
RESOLUTION APPROACH
In the context of MAPF solvers, valid paths for agents
are determined by either a single decision-maker (i.e.,
centralized) or multiple decision-makers (i.e., decen-
tralized) during travel (i.e., online) or before travel
(i.e., offline). Each approach has advantages and
disadvantages, and the choice must be made care-
fully, considering the requirements, limitations, and
attributes of the problem. The primary aim of this
study is to introduce a practical approach to tackle
the challenges of DPO-MAPF as outlined above. Our
DPO-MAPF problem involves both static and dy-
namic obstacles. While static obstacles are known be-
forehand and can be efficiently handled using central-
ized and offline solvers, dynamic obstacles introduce
partial observability, requiring a decentralized and on-
ICAART 2025 - 17th International Conference on Agents and Artificial Intelligence
566

line approach. To handle both dynamic and static ob-
stacles, we introduce a multitier approach comprising
the following key components and leveraging the ad-
vantages of various MAPF solver approaches:
1. Centralized and Offline Path Finding. The first
tier, illustrated at the top of Figure 2, generates
initial paths for each agent by considering only
static obstacles (i.e., ignoring uncertainty) in a
centralized and offline manner. This tier can em-
ploy either an optimal centralized and offline al-
gorithm or a suboptimal one, each with advan-
tages and disadvantages depending on the prob-
lem specifications and requirements. It is impor-
tant to emphasize that the proposed approach is
designed to be independent of the specific choice
of MAPF solver.
2. Decentralized and Online Conflict Resolution.
This tier independently executes each agent’s path
generated in the first tier until potential colli-
sions caused by uncertainty are detected. When
such conflicts arise, a revising strategy following
a consensus protocol is employed to adjust their
paths, dynamically preempting potential collision
in real-time as shown at the bottom of Figure 2.
Figure 2: Illustration of the Proposed Multitier Approach.
6 CONFLICT RESOLUTION
Dynamic obstacles are unknown in advance and only
become apparent when observed, which makes them
challenging to manage in centralized approaches. To
address this limitation, we propose integrating a de-
centralized and online conflict resolution method. In
our proposed approach, agents independently handle
any conflict while following their path. Recall the
field of view concept where agents can dynamically
observe a part of the graph on their route. When an
obstacle-based conflict is foreseen, the agent revises
its path accordingly via a revising strategy.
The proposed revising strategy firstly applies the
“WAIT” action to update the current path of the cor-
Algorithm 1: Proposed ACO for Revising Strategy.
Input: Graph G = (V,E), unavailable edges
Output: Conflict-free path for the agent
1 τ
i j
← 1 ∀ (i, j) ∈ E;
2 β ← β
initial
;
3 while termination condition not met do
4 for each ant do
5 repeat
6 Calculate transition probabilities for
available edges (Eq. 15);
7 Randomly select an edge;
8 Traverse on the chosen edge;
9 until ant reaches the goal or exceeds
travelling time limit;
10 Determine the incumbent path ;
11 Calculate reinforcement levels (Eq. 16);
12 Update pheromones (Eq. 17);
13 Decrease β linearly from β
initial
to β
final
;
14 if early-stopping condition is met then
15 Break the loop;
16 return The incumbent conflict-free path;
responding agent. However, the waiting tactic may
not always resolve some situations, such as corridor
cases (Sharon et al., 2015) and the irrational behav-
ior of dynamic entities. For such cases, a new path
must be reconstructed for that agent during travel.
To achieve this, we adapt the Ant Colony Optimiza-
tion (ACO) algorithm to generate a new conflict-free
path. ACO has proven effective for graph-based op-
timization (Stützle and Dorigo, 2004), particularly in
minimizing total travel time in complex path-finding
tasks (Dai et al., 2019; Huang et al., 2021). However,
applying the standard ACO directly to dynamic and
multiagent environments requires adaptation, also in-
corporating improvements in exploration - exploita-
tion, and hyperparameter tuning (Algorithm 1).
In our version, each agent independently exe-
cutes ACO from their current position to their goal.
Pheromone levels (τ), representing historical desir-
ability, are initially set to 1.0 for all edges (Line 1).
The algorithm stops when it reaches either the itera-
tion limit (e.g., 150) or an early-stopping condition,
where the threshold is set to 1/3 of the iteration limit
(Lines 3-15). In each iteration, multiple ants (e.g.,
75) are deployed, exploring within their travel time
limits (Lines 5-9). For an adaptation of ACO to DPO-
MAPF, a mechanism is essential to prevent conflicts
by prohibiting traversal through occupied or reserved
vertices and edges. For this purpose, the agent must
integrate environmental knowledge by marking cer-
tain edges as “unavailable”, considering (i) static ob-
stacles, (ii) positions of other agents at the current and
subsequent time steps, and (iii) current (t) and next
A Multitier Approach for Dynamic and Partially Observable Multiagent Path-Finding
567

(t + 1) positions of observed dynamic obstacles.
The ants randomly select edges based on tran-
sition probabilities defined by Equation 15 (Line 6)
while unavailable edges are always assigned a prob-
ability of zero. For the remaining edges, the transi-
tion probability is influenced by two factors: the cur-
rent pheromone level, τ
i j
(t), and heuristic informa-
tion, η
i j
, which corresponds to the inverse Manhattan
distance to the goal. The balance between exploration
and exploitation is controlled by the parameters α and
β. At the beginning, exploration is prioritized by set-
ting β to a high value (e.g., β
initial
= 5.0, Line 2). As
the algorithm progresses, β decreases linearly to β
final
(e.g., 0.5), encouraging exploitation of known paths
(Line 13). To maintain stable probabilities, α is fixed
at 1.0 throughout the process.
P
i j
(t) =
τ
i j
(t)
α
× η
β
i j
∑
N (i)
l
τ
il
(t)
α
× η
β
il
(15)
Once all ants complete their journeys, the best
path found so far (i.e., the incumbent path), is deter-
mined (Line 10). Pheromone levels are then updated
based on the ants’ performance. Edges traversed by
ants receive pheromone reinforcement, with the mag-
nitude determined by the ratio of the maximum travel
capacity to the travel cost (Equation 16, Line 11). In
contrast, non-traversed edges decay at a predefined
evaporation rate, ρ (e.g. 0.1), gradually reducing their
influence over time (Equation 17, Line 12).
∆τ
i j
(t) =
(
t
m
max
/L
k
if ant k uses edge (i, j)
0 otherwise
(16)
τ
i j
(t + 1) = (1 − ρ) × τ
i j
(t) +
∑
k
∆τ
i j
(t)
k
(17)
This enhanced ACO approach ensures robust path
revision by dynamically adapting to changing envi-
ronments. If the initial revision fails, the agent con-
tinues along its current path, monitoring for new op-
portunities to resolve conflicts as conditions evolve.
Conflicts can arise not only from dynamic obsta-
cles but also from interactions with other agents. In
such cases, while the prioritized agent determined by
a consensus protocol continues along its path, the oth-
ers are expected to concede by revising their paths. To
determine which agent receives priority, we introduce
two consensus protocols:
• Fair Token Protocol: Initially, all agents have
an equal number of tokens, and the agent who
obtains more tokens will be prioritized, as illus-
trated in Figure 3. The prioritized agent then loses
one token while the other agents gain one token,
ensuring fairness among the agents. Since, the
Figure 3: Fair Token Protocol.
obtained tokens will be considered in subsequent
conflicts. The protocol first considers urgent con-
ditions (e.g., reaching the end of travelling time
limit or failure in revising strategy). To evalu-
ate urgency, hypothetical revisions are applied to
all agents’ paths to assess if an urgent condition
would arise. Based on this evaluation, the agent
who has an urgency is prioritized. When urgency
is detected for more than one agent, prioritizing
is arbitrarily assigned. If no urgency is detected,
the token difference is considered. When agents
hold the same number of tokens, the difference
in cost between their current and their hypothet-
ical revised paths is used as a tiebreaker. This
token-based protocol, inspired by (Eran et al.,
2021), ensures feasibility and fairness. Unlike
their negotiation-based strategy, we implement a
rule-based token allocation approach.
• Probability-Based Protocol: This protocol uses
a probabilistic approach to determine the likeli-
hood of other agents conceding to a particular
agent by considering factors such as the number
of agents involved (N), the remaining travel time
limit (C
m
= t
m
max
−t
m
current
) and remaining distance
to the goal of agent m, D
m
. The risk factor as-
sociated with failing to reach the goal if agent
m will concede is computed using Equation 18.
The priority score helps agents efficiently resolve
conflicts, as indicated in Equation 19. Subse-
quently, P
m
concede
is determined by considering the
normalized priority score and the risk factor, as
outlined in Equation 20, and calculates the proba-
bility of other agents conceding to agent m. Con-
sequently, this protocol prioritizes the agents ran-
domly based on the assigned probabilities.
R
m
=
ˆ
D
m
· (1 −
ˆ
C
m
) (18) PS
m
= C
m
− D
m
(19)
P
m
concede
= (
ˆ
PS
m
· R
m
)/(
L
∑
l=1
ˆ
PS
l
· R
l
) (20)
ICAART 2025 - 17th International Conference on Agents and Artificial Intelligence
568
7 EXPERIMENTAL EVALUATION
As DPO-MAPF is a novel challenge, no benchmark
algorithms are available for direct comparison. In-
stead, we investigate what extent we have solved this
problem. For this purpose, we assess various aspects
of the proposed algorithm across multiple scenarios
and configurations to demonstrate the impact and per-
formance of key components.
7.1 Experimental Setup
To facilitate experiments, we developed a custom map
generator to create diverse MAPF simulation setups.
This generator produces environments tailored to dif-
ferent scenarios using unique random seeds, allowing
for variations in static and dynamic obstacle densi-
ties, the number of agents, and map sizes. We de-
signed 132 different map configurations with dimen-
sions of 10 × 10, 15 × 15, 20 × 20, and 25 × 25, ac-
commodating 3 to 12 agents and dynamic obstacles.
These configurations included static obstacle densi-
ties of 5%, 10%, 15%, and 20%, with three random
seeds assigned to each scenario. The maximum to-
tal time step was set to twice the Manhattan distance
between each agent’s initial and target locations.
For the evaluation, the first tier uses either an
optimal (CBSH2-RTC (Li et al., 2021a)) or a sub-
optimal (EECBS (Li et al., 2021b)) solver. Addi-
tionally, we run 9,504 scenarios, including different
algorithm configurations with three different random
seeds due to the non-deterministic nature of ACO.
We also utilize five evaluation metrics: success rate,
runtime, concession difference, Earth Mover’s Dis-
tance (EMD), and optimality gap. The success rate
assesses how effectively the algorithms handle uncer-
tainty, while runtime measures the processing time.
The number of concessions made by each agent at the
end of a scenario is recorded, and the maximum con-
cession difference among agents is obtained, reflect-
ing how fairly the protocols prioritize agents during
conflicts. Finally, the EMD quantifies changes in a
path after applying the revision process (Rubner et al.,
1998; Wiedemann et al., 2021). The average EMD
for all agents at the end of each scenario is consid-
ered, making it a key metric for assessing the impact
of the revision process. The optimality gap measures
the difference in the objective value between found
solution and optimal solution.
For each randomly generated scenario, we use a
commercial solver (e.g., GUROBI) to obtain optimal
solutions and validate the existence of feasible solu-
tions for a more reliable evaluation. Through our LP
formalization, we calculate the optimality gap and en-
sure that only operationally feasible and solvable sce-
narios are included in the evaluation. However, the
Certainty Assumption (Winston, 2022) does not hold
due to the inherent uncertainty in DPO-MAPF. There-
fore, dynamic obstacles are treated as fully observable
and known in advance for the LP solution.
Furthermore, Section 7.2 and Section 7.3 evaluate
the distinct configurations of the proposed multitier
approach. It is worth noting that ideal results aim for
a higher success rate, a lower optimality gap, a shorter
runtime and a lower concession difference. For each
evaluation metric, normality tests and statistical group
comparisons are applied to identify significant differ-
ences. If a significant difference is observed within
a group, corresponding pairwise statistical tests are
conducted for post-hoc analysis, with detailed expla-
nations provided in the Appendix.
7.2 Evaluation of Multitier Components
This section evaluates the performance of the pro-
posed multitier approach by analyzing the impact of
the utilization of a centralized solver (i.e., first tier)
and various consensus protocols (i.e., second tier).
Besides primary protocols, we include a random strat-
egy that randomly prioritizes agents. Furthermore, we
compare the performance of optimal (CBSH2-RTC)
and sub-optimal (EECBS) solvers in the first tier.
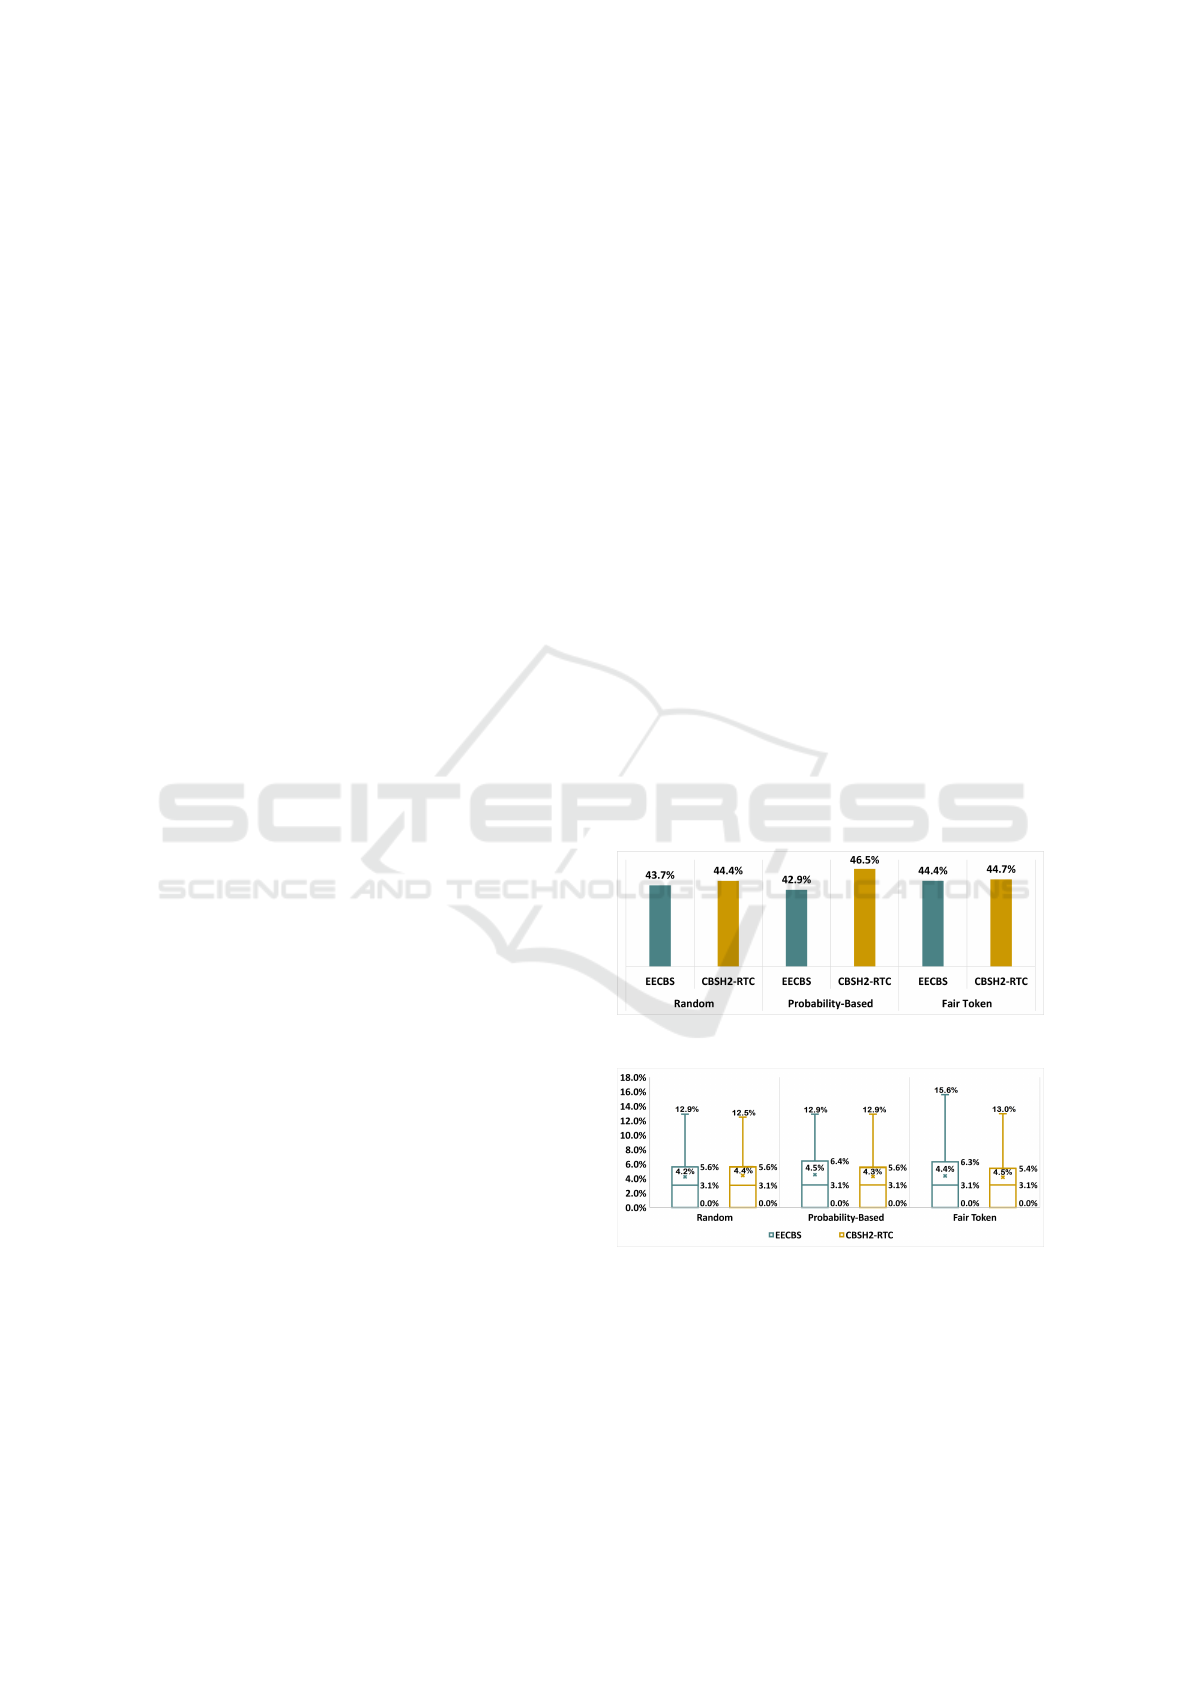
Figure 4: Success Rate of Multitier Components.
Figure 5: Optimality Gap of Multitier Components.
Figures 4 and 5 illustrate the performance of the
proposed approach across different configurations in
terms of success rate and optimality gap, respec-
tively. The Probability-Based protocol with the opti-
mal solver achieves the highest success rate (46.5%),
while the same protocol with the sub-optimal solver
A Multitier Approach for Dynamic and Partially Observable Multiagent Path-Finding
569
records the lowest success rate (42.9%). Although
the optimal solver generally shows a slightly higher
success rate, no statistically significant difference is
observed in the group test (p ≈ .313 > .05). Ad-
ditionally, the Probability-Based protocol with the
sub-optimal solver exhibits the worst optimality gap
(4.5%), while the Random protocol with the sub-
optimal solver shows the best optimality gap (4.2%),
again with no statistically significant difference in the
group test (p ≈ .994 > .05).
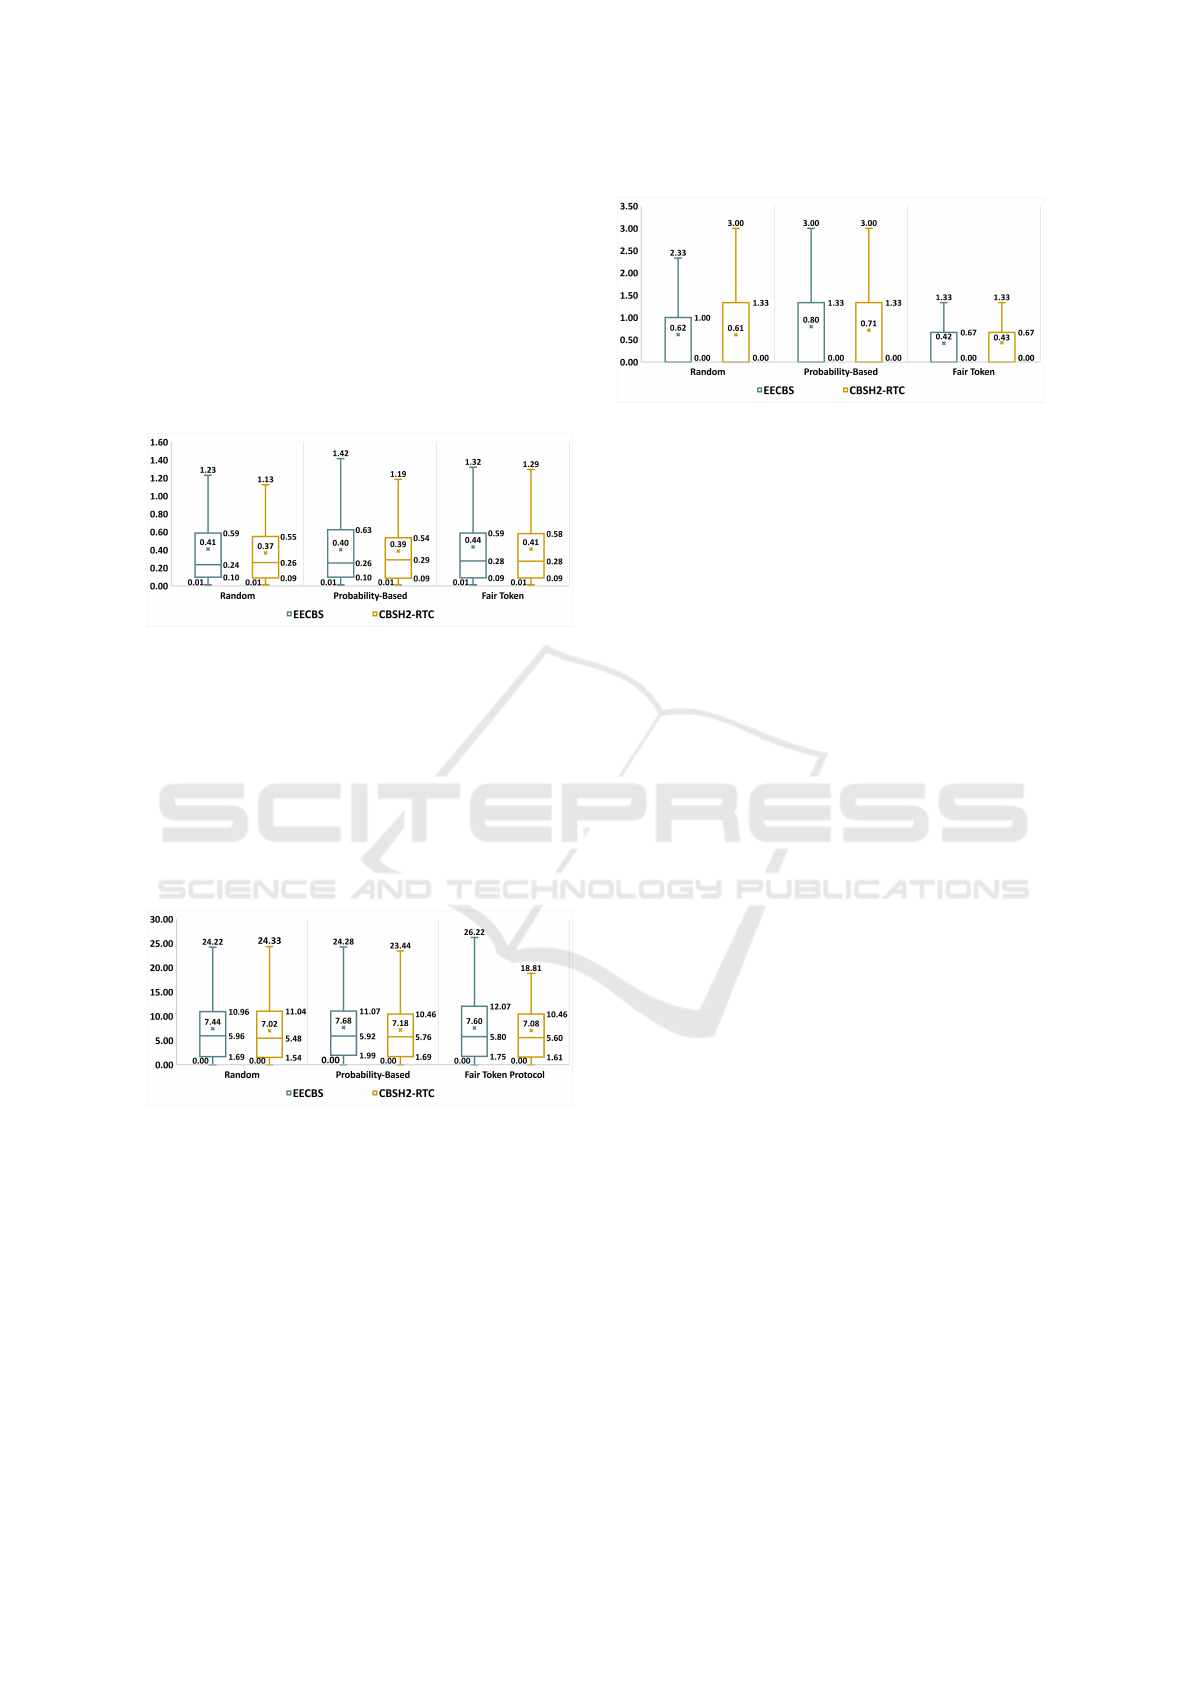
Figure 6: Runtime (sec) of Multitier Components.
In terms of runtime, the Fair-Token protocol with
the sub-optimal solver has a statistically significant
longer runtime, as confirmed by the group test (p ≈
.003 < .05) and displayed in Figure 6. This is be-
cause, unlike other protocols that only revise the
paths of non-prioritized agents, the Fair-Token pro-
tocol evaluates potential urgency by considering hy-
pothetical revisions for all agents, including the prior-
itized one. This additional evaluation step increases
the runtime.
Figure 7: Average EMD of Multitier Components.
Moreover, Figure 7 presents the average EMD,
which measures the magnitude of path changes for
each configuration. No significant differences, as in-
dicated by the group test (p ≈ .168 > .05). This anal-
ysis indicates that consensus protocols and the cen-
tralized solver have no substantial impact on the suc-
cess rate, optimality gap, or runtime, as they do not
directly affect the revision of the paths taken by the
agents in DPO-MAPF.
Furthermore, Figure 8 shows the maximum con-
cession difference among agents at the end of a sce-
nario. The Fair-Token protocol, with both optimal
Figure 8: Max. Concession Diff. of Multitier Components.
and suboptimal solvers, achieves the greatest fairness
(0.43 and 0.42, respectively), while the Probability-
Based protocol with the both solvers records the worst
fairness (0.71 for the optimal solver and 0.80 for the
suboptimal one). Statistically significant differences
are observed across all combinations in the group test
(p ≈ .000 < .05). The Fair-Token protocol, specifi-
cally designed to promote fairness, results in the low-
est concession difference overall. On the other hand,
the Probability-Based protocol tends to frequently
prioritize a single agent with the highest risk of fail-
ing to complete its path, potentially leading to unfair
situations.
7.3 Evaluation of Revising Strategy
The Fair-Token protocol with the optimal solver
(CBSH2-RTC) is the best performing configuration
for our multitier approach based on the evaluation re-
sults. Using this configuration, this section evaluates
the performance of proposed revising strategy by ex-
amining different aspects, including:
• No-Revising: A baseline scenario where no re-
vising strategy is applied.
• Only Waiting: A configuration that employs only
the “Waiting” strategy as a revising method.
• Basic ACO: Our basic variant of ACO adapted to
DPO-MAPF, introducing “unavailable edges” (ar-
eas ants cannot traverse) and limiting ants’ travel
based on the maximum time step of the agent.
• Enhanced ACO: Our enhanced variant of Basic
ACO incorporating the following proposed im-
provements: (i) applying the “Waiting” strategy
before ACO, (ii) implementing an early-stopping
condition, and (iii) dynamically β adjustment.
Figure 9 shows the success rate of the revising
strategies, indicating that Enhanced ACO statistically
significantly outperforms No-Repairing, Only Wait-
ing, and Basic ACO (44.7% vs. 18.9% & 23.5% &
39.9%). Note that the group test shows the statisti-
cally significant difference among revising strategies
ICAART 2025 - 17th International Conference on Agents and Artificial Intelligence
570
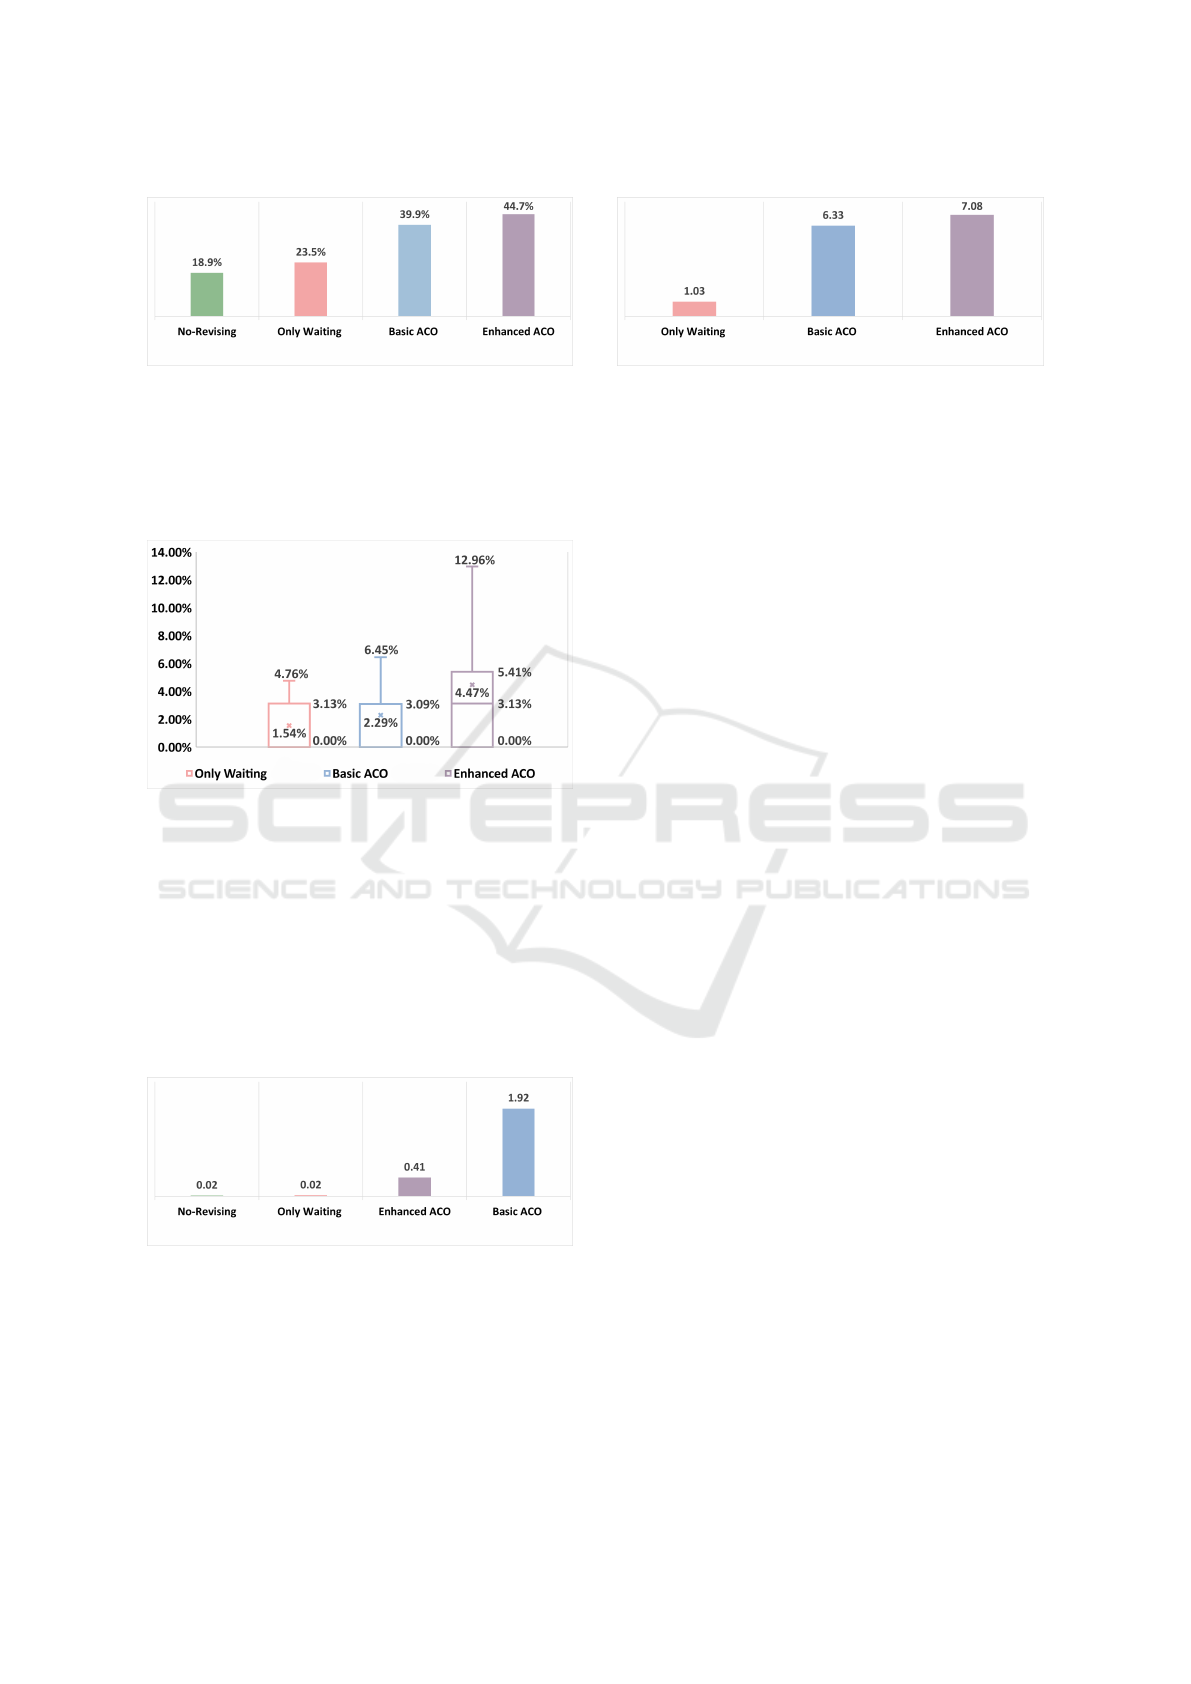
Figure 9: Success Rate for Revising Strategies.
(p ≈ .000 < .05). Basic ACO also statistically outper-
forms No-Repairing and Only Waiting, indicating that
the traditional Only Waiting strategy struggles to han-
dle the non-rational behavior of dynamic obstacles,
underscoring the importance of path reconstruction.
Figure 10: Optimality Gap for Revising Strategies.
Furthermore, Figure 10 presents the optimality
gap among the strategies, where the difference in the
group test is statistically significant (p ≈ .000 < .05).
Despite the increase in success rate, Enhance ACO
has the worst optimality gap (4.47%), indicating a
trade-off in the proposed enhancements. Note that the
optimality gap can be only calculated for successfully
completed scenarios, meaning that the gap between
strategies becomes less relevant when the difference
in success rates is statistically significant.
Figure 11: Runtime (sec) for Revising Strategies.
Moreover, Figure 11 illustrates the runtime for
each revising strategy, with a statistically significant
difference in the group test (p ≈ .00 < .05). The Ba-
sic ACO strategy yields the slowest runtime (1.92 sec)
while the No-Revising and Only Waiting achieve the
fastest one (0.02 sec). This result denotes that ACO
Figure 12: Average EMD for Revising Strategies.
process increases the runtime to resolve conflicts but
achieves a higher success rate. However, the early-
stopping condition and the use of waiting strategy
enhancements successfully reduce the redundant pro-
cessing time without compromising the success rate.
Figure 12 presents the average EMD for each re-
vising strategy, with a statistically significant differ-
ence in the group test (p ≈ .000 < .05). Regarding
to average EMD, Enhanced ACO revises paths more
extensively than the other versions (7.08 vs. 6.33 and
1.03). The results suggest that more substantial up-
dates tend to increase the success rate, the optimality
gap, and the runtime. The correlations between av-
erage EMD and optimality gap (0.106), success rate
(0.550), and runtime (0.504) are also observed.
Notably, the LP formulation overlooks the uncer-
tainty challenges of the DPO-MAPF problem. This
means that both the lower bound (i.e., optimal value)
and the feasibility check provided by LP for randomly
generated scenarios may not be achievable due to
the lack of situational awareness. While this limita-
tion complicates analysis and reasoning, the LP solu-
tion still serves as a valuable baseline for evaluation.
Our proposed approach might already be achieving
the best possible performance under ideal conditions,
but this remains uncertain due to the inherent unpre-
dictability of DPO-MAPF.
8 CONCLUSION
Uncertainty in real-world scenarios arises from the
stochastic or unpredictable behaviors of other enti-
ties and events in the environment. To better account
for such uncertainties, this study extends the tradi-
tional MAPF problem by introducing partially ob-
servable and dynamically moving obstacles, referred
to as DPO-MAPF. To address this challenge, we pro-
pose a multitier solution approach. In the first tier,
a centralized and offline path planning algorithm is
employed to find conflict-free paths for each agent,
considering only static and fully observable obstacles.
The second tier involves a decentralized and online
conflict resolution process that employs a heuristic-
A Multitier Approach for Dynamic and Partially Observable Multiagent Path-Finding
571

based revising strategy (i.e., ACO) and a consensus
protocol to resolve conflicts arising from the uncer-
tainty challenges in DPO-MAPF.
For evaluation, we developed a grid-based frame-
work, which enables the random generation of sce-
narios with varying map sizes, agent counts, and ob-
stacle densities. Additionally, a linear programming
approach using a commercial solver was developed to
validate the feasibility of the randomly generated sce-
narios. The evaluation results show that the proposed
revising strategy improves the success rate under the
uncertainty of DPO-MAPF, although it slightly in-
creases the optimality gap and extends the runtime.
Furthermore, the results indicate that the magnitude
of revision is correlated with success rate, runtime,
and optimality gap. While the first tier employs state-
of-the-art approaches (CBSH2-RTC and EECBS), us-
ing an optimal solver yields better outcomes. For
consensus protocols, Fair Token protocol provides the
greatest fairness among agent without compromising
performance. In summary, the decentralized and on-
line conflict resolution approach enables agents reach
their goals under uncertainty and enhances fairness
among agents, which is crucial in certain real-world
applications.
Our problem definition closely mirrors real-life
scenarios by incorporating uncertainty, making it ap-
plicable for applications such as autonomous vehicle
navigation, drone fleet coordination, and warehouse
robotics. Future work could focus on refining the re-
vising strategy, including (i) experimenting with dif-
ferent field-of-view ranges, (ii) utilizing initial paths
instead of constructing them from scratch, and (iii)
optimizing the balance between success rate, optimal-
ity gap, and runtime to develop more robust solutions
for DPO-MAPF. Further analysis should expand the
variety of scenarios (e.g., larger map sizes, a higher
number of agents, or existing benchmark scenarios
from (Stern et al., 2021)) by identifying alternative
approaches for validation and optimal values rather
than LP due to the scalability and uncertainty issues.
Additionally, this study establishes a benchmark for
performance comparison in future research, as DPO-
MAPF is a newly defined problem with no alternative
algorithms available thus far.
ACKNOWLEDGEMENTS
We sincerely thank Prof. Burcu Balçık and Assoc. Prof.
Mehmet Önal for her valuable insights and guidance, which
have greatly contributed to the development of this work.
REFERENCES
Aljalaud, F., Kurdi, H., and Youcef-Toumi, K. (2023). Bio-
inspired multi-uav path planning heuristics: A review.
Mathematics, 11(10):2356.
Dai, X., Long, S., Zhang, Z., and Gong, D. (2019). Mo-
bile robot path planning based on ant colony algorithm
with a* heuristic method. Frontiers in neurorobotics,
13:15.
Desaraju, V. R. and How, J. P. (2012). Decentralized path
planning for multi-agent teams with complex con-
straints. Auton. Robots, 32(4):385–403.
Eran, C., Keskin, M. O., Cantürk, F., and Aydo
˘
gan, R.
(2021). A decentralized token-based negotiation ap-
proach for multi-agent path finding. In European
Conference on Multi-Agent Systems, pages 264–280.
Springer.
Huang, S., Yang, D., Zhong, C., Yan, S., and Zhang, L.
(2021). An improved ant colony optimization algo-
rithm for multi-agent path planning. In 2021 Interna-
tional Conference on Networking Systems of AI (IN-
SAI), pages 95–100. IEEE.
Kasaura, K., Yonetani, R., and Nishimura, M. (2023). Pe-
riodic multi-agent path planning. In AAAI Conference
on Artificial Intelligence.
Keskin, M. O., Cantürk, F., Eran, C., and Aydo
˘
gan, R.
(2024). Decentralized multi-agent path finding frame-
work and strategies based on automated negotia-
tion. Autonomous Agents and Multi-Agent Systems,
38(1):1–30.
Lam, E., Le Bodic, P., Harabor, D., and Stuckey, P. J.
(2022). Branch-and-cut-and-price for multi-agent
path finding. Computers & Operations Research,
144:105809.
Li, J., Harabor, D., Stuckey, P. J., Ma, H., Gange, G., and
Koenig, S. (2021a). Pairwise symmetry reasoning for
multi-agent path finding search. Artificial Intelligence,
301:103574.
Li, J., Ruml, W., and Koenig, S. (2021b). Eecbs: A
bounded-suboptimal search for multi-agent path find-
ing. In Proceedings of the AAAI conference on artifi-
cial intelligence, volume 35, pages 12353–12362.
Morag, J., Stern, R., and Felner, A. (2023). Adapting
to planning failures in lifelong multi-agent path find-
ing. In Proceedings of the International Symposium
on Combinatorial Search, volume 16, pages 47–55.
Netter, J. and Vamvoudakis, K. G. (2023). Decentral-
ized multi-agent motion planning in dynamic environ-
ments. In 2023 American Control Conference (ACC),
pages 1655–1660.
Okumura, K., Machida, M., Défago, X., and Tamura, Y.
(2022). Priority inheritance with backtracking for iter-
ative multi-agent path finding. Artificial Intelligence,
310:103752.
Peng, S. (2023). Multi-robot path planning combin-
ing heuristics and multi-agent reinforcement learning.
arXiv preprint arXiv:2306.01270.
Rubner, Y., Tomasi, C., and Guibas, L. (1998). A metric
for distributions with applications to image databases.
ICAART 2025 - 17th International Conference on Agents and Artificial Intelligence
572

In Sixth International Conference on Computer Vision
(IEEE Cat. No.98CH36271), pages 59–66.
Ryan, M. R. (2008). Exploiting subgraph structure in multi-
robot path planning. Journal of Artificial Intelligence
Research, 31:497–542.
Sartoretti, G., Kerr, J., Shi, Y., Wagner, G., Kumar,
T. S., Koenig, S., and Choset, H. (2019). Primal:
Pathfinding via reinforcement and imitation multi-
agent learning. IEEE Robotics and Automation Let-
ters, 4(3):2378–2385.
Semiz, F. and Polat, F. (2021). Incremental multi-agent
path finding. Future Generation Computer Systems,
116:220–233.
Sharon, G., Stern, R., Felner, A., and Sturtevant, N. R.
(2015). Conflict-based search for optimal multi-agent
pathfinding. Artificial Intelligence, 219:40–66.
Shofer, B., Shani, G., and Stern, R. (2023). Multi agent path
finding under obstacle uncertainty. In Proceedings of
the International Conference on Automated Planning
and Scheduling, volume 33, pages 402–410.
Standley, T. (2010). Finding optimal solutions to coopera-
tive pathfinding problems. In Proceedings of the AAAI
conference on artificial intelligence, volume 24, pages
173–178.
Stern, R. (2019). Multi-agent path finding–an overview. Ar-
tificial Intelligence: 5th RAAI Summer School, Dol-
goprudny, Russia, July 4–7, 2019, Tutorial Lectures,
pages 96–115.
Stern, R., Sturtevant, N., Felner, A., Koenig, S., Ma, H.,
Walker, T., Li, J., Atzmon, D., Cohen, L., Kumar,
T., Barták, R., and Boyarski, E. (2021). Multi-agent
pathfinding: Definitions, variants, and benchmarks.
Proceedings of the International Symposium on Com-
binatorial Search, 10:151–158.
Stützle, T. and Dorigo, M. (2004). Ant Colony Optimiza-
tion. The MIT Press.
Verbari, P., Bascetta, L., and Prandini, M. (2019). Multi-
agent trajectory planning: A decentralized iterative
algorithm based on single-agent dynamic rrt*. 2019
American Control Conference (ACC), pages 1977–
1982.
Wan, Q., Gu, C., Sun, S., Chen, M., Huang, H., and Jia,
X. (2018). Lifelong multi-agent path finding in a dy-
namic environment. In 2018 15th International Con-
ference on Control, Automation, Robotics and Vision
(ICARCV), pages 875–882.
Wiedemann, T., Vlaicu, C., Josifovski, J., and Viseras, A.
(2021). Robotic information gathering with reinforce-
ment learning assisted by domain knowledge: An ap-
plication to gas source localization. IEEE Access,
9:13159–13172.
Winston, W. (2022). Operations Research: Applications
and Algorithms. Cengage Learning.
APPENDIX
The components of proposed approaches (mentioned in 7.2)
are evaluated through a series of statistical analyses to en-
sure their reliability and consistency during the evaluation
process. Firstly, normality tests using the Shapiro-Wilk test
were conducted, and all evaluation metrics (average EMD,
optimality gap, runtime, and max. concession difference)
failed across all groups. Consequently, non-parametric tests
were applied for further comparison.
For success rate, the Cochran’s Q test was used and in-
dicated no significant difference (p ≈ .313 > .05). Sim-
ilarly, the average EMD was evaluated using the Fried-
man test, which showed no significant difference (p ≈
.168 > .05). Lastly, the optimality gap was analyzed with
the Kruskal-Wallis test, yielding no significant difference
(p ≈ .994 > .05). Additionally, for both runtime and max.
concession difference, the Friedman test was applied and
showed significant differences for both metrics (p ≈ .003 <
.05 for runtime, p ≈ .000 < .05 for max. concession Differ-
ence), prompting pairwise comparisons using the Wilcoxon
signed rank test (Table 2).
Table 2: Pairwise Comparisons (p-values) for Runtime and
Max. Concession Difference.
Comparison Runtime Max. Concession Difference
Random (EECBS) vs Fair Token (EECBS) .030 .002
Probability-Based (CBSH2-RTC) vs Fair Token (EECBS) .019 .000
Fair Token (EECBS) vs Random (CBSH2-RTC) .005 .012
Fair Token (EECBS) vs Probability-Based (EECBS) .008 .000
Random (EECBS) vs Probability-Based (CBSH2-RTC) .330 .179
Random (EECBS) vs Random (CBSH2-RTC) .085 .957
Random (EECBS) vs Fair Token (CBSH2-RTC) .829 .003
Probability-Based (CBSH2-RTC) vs Random (CBSH2-RTC) .543 .092
Probability-Based (CBSH2-RTC) vs Probability-Based (EECBS) .510 .519
Probability-Based (CBSH2-RTC) vs Fair Token (CBSH2-RTC) .274 .000
Fair Token (EECBS) vs Fair Token (CBSH2-RTC) .340 .900
Random (CBSH2-RTC) vs Probability-Based (EECBS) .232 .074
Random (CBSH2-RTC) vs Fair Token (CBSH2-RTC) .178 .003
Probability-Based (EECBS) vs Fair Token (CBSH2-RTC) .513 .001
Now, the revising strategies (mentioned in 7.3) are eval-
uated through a series of statistical analyses. For all evalua-
tion metrics (optimality gap, runtime, average EMD) failed
the normality test (i.e., Shapiro-Wilk), leading to the use of
non-parametric tests again, illustrated in Table 3. The Fried-
man test was applied for runtime and average EMD all show
significant differences (p ≈ .000 < .05), followed by the
Wilcoxon signed rank test for pairwise comparisons. For
the optimality gap, the Kruskal-Wallis test indicated signifi-
cant differences (p ≈ .000 < .05), prompting Conover-Iman
test for pairwise comparisons. Finally, success rate were
analyzed using Cochran’s Q test, which also showed signif-
icant differences (p ≈ .000 < .05), followed by McNemar’s
test for pairwise comparisons.
Table 3: Pairwise Comparisons (p-values) for Revising
Strategies.
Comparison Optimality Gap Average EMD Runtime Success Rate
Enhanced ACO vs Basic ACO .000 .014 .000 .023
Enhanced ACO vs Only Waiting .000 .000 .000 .000
Basic ACO vs Only Waiting .402 .000 .000 .000
Basic ACO vs No-Repairing - - .000 .000
Enhanced ACO vs No-Repairing - - .000 .000
Only Waiting vs No-Repairing - - .000 .005
A Multitier Approach for Dynamic and Partially Observable Multiagent Path-Finding
573
