
An Airline Profit Management Model with
Overbooking and No-Shows
Elias Olivares-Benitez
1a
, Ana Paula Orozco Esparza
2
, Juan Orejel
1b
and Catya Zuniga
3c
1
Faculty of Engineering, Universidad Panamericana, Alvaro del Portillo 49, Zapopan 45010, Mexico
2
Faculty of Business Administration and Economics, European University Viadrina, Frankfurt (Oder), Germany
3
Faculty of Technology, Amsterdam University of Applied Sciences, Amsterdam, The Netherlands
Keywords: Airline Profit, Overbooking, No-Show, Seat Inventory, Airplane Selection.
Abstract: This research presents a model for airline profit optimization considering information such as demand
forecasts, seat inventory, operational costs, overbooking penalties, expected no-shows, and time-dependent
fare classes. The main decisions in the model are the selection of the aircraft, the number of seats sold per
fare, including overbooking, and the number of denied seats. The model incorporates probabilistic information,
like the expected demand and the expected proportion of no-shows. The model is constructed as a
deterministic mixed-integer program. Some data was estimated using information acquired from different
industry sources, and some data was set with reasonable estimations. A factorial experiment was designed to
understand the importance of different parameters. The input variables were the overbooking compensation
penalty, the no-show probabilities per fare and time block, and the seat demand. Using a statistical analysis,
it was determined that the no-show estimation has the most significant impact on the total revenue, and the
demand forecast after that. These results highlight the importance of precise estimations to increase the
airline’s profit.
1 INTRODUCTION
The airline industry is a vital engine for the global
economy, facilitating international trade, tourism, and
cultural exchange. By connecting countries and
fostering stronger diplomatic and economic ties, the
industry plays a pivotal role in enabling both the
movement of people and goods across borders.
Airlines act as critical links in the global supply chain,
ensuring the smooth transport of essential goods and
services. This role becomes especially important in an
increasingly interconnected world, where efficient air
transportation can bolster trade partnerships and
enhance supply chain resilience.
Managing flight operations in such a complex,
globalized industry requires airlines to consider a
wide range of factors. Key variables like flight
schedules, passenger capacity, routes, and market
demand must be balanced to ensure efficient and
profitable operations. The rapid evolution of the
a
https://orcid.org/0000-0001-7943-3869
b
https://orcid.org/0009-0006-4882-6057
c
https://orcid.org/0009-0004-2327-1337
market has driven the adoption of modern
technologies and sophisticated frameworks. This shift
has allowed airlines to not only streamline their
operations but also develop advanced pricing
strategies to remain competitive in a crowded market.
One of the central techniques used to manage this
complexity is profit management, which optimizes
the relationship between supply and demand by
adjusting ticket prices, seat availability, and
operational expenses based on real-time market
conditions. Some parameters that must be considered
for the balance of ticket pricing and seat allocation are
customer segmentation, seat capacity, and the
handling of cancellations and no-shows. In
anticipation of no-shows and last-minute
cancellations, airlines often sell more tickets than the
actual number of available seats. This approach,
while beneficial in maximizing revenue, introduces a
risk of penalties when too many passengers show up
and there are insufficient seats. However, research
264
Olivares-Benitez, E., Esparza, A. P. O., Orejel, J. and Zuniga, C.
An Airline Profit Management Model with Overbooking and No-Shows.
DOI: 10.5220/0013159900003893
In Proceedings of the 14th International Conference on Operations Research and Enterprise Systems (ICORES 2025), pages 264-270
ISBN: 978-989-758-732-0; ISSN: 2184-4372
Copyright © 2025 by Paper published under CC license (CC BY-NC-ND 4.0)

shows that the revenue generated from overbooking
usually outweighs the costs associated with
compensating passengers who are denied boarding
(Rothstein, 1985; Ely et al., 2017). This practice
exemplifies the delicate balancing act airlines must
perform between profitability and customer service.
The effective management of overbooking
requires sophisticated modeling, especially when
cancellations and no-shows are factored in. Airlines
often use data-driven methods, relying on historical
data and forecasting tools to predict demand and
cancellations accurately. Studies such as those by
(Subramanian et al., 1999) and (Minga et al., 2003)
highlight various models that airlines employ to
manage these uncertainties. By optimizing booking
limits based on real-time and historical data, airlines
can minimize losses while ensuring they meet
customer demand. Algorithms and adaptive methods,
like those developed by (Ball and Queyranne, 2009),
have proven effective in refining demand estimates
and setting optimal booking limits.
The application of linear programming has been a
common thread across numerous studies in the airline
sector, emphasizing its importance in optimizing both
passenger and cargo operations. (Belobaba, 1987)
explored fare segmentation, showing how airlines
adjust ticket pricing based on advance bookings. This
segmentation allows airlines to offer lower fares to
early bookers while limiting the number of tickets in
each fare class to prevent financial losses. (Belobaba
et al., 2009) also noted that over 30% of denied
boarding requests result from passengers seeking
alternatives after being denied a seat, reflecting the
complexity of managing demand and ticket sales.
(Kunnumkal et al., 2012) delved into
overbooking, a widespread practice where airlines
sell more tickets than available seats, accounting for
potential no-shows. They employed randomized
linear programming to model overbooking scenarios
and no-shows, providing a strategy that helps airlines
maximize profits while minimizing the risk of unsold
seats. Introducing an upper bound criterion in their
research helps airlines determine the optimal
overbooking levels, mitigating financial losses from
customer no-shows.
(Aydin et al., 2013) study some dynamic
programming models for airline revenue
management considering overbooking and no-shows.
(Soleymanifar, 2019) addresses four constraints
relevant to airline revenue management problem:
flight cancellation, customer no-shows, overbooking,
and refunding. They develop a linear program closely
related to the dynamic program formulation of the
problem, which is later used to approximate the
optimal decision rule for rejecting or accepting
customers. Although Dynamic Programming is the
preferred approach used in the literature, there are
some linear programming formulations close to the
one proposed in this work in (Gaul and Winkler,
2019), (Gaul and Winkler, 2019), and (Xiao et al.,
2024).
In this research, we extend the model proposed by
(Kunnumkal et al., 2012) and originally presented by
(Bertsimas and Popescu, 2003) to incorporate some
elements like the selection of the aircraft based on
costs and capacities and an ethical control on the
overbooking. We also present a sensitivity analysis
with variations to a base instance to understand the
significance of the parameters on the profit objective
function. The main contributions of this paper are the
inclusion of aircraft selection and ethical
overbooking, along with the use of a design of
experiments to study the significance of some
parameters on the total profit.
The structure of the rest of the paper is described
next. The Methodology in Section 2 explains the
description of the problem, the mathematical model
proposed, and the data used for the case study.
Section 3 describes the results of the base instance
and the results of the sensitivity analysis using a
design of experiments. Section 4 shows the main
conclusions of the study and the proposed future
work.
2 METHODOLOGY
In this problem, we have different types of aircrafts,
with different capacities and operational costs. The
seats of the aircraft are divided by fare classes, and
each class has a fare that changes as time passes. Time
is “discretized” as time blocks, with the main idea
being that once the seats for a time block are sold, the
price increases when the time block is closer to the
departure time. Some important parameters
independent of the decision-making are the
compensation fee for denied boarding, the expected
demand of seats for fare class and time block, the
probability of no-shows for seats sold per time block
and fare class. Other parameters, dependent on the
decision-making are the fares for class and time
block, the maximum portion of sold seats that show
for check-in and are denied boarding, and the
minimum capacity to cover for an aircraft to be
operated. The variables are the seats sold, the denied
boarding seats, both per aircraft, fare class, and time
block, and the variable that determines the operation
An Airline Profit Management Model with Overbooking and No-Shows
265

of the aircraft. Following is shown the list of sets,
parameters and variables.
Sets:
J Set of products (fare classes), j = 1, ..., n
T Set of time blocks, t = 1, …, T
I Set of aircrafts, i = 1, …, |I|
Parameters:
f
ijt
price of fare class j in aircraft i in time block t
θ
ij
penalty for denying boarding of fare class j in
aircraft i
u
i
fixed cost for operating flight in aircraft i
q
jt
show probability for a seat (passenger) in fare
class j sold in time block t
c
ij
seat capacity for fare class j in aircraft i
p
jt
expected demand for fare class j sold in time
block t
α maximum proportion of sold (shown) seats
with denied boarding
β minimum capacity utilization to operate one
aircraft
Variables:
y
ijt
seats in aircraft i for fare class j sold in time
block t
w
ijt
denied boardings (seats) in aircraft i for fare
class j sold in time block t
v
i
binary variable, equal to 1 if aircraft i is
operated, equal to 0 otherwise
With these variables, a mixed-integer program is
constructed to maximize the profit with the following
objective function and constraints:
𝑀𝑎𝑥
𝑓
𝑦
−𝜃
𝑤
∈,∈, ∈
−𝑢
∈
𝑣
(1)
Subject to:
𝑞
𝑦
−𝑤
∈
≤𝑐
𝑣
,∀𝑖∈𝐼,
𝑗
∈
𝐽
(2)
𝑦
∈
≤𝑝
,∀
𝑗
∈
𝐽
,𝑡∈𝑇
(3)
𝑤
≤𝛼𝑞
𝑦
, ∀𝑖∈𝐼,
𝑗
∈
𝐽
,𝑡∈𝑇
(4)
𝑞
𝑦
−𝑤
∈,∈
≥
𝛽𝑐
∈
𝑣
,∀𝑖∈𝐼
(5)
𝑦
,𝑤
∈𝑍
, ∀𝑖∈𝐼,
𝑗
∈
𝐽
,𝑡∈𝑇
(6)
𝑣
∈
0,1
, ∀𝑖∈𝐼
(7)
In this model, the objective function (1)
determined that the profit is the sum of the sold seats
minus the penalty for denied boarding, all minus the
operational cost of selecting certain aircraft for the
flight. Constraints (2) are the constraints for not
exceeding the seat capacity per aircraft. Constraints
(3) establish that the number of sold seats does not
exceed the demand. Constraints (4) determine that the
seats (passengers) that show for check-in whose
boarding is denied do not exceed a certain proportion
of the seats sold, controlled by parameter
α
.
Constraints (5) help to ensure that a certain capacity
of the aircraft is sold to operate the flight. Constraints
(6) and (7) are the domains for the integer and binary
variables.
The model considers both overbooking and no-
shows, with constraints ensuring capacity limits are
respected. The number of seats denied boarding
should not exceed a certain percentage of total sales.
The introduction of binary variables accounts for
whether a flight will operate based on a threshold
capacity to ensure flights only operate when
economically viable. This constraint prevents
revenue losses due to low-demand flights.
Even after accounting for no-shows, seat sales
may exceed the available capacity on certain flights,
forcing airlines to deny boarding to some passengers.
This scenario suggests collaboration between airlines
to accommodate denied passengers. If the
compensation fee for denied boarding is too cheap,
there is an incentive for a high overbooking. In this
case, the “ethical selling” constraint in Equation (4)
prevents an excess of boarding denials.
The model was programmed in AMPL, using
Gurobi 10.0.1 as the optimizer, and solved in a laptop
with Intel Core i7 CPU at 2.8GHz with 32 Gb RAM.
An instance was constructed based on an example
flight. A one-leg-based approach is adopted for
simplicity, for the Frankfurt-Mexico City route. The
flight can be done in 4 different aircraft with the
capacities shown in Table 1.
Table 1: Aircraft capacities per fare class.
Aircraft Econom
y
Econom
y
Plus Business
Boeing
747-8
244 32 80
Airbus
A320
96 48 -
Embraer
E-170
56 - 20
Embraer
E-175
60 8 20
The fares for the flights for each aircraft and class
are shown in Table 2.
ICORES 2025 - 14th International Conference on Operations Research and Enterprise Systems
266

Table 2: Fare per aircraft and class, in €.
Aircraft Econom
y
Econom
y
Plus Business
Boeing
747-8
413 663 1288
Airbus
A320
351 521 -
Embraer
E-170
425 - 1159
Embraer
E-175
339 389 1154
The sale of seats was divided into three time
blocks. The fare per class increases 50% from the first
to the second time block, and it increases 70% from
the first to the third block. The third block is closer to
the departure time scheduled for the flight. The base
compensation fee for denying boarding is the ticket
fare plus 600 €. The operational costs for the flight in
the different aircraft are estimated from information
of (EUROCONTROL, 2023), shown in Table 3.
Table 3: Operational costs, in €.
Aircraft O
p
erational cost
Boein
g
747-8 189265
Airbus A320 105542
Embraer E-170 268065
Embraer E-175 105542
In the base instance, the demand was assumed the
same as the available capacity per fare class. This
demand was divided into a proportion of 30% for the
first time block, 30% for the second time block, and
40% for the third time block. The parameters
determined by the decision maker were set to α = 0.1
for the maximum seats with denied boarding, and β =
0.7 for the minimum capacity threshold for using a
certain aircraft.
The proportion of “shows”, i.e., the passengers
who bought a seat and who showed up to check-in at
the airport or who did not cancel their purchase, is
shown in Table 4. Since the fares are more expensive
in the last time block, closer to the departure time, the
proportion of no-shows is lower.
Table 4: Proportion of “shows” for check-in.
Fare class Time
b
lock 1
Time
b
lock 2
Time
b
lock 3
Econom
y
0.6 0.6 0.75
Econom
y
Plus 0.7 0.7 0.85
Business 0.8 0.8 0.95
3 RESULTS
For the base instance, the results are summarized in
Table 5. Only the flight operated by the Boeing 747-
8 was selected. Table 5 shows the number of seats
planned to be sold for this aircraft per fare class and
time block. The behavior of the passengers is to
consume the cheapest seats first, thus depleting the
seats planned for sale in the first time block. Once
those seats are sold, the fare is changed to the next
time block, with a more expensive price. After the
seats of this block are sold, the fare changes again,
being more expensive closer to the departure time.
Table 5: Seats sold per fare class and time block.
Fare class Time
b
lock 1
Time
b
lock 2
Time
b
lock 3
Econom
y
42 137 182
Economy Plus 0 15 17
Business 7 36 48
Because of the proportion of no-shows, even if the
number of sold seats exceeds the capacity of the
aircraft, there is no need to deny boarding because of
the overbooking. The expected profit was 268197 €
for this flight. When the demand is high, and more
than one aircraft is selected for a flight, a negotiation
with the airport may allow different flights operated
with different aircrafts with a short difference in the
departure times.
A factorial experiment was designed to
understand the impact of changes in some parameters.
Three parameters were modified, the compensation
fee for denying boarding to a sold seat, the no-show
proportion per fare class and time block, and the
expected demand. Table 6 shows the low and high
levels for the compensation fee with respect to the
base instance. These levels were explored because the
base instance did not deny boarding to overbooked
seats, and we wanted to know if the fee reduction may
incentivize boarding denials. Table 7 shows the low
and high levels for the “show” proportion. These
levels were set to explore the effect of the variability
in the no-shows. The high level is the combination of
“high” for all the fare classes, and the same happens
for the “low” level. Table 8 shows the low and high
levels for the change of demand with respect to the
base instance. These levels were set considering
periods of high demand, like holidays and vacations.
An Airline Profit Management Model with Overbooking and No-Shows
267
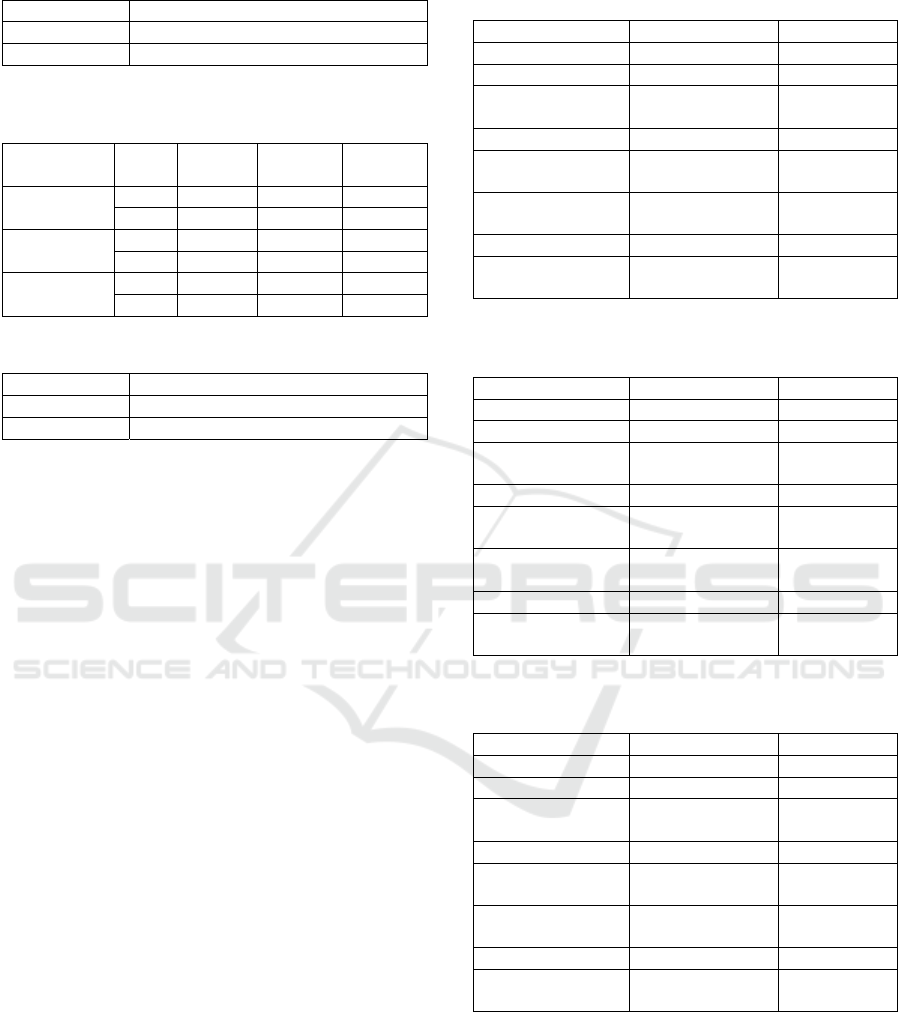
Table 6: Low and high levels for the compensation fee.
Level Chan
g
e in the com
p
ensation fee
Low 25%Ticket
p
rice + 600EUR
Hi
g
h 50%Ticket
p
rice + 600EUR
Table 7: Low and high levels for the proportion of “shows”
for check-in.
Fare class Level Time
b
lock 1
Time
b
lock 2
Time
b
lock 3
Economy Low 0.55 0.55 0.70
Hi
g
h 0.65 0.65 0.80
Economy
Plus
Low 0.65 0.65 0.80
Hi
g
h 0.75 0.75 0.90
Business Low 0.75 0.75 0.90
High 0.85 0.85 1.00
Table 8: Low and high levels for the demand.
Level Chan
g
e in the deman
d
Low +40% in ever
y
p
erio
d
High +70% in every perio
d
Thus, a full factorial of 2
3
experiments was run.
Table 9 summarizes the averages of the instances
with the high and low levels of the compensation fee.
Table 10 summarizes the averages of the instances
with the high and low levels of the “show” rate. Table
11 summarizes the averages of the instances with the
high and low levels of demand. The output variables
are:
Total profit;
%sale per fare class, i.e. the proportion of seats
sold from the expected demand;
%denied per fare class, i.e. the proportions of
denying boarding seats from the total of sold
seats;
%average aircraft utilization, i.e. the proportion
of seats used from the available capacity.;
The results for some instances indicated that more
than one aircraft should be selected. It becomes
evident that this is necessary for periods of high
demand where additional capacity is needed. In this
case, the averages reported consider the accumulated
quantities for all the aircraft selected.
As can be observed, an increase in the
compensation fee and the proportion of “shows”
reduce the total profit. And a high demand increases
the profit. In all the cases, the levels proposed
generated some denied boarding seats. In all the
cases, the aircraft utilization is above 99%.
Table 9: Averages of instances with high and low levels of
the compensation fee.
Output variable Low level High level
Total profit 314841.96 308618.93
%sale Econom
y
76.22 72.26
%sale Economy
Plus
80.88 77.03
%sale Business 54.44 54.44
%denied
Econom
y
3.48 0.34
%denied
Econom
y
Plus
5.12 2.12
%denied Business 7.91 7.91
%average aircraft
utilization
99.95 99.88
Table 10: Averages of instances with high and low levels of
the show (no-show) levels.
Output variable Low level High level
Total
p
rofit 348354.02 275106.87
%sale Econom
y
80.83 67.65
%sale Economy
Plus
84.70 73.21
%sale Business 57.39 51.48
%denied
Econom
y
2.36 1.45
%denied
Economy Plus
3.37 3.87
%denied Business 7.48 8.33
%average aircraft
utilization
99.92 99.92
Table 11: Averages of instances with high and low levels of
the show (no-show) levels.
Out
p
ut variable Low level Hi
g
h level
Total
p
rofit 303622.76 319838.13
%sale Econom
y
80.99 67.49
%sale Economy
Plus
86.20 71.71
%sale Business 59.12 49.76
%denied
Econom
y
1.05 2.76
%denied
Economy Plus
2.38 4.86
%denied Business 7.98 7.83
%average aircraft
utilization
99.87 99.97
The results were analyzed statistically using an
Analysis of Variance (ANOVA) assuming normal
distributions of the output variables. The results are
shown in Table 12.
ICORES 2025 - 14th International Conference on Operations Research and Enterprise Systems
268

Table 12: P-values for the ANOVA.
Output
variable
Compensation
fee
“Shows”
p
roportion
Demand
Total
p
rofit >0.05 0.008 0.038
%sale
Econom
y
>0.05 >0.05 >0.05
%sale
Economy
Plus
0.002 0.001 0.001
%sale
Business
>0.05 <0.001 <0.001
%denied
Econom
y
>0.05 >0.05 >0.05
%denied
Economy
Plus
0.022 >0.05 0.027
%denied
Business
>0.05 <0.001 <0.001
%average
aircraft
utilization
0.021 >0.05 0.015
The results obtained are mixed, but it can be
observed that the no-shows and the demand have a
significant impact on the Total profit and on the sales
of the most expensive fare classes.
4 CONCLUSIONS
This study used a deterministic model approach to
maximize total airline revenue, focusing primarily on
overbooking, passenger no-shows, operating costs,
demand, and capacity. The model also incorporated
compensation fees for denying boarding, which
influenced decision-making. The data estimated for
this case study enabled a sensitivity analysis, which
identified the parameters that significantly impact
profit. After running the tests, it was determined that
the compensation fee had minimal effect on profit,
while show probability and demand were the most
influential factors. Accurate demand forecasting and
no-show rates are crucial for airlines to ensure
positive profit. The main contributions of this paper
are the inclusion of aircraft selection and ethical
overbooking in a previously published optimization
model, along with the use of a design of experiments
to study the significance of some parameters on the
total profit.
However, some limitations emerged in the study.
The demand was based on fictional variations due to
a lack of prior data. Airlines with access to historical
flight data can use realistic variations and
complement these with no-show rates to better
estimate denied boarding. Another challenge was
estimating fixed or operational costs, which were
sourced from publicly available information.
Additionally, many airlines have agreements with
other carriers to accommodate denied boarding
passengers, offering discounted fees in such cases.
Future work could explore more advanced
scenarios, such as multiple flight legs, integrating
different aircraft capacities, hubs, and nested or non-
nested seat allocation. Additionally, varying the time
range could also enhance the model’s applicability.
ACKNOWLEDGEMENTS
This work was supported by Universidad
Panamericana through grant [UP-CI-2024-GDL-08-
ING].
REFERENCES
Aydın, N., Birbil, Ş. İ., Frenk, J. B. G., Noyan, N. (2013).
Single-Leg Airline Revenue Management with
Overbooking. Transportation Science, 47(4), 560–583.
DOI: 10.1287/trsc.1120.0444
Ball M.O., Queyranne M. (2009). Toward robust revenue
management: Competitive analysis of online booking.
Operations Research, 57 (4), 950 – 963. DOI:
10.1287/opre.1080.0654
Belobaba, P. (1987). Air travel demand and airline seat
inventory management (thesis). Massachusetts Institute
of Technology, Massachusetts.
Belobaba, P., Odoni, A. R., Barnhart, C. (2009). The Global
Airline Industry. John Wiley & Sons.
Bertsimas, D., Popescu, I. (2003). Revenue management in
a dynamic network environment. Transportation
Science, 37(3), 257–277. DOI: 10.1287/trsc.37.
3.257.16047
Ely, J.C., Garret D.F., Hinnosaar, T. (2017). Overbooking.
Journal of the European Economic Association, 15(6),
1258–1301. DOI: 10.1093/jeea/jvw025
EUROCONTROL (2023). EUROCONTROL Standard
Inputs for Economic Analyses. Available at
[12/05/2023]: https://ansperformance.eu/economics/
cba/standard-inputs/
Gaul, W., Winkler, C. (2019). Aviation Data Analysis by
Linear Programming in Airline Network Revenue
Management. In: Bauer, N., Ickstadt, K., Lübke, K.,
Szepannek, G., Trautmann, H., Vichi, M. (eds)
Applications in Statistical Computing. Studies in
Classification, Data Analysis, and Knowledge
Organization. Springer, Cham. DOI: 10.1007/978-3-
030-25147-5_1
Gaul, W., Winkler, C. (2020). Flight Passenger Behavior
and Airline Fleet Assignment. In: Imaizumi, T.,
Nakayama, A., Yokoyama, S. (eds) Advanced Studies
in Behaviormetrics and Data Science.
An Airline Profit Management Model with Overbooking and No-Shows
269

Behaviormetrics: Quantitative Approaches to Human
Behavior, vol 5. Springer, Singapore. DOI:
10.1007/978-981-15-2700-5_4
Kunnumkal, S., Talluri, K., & Topaloglu, H. (2012). A
randomized linear programming method for network
revenue management with product-specific no-shows.
Transportation Science, 46(1), 90–108. DOI:
10.1287/trsc.1110.0386
Minga L.M., Feng Y.-Q., Li Y.-J. (2003). Dynamic pricing:
Ecommerce - Oriented price setting algorithm.
International Conference on Machine Learning and
Cybernetics, 2, 893 – 898.
Rothstein, M. (1985). OR AND THE AIRLINE
OVERBOOKING PROBLEM. Operations Research,
33 (2), 237 – 248. DOI: 10.1287/opre.33.2.237
Soleymanifar, R. (2019). An LP based approximate
dynamic programming model to address airline
overbooking under cancellation, refund and no-show.
Yugoslav Journal of Operations Research, 29(1), 113–
133. DOI: 10.2298/yjor170918026s
Subramanian, J., Stidham, S., Lautenbacher, C. J. (1999).
Airline yield management with overbooking,
cancellations, and no-shows. Transportation Science,
33(2), 147–167. DOI: 10.1287/trsc.33.2.147
Xiao, F., Lai, K. K., Lau, C. K., & Ram, B. (2024). Robust
Overbooking for No-Shows and Cancellations in
Healthcare. Mathematics, 12(16), 2563. DOI:
10.3390/math12162563
ICORES 2025 - 14th International Conference on Operations Research and Enterprise Systems
270
