
Efficient Tiling of Point Features to 3D Tiles with Discrete LOD
Samuel Rundel
a
and Raffaele De Amicis
School of Electrical Engineering and Computer Science, College of Engineering, Oregon State University, Corvallis,
Oregon, U.S.A.
{rundels, raffaele.deamicis}@oregonstate.edu
Keywords:
3D Tiles, Point Features Tiling, Discrete Level of Detail (LOD) Geospatial Data Visualization, Forest
Information Model.
Abstract:
3D Tiles were developed to visualize geospatial data and deliver high-quality, interactive visualizations to
users over the Internet. However, there is a lack of direct methods to generate 3D Tiles from point features.
This paper introduces a novel method for generating high-fidelity, very large-scale 3D Tilesets directly from
geospatial point features. Our approach consistently produces 3D Tiles with well-defined Level of Detail
(LOD) and handles any quantity or type of feature without restrictions. Additionally, it allows for partial up-
dates of the Tileset in response to data changes, improving the efficiency of visualization. Our paper provides a
thorough comparison of our procedure with existing methods, demonstrating its advantages and effectiveness.
1 INTRODUCTION
The rapid growth in geographical data collection
has significantly increased demands on traditional
methods of data storage, processing, and visualiza-
tion (Kotsev et al., 2020; Breunig et al., 2020; Arm-
strong et al., 2019). The innovative framework de-
fined by the 3D Tiles open standard addresses these
challenges by enabling the efficient management and
visualization of large-scale 3D geospatial datasets.
Additionally, it enhances user experience by support-
ing real-time interaction with 3D visualizations, ef-
fectively meeting the rising expectations for interac-
tivity (Lu et al., 2021).
However, using 3D Tiles directly for creating and
streaming a 3D visualization of geospatial point fea-
tures is not possible, as 3D Tiles relies on the pro-
cessing of 3D geometry. The conventional method
of streaming point features using 3D Tiles typically
involves the creation of an intermediate 3D model,
tiling it, and then streaming it. Manual model cre-
ation is not only time-consuming and error-prone but
also costly. On the other hand, procedural methods
significantly reduce the time and cost associated with
3D model generation while ensuring accuracy (Run-
del and De Amicis, 2023). These procedurally gen-
erated models can be subsequently utilized to cre-
ate 3D Tiles, leading to a streamable model. How-
ever, this approach introduces some inflexibility due
a
https://orcid.org/0000-0001-9071-4979
to the required intermediate 3D model. Any changes
to the base dataset necessitate the complete regener-
ation of the intermediate model and the 3D Tileset.
Depending on the dataset’s size, this can be a com-
plex and time-consuming procedure. Furthermore,
the method as described is incapable of generating 3D
Tiles with discrete LOD support, which can substan-
tially improve the performance and fidelity of large-
scale datasets (Wang et al., 2023).
This paper presents a significant contribution by
introducing a novel procedure that efficiently pro-
duces high-fidelity, large-scale 3D Tilesets derived
from geospatial point features. Our approach ensures
a consistent output of 3D Tiles with well-defined
LODs without imposing any limitations on the quan-
tity or types (e.g., different tree species) of features.
The proposed method provides flexibility, enabling
partial regeneration of the 3D Tileset when there are
changes to the data, thereby enhancing the efficiency
of data visualization. We have conducted extensive
comparative tests against several other tile generators
to validate the effectiveness and superiority of our
procedure.
2 BACKGROUND AND RELATED
WORK
3D Tiles is an open standard developed by CesiumGS
for streaming and rendering extensive and complex
Rundel, S. and De Amicis, R.
Efficient Tiling of Point Features to 3D Tiles with Discrete LOD.
DOI: 10.5220/0013161200003912
Paper published under CC license (CC BY-NC-ND 4.0)
In Proceedings of the 20th International Joint Conference on Computer Vision, Imaging and Computer Graphics Theory and Applications (VISIGRAPP 2025) - Volume 1: GRAPP, HUCAPP
and IVAPP, pages 239-250
ISBN: 978-989-758-728-3; ISSN: 2184-4321
Proceedings Copyright © 2025 by SCITEPRESS – Science and Technology Publications, Lda.
239

3D geospatial data. The design of 3D Tiles ensures
broad device compatibility, which is of utmost impor-
tance in the Web3D digital era (Prandi et al., 2015).
This cross-platform compatibility allows 3D Tiles to
cater to various user requirements, thereby further
expanding its applicability and usefulness, making
them a suitable choice for a broad range of appli-
cations (Gune et al., 2018). Moreover, 3D Tiles
were purposefully designed to manage a variety of
3D datasets, including point clouds, 3D objects, and
meshes (Zhan et al., 2021).
3D Tiles combines effective tiling methods with
state-of-the-art visualization and rendering tech-
niques to achieve high-quality visualizations while
minimizing the end device’s requirements offering a
much higher flexibility than other formats (Zhan et al.,
2021). Additionally, since 3D Tiles was adopted as
an open standard by the Open Geospatial Consortium
(OGC), the format is generally easier to implement
and adapt and is better documented compared to al-
ternative formats (Zhan et al., 2021). Several appli-
cations can create 3D Tiles from 3D models. One
of the most common is Cesium Ion, a cloud-based
platform developed by CesiumGS. Depending on the
file format of the 3D model, Cesium Ion’s tiler can
convert a 3D model into either a Batched 3D-Model
(B3DM) tileset or an Instanced 3D-Model (I3DM)
tileset. We have observed significant limitations with
Cesium Ion’s tiling process, particularly regarding the
number of features in a dataset and, thus, model com-
plexity. When the feature count exceeds a threshold
close to 10
6
features, the application fails to com-
plete the tiling process. No additional information
about potential errors is given, but the tiling procedure
yields no results after several hours. Many modern
Forest Inventory Dataset (FID) and geospatial reposi-
tories far exceed 10
6
single features, especially when
they cover large areas, regions, or even countries.
A viable alternative to web-based applications for
creating 3D Tiles is Safe Feature Manipulation En-
gine (Safe FME), a data integration platform. Safe
FME provides tools for converting, transforming, and
integrating spatial and non-spatial data from different
sources and in different formats. It supports various
data formats and systems, making it a versatile solu-
tion for data integration tasks.
Safe FME can process 3D models of all com-
monly used formats and convert them into B3DM
tiles. However, this application has certain limita-
tions. One significant restriction is that it only gen-
erates 3D Tilesets with one level of hierarchy (one
defining JSON file). The parameters of Safe FME
either allow to generate small B3DM files, resulting
in one extremely large JSON file, or the generation
of large B3DM files, resulting in a small JSON file.
In both cases, these large files need to be downloaded
and processed by the client machine before rendering
can proceed. As such, a tileset containing large files,
being that B3DM files or JSON files can prevent the
scene from loading properly, and thus rendering the
3D Tiles unusable.
A third option for 3D model tiling is the open-
source project ”Obj2Tiles”, a component of the
larger OpenDroneMap project. Obj2Tiles utilizes
pre-generated Wavefront-Files (OBJ-Files) to gener-
ate 3D Tileset with multiple LODs. Large interme-
diate files are a prerequisite for tiling point features
using this tiler, which can be a drawback regarding
storage and resource use. The process of creating
tiles based on these intermediary files is resource-
intensive. Moreover, this process does not always
produce 3D Tilesets that are practical or suitable for
use for similar reasons as the Safe FME 3D Tiles
writer. Other research built upon 3D Tiles found in the
literature utilizes intermediate 3D models for tiling
or using proprietary formats (Chen et al., 2018; Gan
et al., 2017).
Geodan’s unique tiling software i3dm.export en-
ables the direct utilization of point features from Post-
GIS databases to generate 3D Tileset using instanced
3D models and a variable tiling size. While this
software provides valuable capabilities, it has several
limitations that impact its effectiveness in visualizing
densely clustered and complex features. Using raw
database information without adaptation often results
in tilesets with repetitive patterns, diminishing real-
ism and immersion. Random rotation of 3D mod-
els can mitigate this issue, especially when applied
across all three axes. However, i3dm.export restricts
rotation to the Z-axis (up-axis), leaving some repeti-
tion unresolved. Scaling also presents challenges in
i3dm.export, as scaling values must be pre-calculated
and stored in the database based on the 3D model.
Switching models requires recalculating these values,
limiting flexibility and adaptability.
A further limitation is the lack of support for
discrete LODs, preventing the assignment of differ-
ent models to the same feature point. Users must
therefore compromise between high-performance
overviews with poor close-up detail or detailed close-
ups with reduced performance for overviews.
Moreover, i3dm.export uses variable numbers of
point features per tile, causing changes in tile di-
mensions and hierarchy whenever data is updated.
This requires complete regeneration of the 3D Tile-
set, which may be manageable for static datasets but is
impractical for dynamic datasets like forests. Forests
frequently require updates due to natural or man-
GRAPP 2025 - 20th International Conference on Computer Graphics Theory and Applications
240
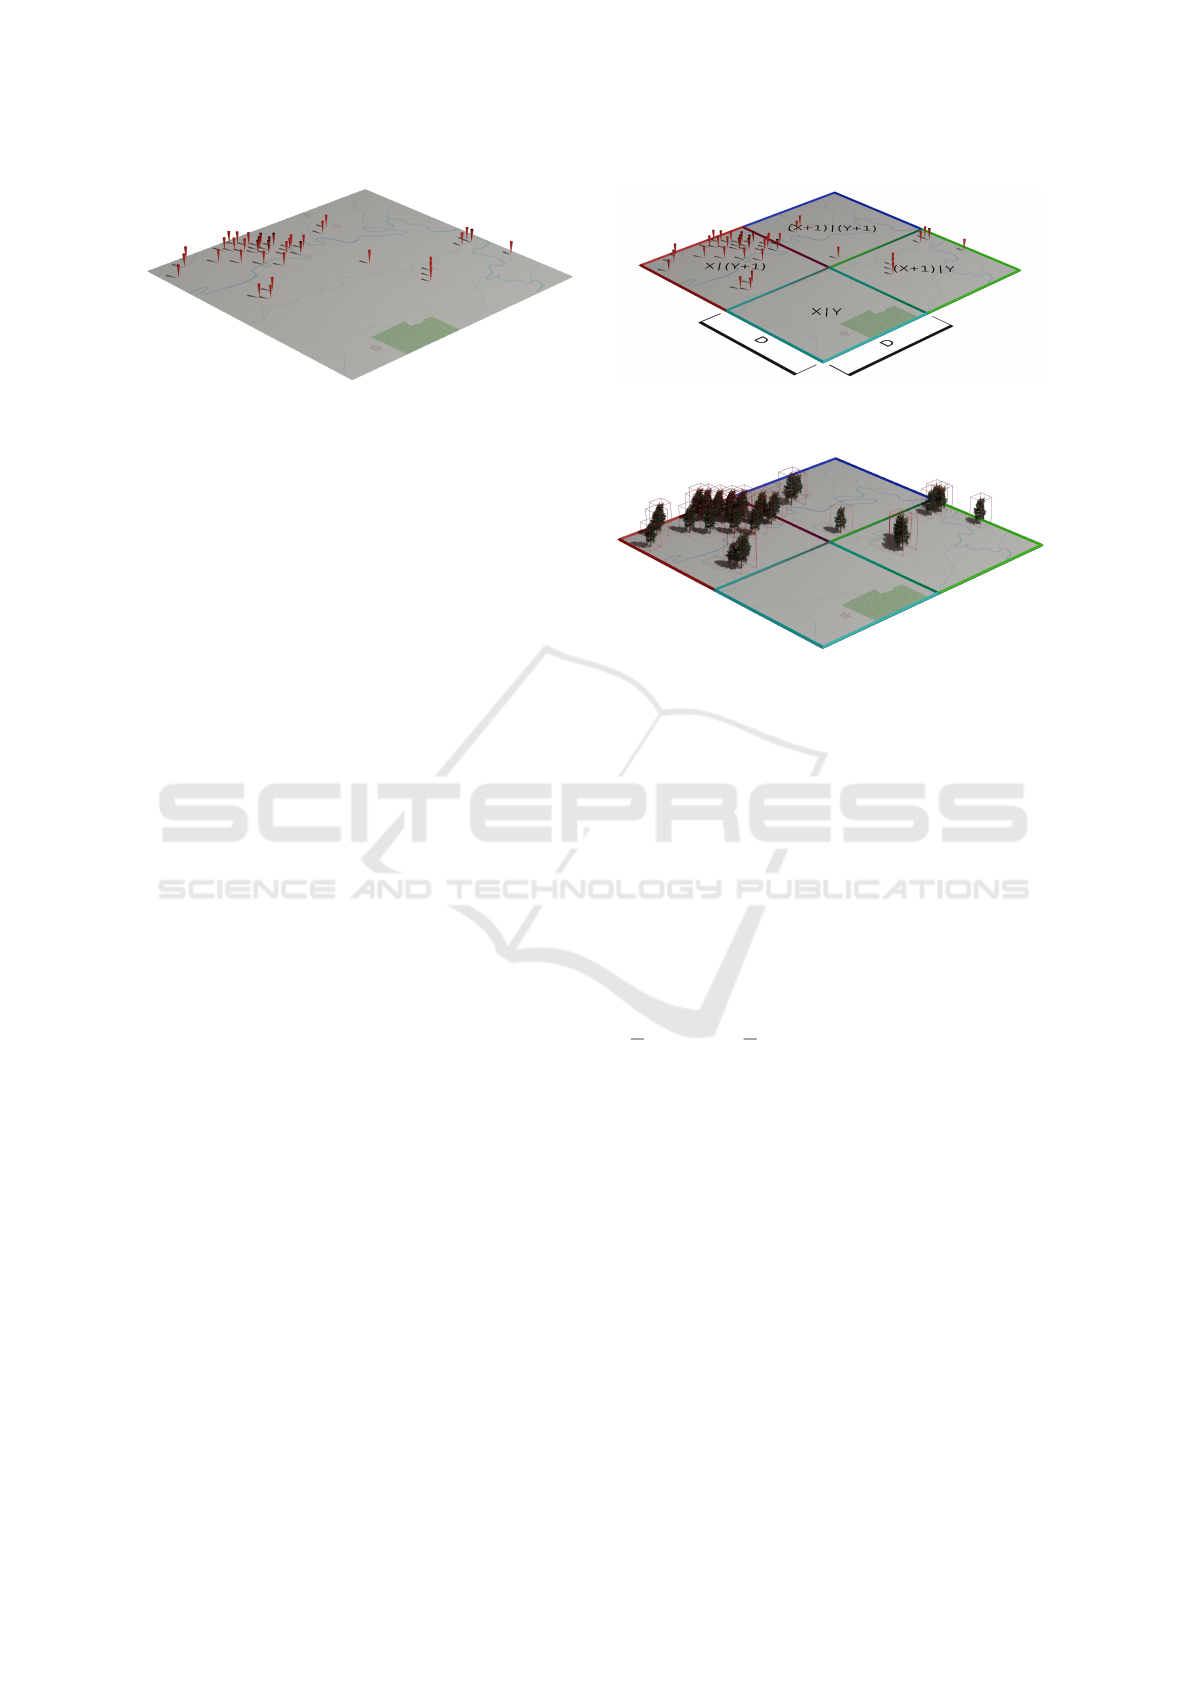
Figure 1: Step 1: Data Retrieval.
aged changes, and automated updates via Internet of
Things (IoT) systems (Singh et al., 2022) make regen-
erating entire tilesets infeasible for large datasets.
In response to these challenges, the authors of
this paper propose a novel tiling procedure that ad-
dresses the limitations described. Tested with over 2.8
million point features, the proposed method demon-
strates scalability and effectiveness, making it well-
suited for managing and visualizing large, dynamic
geospatial datasets.
3 TILING PROCEDURE
This section presents a detailed overview of our tiling
procedure, which we have designed, implemented,
and rigorously validated. The tiling procedure effec-
tively partitions the large dataset into smaller subsec-
tions, organizing them in a tree structure. By doing so,
we substantially reduced the size of each file, which
facilitates smooth streaming over the web. The out-
come of our approach is a tile structure that leverages
instanced models with discrete LOD. This minimizes
the performance demands on the end device, reduc-
ing load time and leads to a more efficient and user-
friendly experience.
The tiling procedure is split into 5 steps:
1. Data Retrieval (Figure 1)
2. Tiling (Figure 2)
3. Model Preparation & Population (Figure 3)
4. Elevation Retrieval (Figure 5)
5. Tileset Population (Figure 6)
6. 3D Tiles Generation (Figure 7)
3.1 Data Retrieval
Each point feature in the dataset is a coordinate ac-
companied by additional attributes (compare figure
1), such as the feature point’s type (e.g., tree species,
rock, grass). The point features can be sourced from
various sources, including CSV files, Shapefiles, and
Figure 2: Step 2: Tiling, with indications about the tile di-
mension (D) and tile identification (X, Y ).
Figure 3: Step 3: Model Population of the tiled features.
The calculated Bounding Volume (BV) of the models are
indicated in red.
PostGIS databases. The coordinates can be in any Co-
ordinate Reference System (CRS). The position of the
feature positions is transformed into Universal Trans-
verse Mercator (UTM) coordinates to simplify the re-
quired calculations during the tiling procedure. Addi-
tionally, all attribute units are standardized to meters
for uniform measurement.
3.2 Tiling
Based on the coordinates in UTM, the grid field of
each feature is calculated using the equations X =
j
f
x
D
k
and Y =
j
f
y
D
k
, where D is the dimension of each
tile (compare figure 2 and 7), and f
x
and f
y
are the
coordinates of a feature point. The resulting X and Y
identify the tile the feature is associated with (com-
pare figure 2, where the tiles are also indicated by
their color).
3.3 Model Preparation & Population
A significant distinction of the proposed tiling proce-
dure pertains to the referencing of 3D models within
a scene. Our approach presents the application with a
single 3D model for each combination of feature type
and LOD present in the scene. For example, if a scene
contains M different feature types (trees/rocks/. . . ),
the application uses M ∗ LOD
max
binary Graphics Li-
brary Transmission Format (glTF) files. The proposed
procedure is invariant to the original dimensions of
Efficient Tiling of Point Features to 3D Tiles with Discrete LOD
241
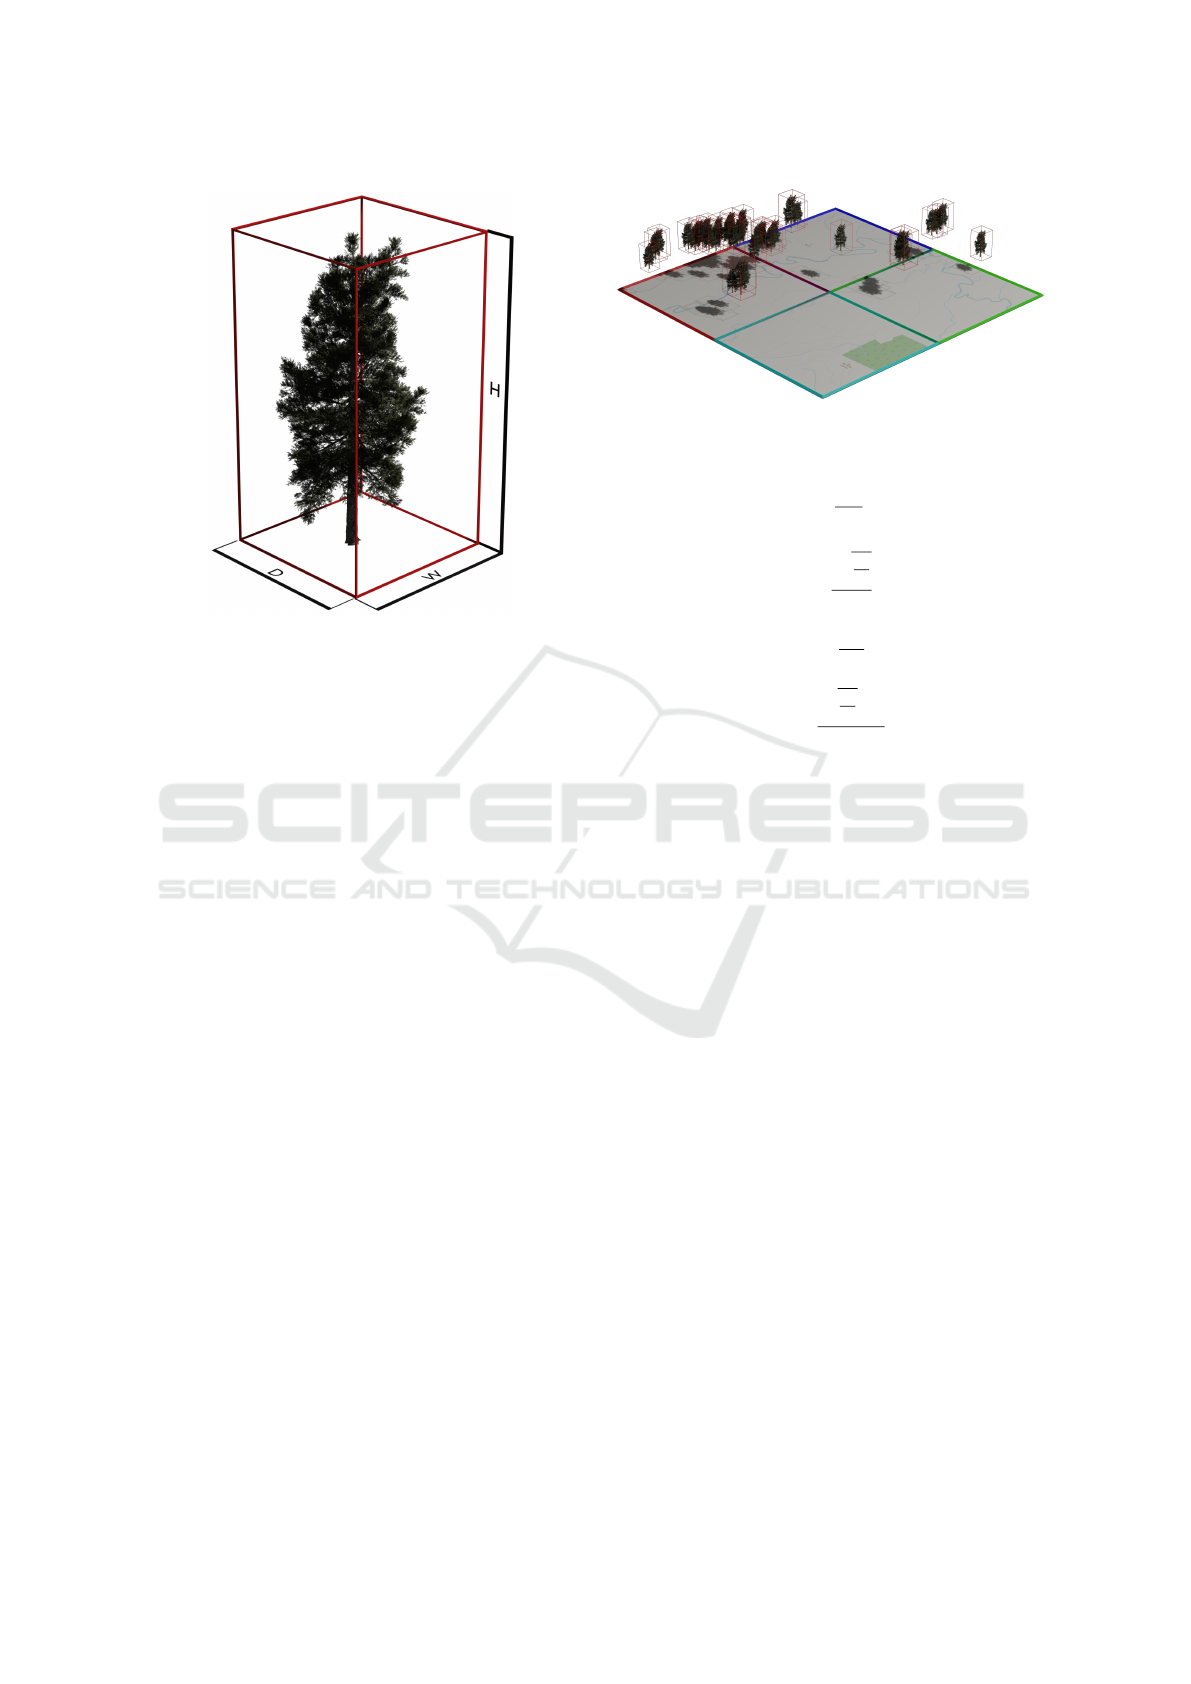
Figure 4: The different dimensions used for the calculation
of the scaling, namely height (M
H
), width (M
W
) and depth
(M
D
). The bounding volume of the 3D model is visualized
in red.
the 3D model as the necessary scaling for each feature
point and LOD is calculated during the tiling proce-
dure based on the corresponding dimensions of the
model in the glTF file.
After retrieving the model dimensions from the
glTF file, the values are stored within the application
(as M
w
(model width), M
d
(model depth), M
h
(model
height)) (compare figure 4. The dimensions are cru-
cial to calculate scaling and BV individually for each
feature and LOD.
3.3.1 Scaling
Since FIDs usually do not contain the tree dimensions
in X , Y , and Z, we have to utilize the Area (T
A
) and
the height (T
H
) of the trees for the calculation of the
model scaling. Using T
A
, T
H
, feature type, and LOD,
we calculate a non-uniform scaling (S) based on the
equations 2, 3 and 4 under the assumption that Y is
the up-axis of the tree.
The provided scaling method ensures that the 3D
models adhere to the tree dimensions found in the
FID, but does not ensure uniform scaling. Non-
uniform scaling can result in distortion when the
shape of the trees present in the FID does not closely
match the shape of the used 3D model. However,
if a 3D model representing an average specimen of
the tree species is used, these distortions are usually
small. The usage of multiple different models per
species and selection from these models based on the
shape, maturity and other metadata could further de-
Figure 5: Step 4: Elevation Retrieval.
crease distortion effects.
p =
M
w
M
d
(1)
S
x
=
q
T
A
p
M
w
(2)
S
y
=
T
H
M
h
(3)
S
z
=
q
T
A
p
∗ p
M
d
(4)
3.3.2 Randomization
To avoid repetitive patterns in the final visualization,
we apply random values for the rotation around the 3
axis (Y : 360
◦
, X /Z : ±7
◦
). These random values are
the same for all LODs of a feature.
3.3.3 Bounding Volume
During the visualization, the decision which features
are visualized is largely controlled by the BV of a
tile. The more accurate and closer matching the BV of
each individual tile and feature is, the more accurate
is the decision which features to load can be.
To achieve the most accurate BV possible, we cal-
culate the individual BV of the scaled 3D model for
each feature point, and use these BVs to calculate one
closely matching BV per tile (compare figure 4 and
6).
3.4 Elevation Retrieval
Even if the FID includes elevation data for individual
trees, the source may differ from the Digital Eleva-
tion Model (DEM) used for terrain visualization, ne-
cessitating the adjustment of the FID elevation data to
avoid floating features. Ideally, each feature point’s
elevation is retrieved from the visualization DEM us-
ing interpolation for added precision.
GRAPP 2025 - 20th International Conference on Computer Graphics Theory and Applications
242

Figure 6: Step 5: Tileset Population for a tile structure with
T = 2, resulting in a L
max
= 1.
3.5 Tileset Population
In our tile structure, L denotes the current level within
the tree, while T specifies the maximum number of
children each tile can have in any direction. Specifi-
cally:
• Tiles at level L > 0 contain at least one child tile
and can have up to T
2
child tiles.
• Tiles at L = 0 must contain at least one point fea-
ture, with no upper limit
The process of the tileset population is visible
when comparing figure 5 and 6. During the popula-
tion tiles of the lower level (here: L = 0, indicated in
red, green, blue and turquoise) are combined to form
tiles of the level L + 1 using T (here: 2) as parameter
until only one tile at L
max
(here: L
max
= 1) remains.
Each tile of L + 1 (yellow) uses the accumulated BV
of the child tiles to calculate a new BV.
This procedure results in a predictable, calculat-
able, and reproducible tree structure independent of
the total number of features.
3.6 Tileset Generation
We initiate the writing procedure using the last re-
maining tile (at L
m
ax) of the tileset population.
While writing the hierarchical tilling structure, the
procedure generates JSON files for tiles of a level
L > 0. At level L = 0, in addition to JSON files, we
generate I3DM files (compare figure 8. These files
are used for lightweight storage and rendering of the
instanced 3D models.
3.6.1 I3DM-Tilesets
The I3DM tiles are part of the 3D Tiles definition.
I3DM tiles store features using their position within
an Earth-Centered, Earth-Fixed (ECEF)-based CRS
(EPSG:4979). Additionally, each feature is associated
with scaling, Normal-Up, and Normal-Right-Vector.
The file concludes with either the glTF-model or a
reference to the model.
For each tile, feature type and LOD, a new tile is
generated. We utilize all previously calculated and
prepared feature properties (position, scaling, rota-
tion, elevation) are used to generate a transformation
matrix, which in turn is used to calculate the model
normals in relation to the ECEF position.
Each I3DM file is concluded by the reference to
the glTF model. We opted for the reference to opti-
mize the file size and enable potential caching of the
glTF model.
3.6.2 JSON-Tilesets
JSON tilesets are used to define the general structure
of tiles and reference the tiles’ content (in our case
either other JSON tiles or I3DM tiles, compare Figure
8).
In these JSON tiles, each content reference in-
cludes a Geometric Error (GE) value. The GE de-
termines the maximum distance at which the content
is displayed. The GE also enables automatic replace-
ment of a higher-level LOD with a lower-level LOD.
The used GE at L = 0 for each LOD is calculated us-
ing the formula LOD
max
−LOD
min
. The GE of tiles of
a higher L remains constant at 100. The chosen GEs
ensure that the visualization begins to display trees at
an appropriate distance and replaces LOD appropri-
ately. However, these values can be adjusted based on
personal preferences and requirements
The generated JSON and 3D Tileset tiles are fur-
ther organized into folders, with each folder corre-
sponding to the respective level of the tileset. The
result is a structured, leveled tileset with uniform
base grid cell sizes and precise positioning of features
within the scene.
4 VALIDATION AND TESTING
4.1 Case Study: the Elliott State
Research Forest
A highly detailed FID located in the Elliott State Re-
search Forest (ESRF) was used to validate and ver-
ify the proposed procedure. The Oregon Department
of Forestry originally collected this dataset in 2014
and 2015, and later, the Oregon State University Col-
lege of Forestry further augmented and updated it in
2022 (Department of Forestry, 2023). The dataset
represents a state-of-the-art, highly detailed FID, akin
to those currently collected and deployed at numerous
sites globally. As such, it provides an ideal sample
Efficient Tiling of Point Features to 3D Tiles with Discrete LOD
243
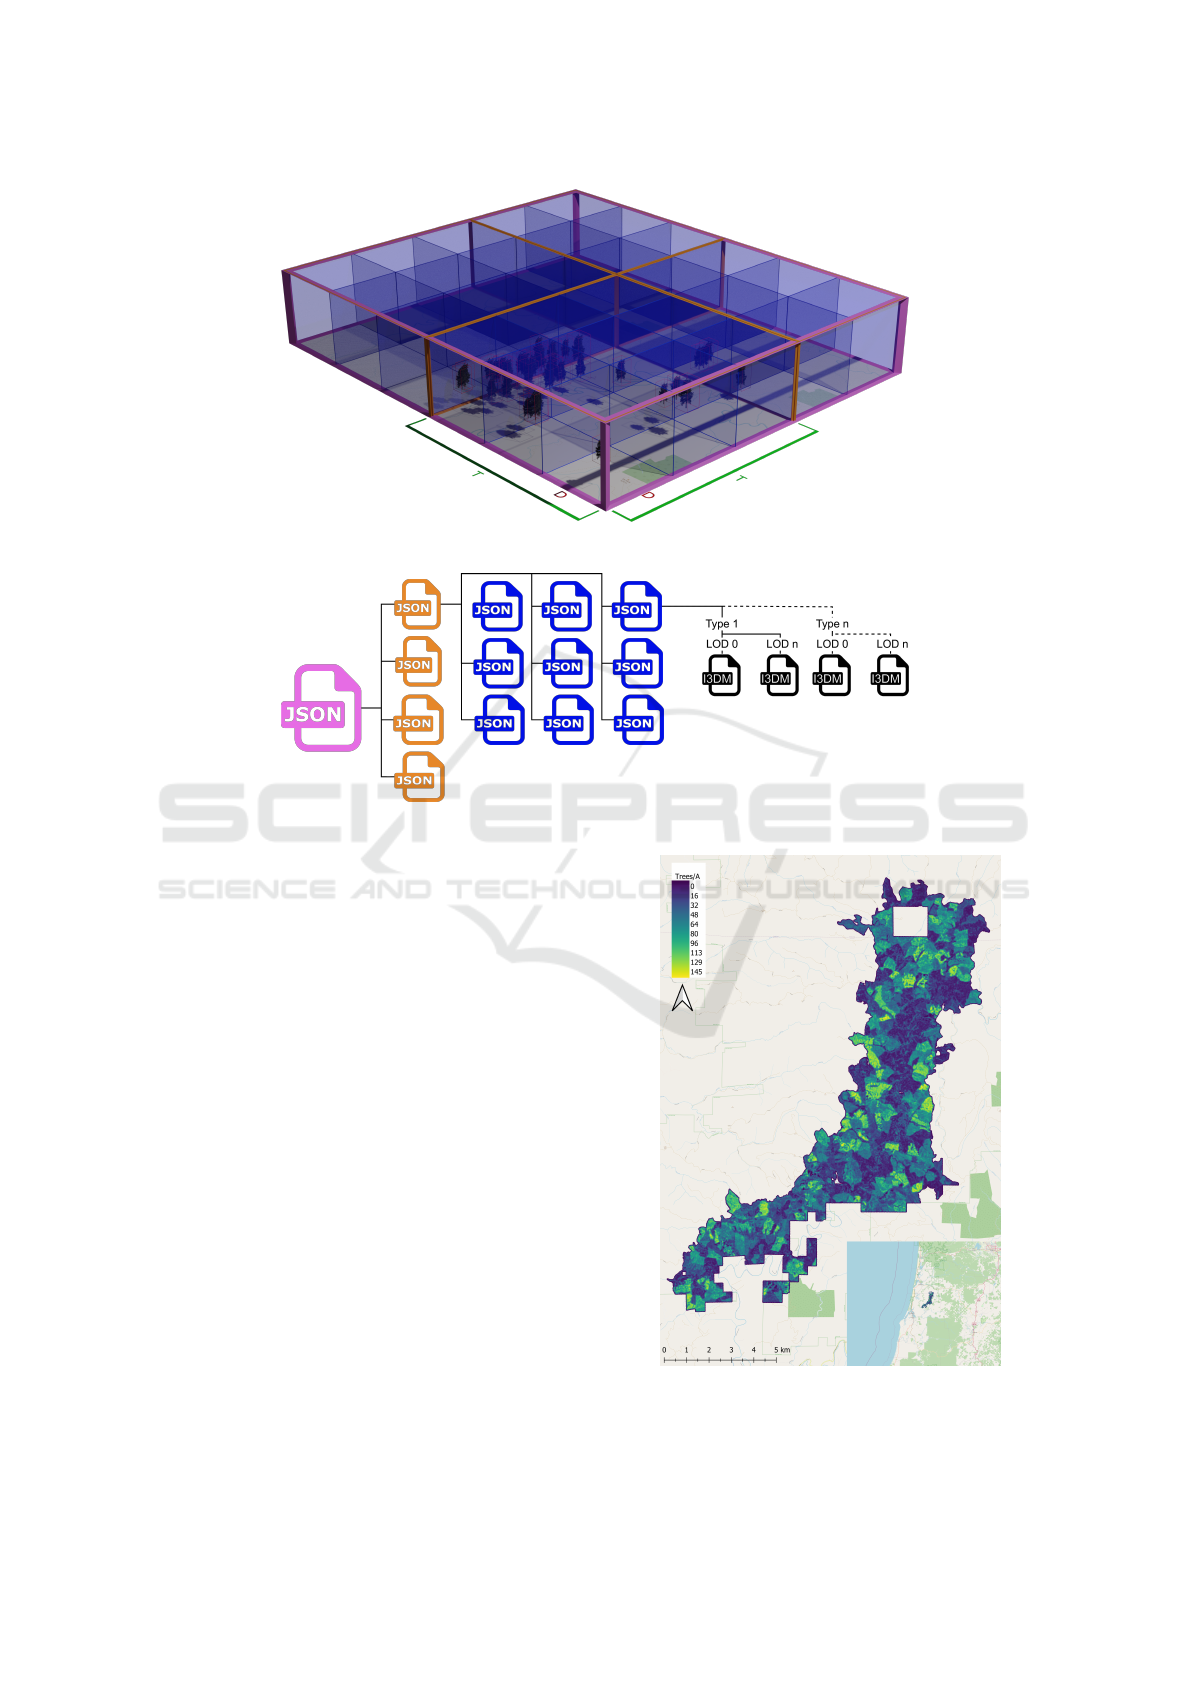
Figure 7: Visualization of the tile structure of a tileset with T = 3 and a total coverage of 5Dx6D, and a resulting L
max
= 2.
Figure 8: File Structure the tileset presented in figure 7.
dataset for contemporary forest visualizations. The
used dataset encompasses an area of 77.6km
2
in the
southwest Oregon Coastal Range and has an excess
of 2.835 million in individual trees at varying densi-
ties (see figure 9). The FID specifies the tree species
as Douglas Fir (2.66 ∗ 10
6
trees - 94.10%), West-
ern Hemlock (0.063 ∗ 10
6
trees - 2.25%), and other
species (0.103∗ 10
6
trees - 3.65%) without further di-
vision. Each tree in the dataset is linked with vari-
ous metadata. The dataset’s base data is in the CRS
Internet of Things (EPSG):6318 and lacks elevation
information.
4.2 Performance Benchmark
This section validates the proposed 3D Tiles genera-
tion procedure. Since for most use-cases, especially
for static datasets, a more performant visualization is
more relevant than a performant generation, the pre-
sented benchmarks focus more on assessing the per-
formance and efficiency of the visualization, less on
the generation.
To evaluate the performance of the visualization,
we consider two metrics.
• Duration from the initial rendering of a scene until
Figure 9: Coverage and density of the Elliot State Research
Forest FID.
GRAPP 2025 - 20th International Conference on Computer Graphics Theory and Applications
244

all currently features are loaded.
• The performance when updating the currently
visible content (measured in Frames per Second
(FPS)
The importance of these metrics can vary based on
the application’s use case. For static visualization, the
first metric takes precedence over FPS.
The efficiency of a 3D Tileset is significantly in-
fluenced by the size of its components. Smaller
files result in more efficient storage usage, reduced
transmission time and less required bandwidth when
streaming data from the server to the end user.
Several performance tests cover the influence of
environmental factors in combination with parameters
of the 3D Tileset generators. To ensure consistent and
precise test conditions, some preliminary tests utilize
a generated test FID, offering flexibility and the abil-
ity to produce reproducible results under well-defined
conditions.
The tests were performed on a computer with an
Intel Core i9-10900K processor, 64 GB of RAM,
Nvidia GeForce RTX 3090 graphics card, and a WD
Black PCIe SSD for storage. The tilesets are served
using Apache. All tests were executed in the Google
Chrome browser (version 114.0). The 3D Tileset is
visualized using CesiumJS (version 1.96.0).
These tests will compare three 3D Tileset genera-
tors (Cesium Ion, i3dm.export, and our proposed pro-
cedure) using five benchmarks that evaluate the fol-
lowing metrics:
1. File Size: The complete 3D Tileset is stored in
a single folder without any additional files. The
size of the folder is retrieved and evaluated using
d
s
f
c
, where the size of the total 3D Tileset (d
s
) is in
kB, and f
c
denotes the number of point features in
the tileset.
2. Static Performance: The camera is positioned
at an offset of 2500m to the earth’s surface. We
employ the CesiumJS event allTilesLoaded to de-
termine the duration t) from the initial request to
load the dataset until all visible features have been
loaded. This process is repeated four times. We
calculate the loaded triangles per second using the
equation
f
v
∗m
t
. f
v
is the number of visible features,
and m is the number of triangles in the used 3D
model. We compute the average value as the geo-
metric mean of the last three runs. The first run is
a warm-up primarily intended to populate caches.
3. Dynamic Performance: We establish a circular
flight path of the camera through the scene and
record the average FPS each second. The flight
spans 360 seconds to complete and traverses ter-
rain with varying feature densities and varying
distances of the features to the camera.
5 PERFORMANCE
BENCHMARKS
To gain insights into our proposed solution’s poten-
tial, limitations, and real-world implications, we de-
vised five benchmarks that cover all parameters of
the proposed methods and evaluates and compares the
performance of the different methods with each other.
The first four test are mainly intended for finding op-
timal parameters for the different methods, while the
last test (Benchmark 5) combines all findings into a
dynamic test. The section is concluded by a summa-
rization of the finding, highlight its possible enhance-
ments, and discuss how it can impact future develop-
ments in 3D tiling.
Figures representing the benchmark of rendering
performance include error bars. These error bars are
the result of the 3 outlined runs. The upper and lower
is the minimum and maximum value encountered dur-
ing the 3 runs.
5.1 Performance Benchmark 1
This test examines how an increase of f
c
affects the
file size and static performance when using the differ-
ent generators. The results of this test can be found in
figure 10.
5.1.1 Description
The area of the test dataset covers 4km
2
. Within this
area, we increment f
c
from 100 to 1 million elements,
all with the same feature type. Each tileset and each
LOD utilize the same glTF tree model. Since only our
procedure supports the generation of tilesets with dis-
crete LOD, all other file formats only have 1 LOD.
The dataset includes non-uniform scaling based on
predefined random height and canopy area. As Ce-
sium Ion was incapable of tiling a 3D Tileset with 10
6
features, this corresponding 3D Tileset is displayed
with a reduced f
c
of 8 × 10
5
.
5.1.2 Result
When examining the file size, our proposed 3D
tiling procedure slightly exceeds both Cesium Ion
and i3dm.export when working with a low number
of features. However, when the number of features
increases, our procedure exhibits a reduced mem-
ory footprint per feature, performing on par with the
Efficient Tiling of Point Features to 3D Tiles with Discrete LOD
245
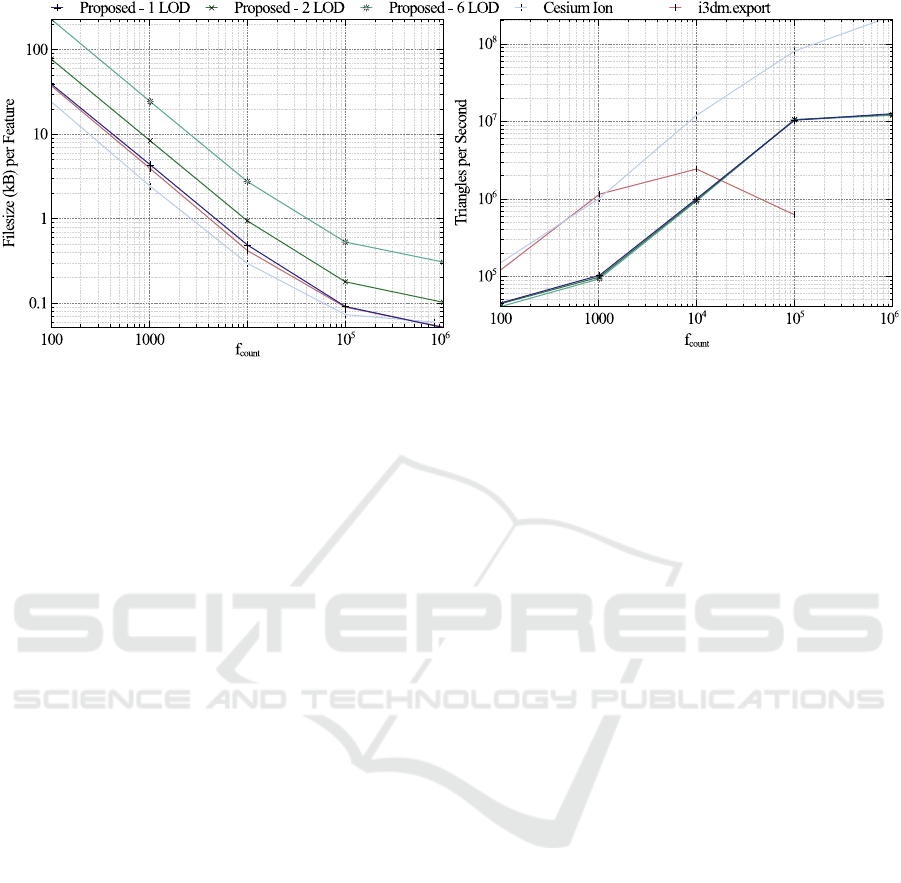
Figure 10: Performance Benchmark 1: The relation between f
c
and file size & static performance.
i3dm.export tool and slightly outperforming Cesium
Ion.
The rate at which triangles are drawn per sec-
ond varies considerably between the methods used.
Again, both Cesium Ion and the i3dm.export tool per-
form better at a low feature count, but for higher fea-
ture counts, the performance of the proposed method
exceeds i3dm.export’s performance. Furthermore,
it is worth mentioning that when the feature count
reached 10
6
, both Cesium Ion and the i3dm.export
tool encountered difficulties. Cesium Ion failed to
generate a 3D Tileset, and the i3dm.export tool could
not display the 3D Tileset in its entirety.
Upon analyzing the tile structure and the tileset
loading pattern, two primary factors likely contribute
to the lower performance of our procedure with a low
feature count value. Firstly, tilesets created by Ce-
sium Ion and i3dm.export are divided into far fewer
subsections than those produced by our procedure. As
a result, each I3DM tile encompasses a larger area and
includes a larher number of features. This leads to
fewer, less time-intensive model geometry loads from
memory to the GPU. This condition provides a perfor-
mance advantage, confirmed in Performance Bench-
mark 3. Secondly, our tiling procedure provides a
unique feature that allows each 3D model correspond-
ing to each feature to undergo specific 3D transforma-
tions, such as rotation and scaling. While this feature
might impose a slight performance impact, this versa-
tility allows for a more tailored representation of fea-
tures within the geospatial data, enhancing precision
and effectiveness in visualizations.
As this test suggested that the number of features
in each tile (D for the proposed procedure and f
max
for i3dm.export) has a massive influence on the per-
formance, the following two benchmarks are used to
evaluate the optimal settings for the proposed proce-
dure and i3dm.export. As Cesium Ion has no options
for adjusting the tiling procedure, there is no potential
optimization.
5.2 Performance Benchmark 2
5.2.1 Description
To measure the influence of D on the static perfor-
mance and file size, we employ two datasets, one
with f
c
= 10
5
and another with f
c
= 10
6
, each with
2 LODs.
For the tileset generated by our proposed proce-
dure, we initiate with D = 50m and increment to
the maximum possible D in the test dataset, which
is D = 2000m. Similarly, the dataset generated by
i3dm.export uses a varying f
max
ranging from 1000
to 2.5 × 10
6
.
5.2.2 Results
The results of this test, displayed in Figure 11, re-
veal a significant performance enhancement with the
increase in tile dimension (D) or the number of fea-
tures per tile ( f
max
). Specifically, we recorded an
average performance increase of over 600% across
all evaluated values for D. The static performance
of i3dm.export stays underneath that of the proposed
procedure for any tested value. An increase in D/ f
max
also had a positive, albeit negligible, impact on the
file size.
A comprehensive assessment shows that D =
750 (resulting in each tile at L = 0 measuring
750m x 750m) delivers optimal performance, contin-
gent on the total number of features. This configu-
ration minimizes loading time and ensures stability,
leading to consistent outcomes. Therefore, we have
GRAPP 2025 - 20th International Conference on Computer Graphics Theory and Applications
246
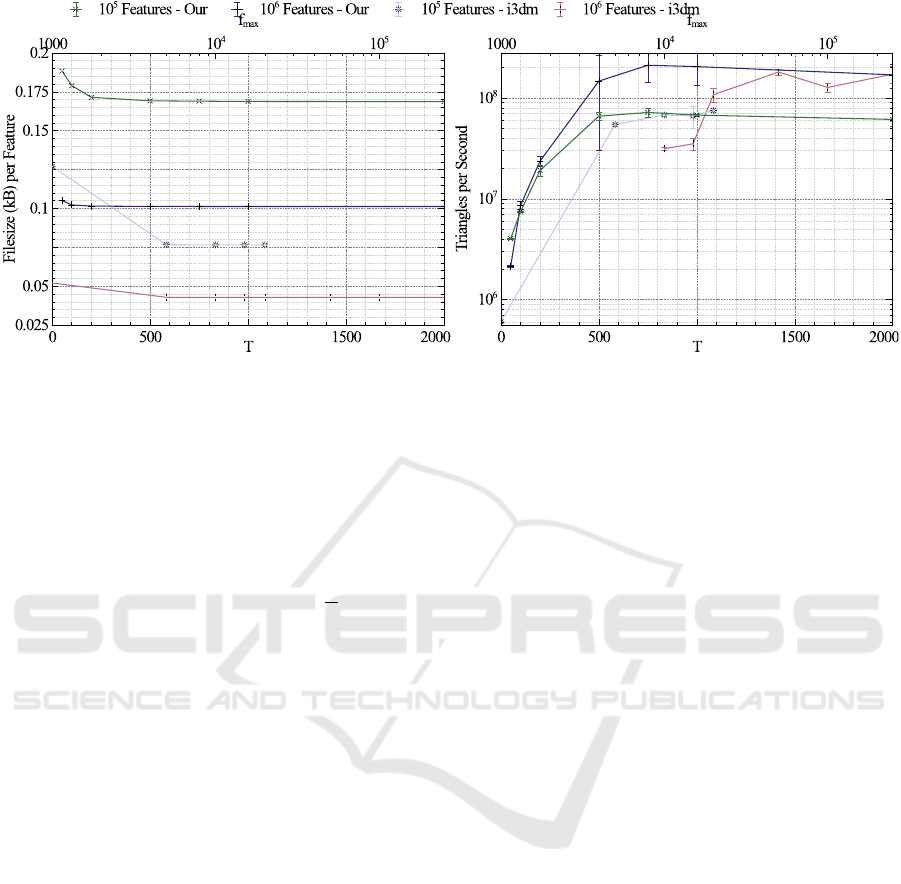
Figure 11: Performance Benchmark 2: The relation between D/ f
max
and the file size & performance.
decided to adopt D = 750 for future tests and eval-
uations. For f
max
, the optimum value depends on
f
c
. The highest static performance was achieved with
f
max
= 50000 in the test scenario. This value is used
for future tests with i3dm.export and large f
c
exceed-
ing 10
5
features. For datasets with 10
5
features, a
f
max
= 20000 is used.
The tiling approach of i3dm.export requires four
tiles in the lowest level, limiting f
max
to
f
c
4
. The visu-
alization was impossible for low f
max
and high f
c
.
5.3 Performance Benchmark 3
5.3.1 Description
This test explores the impact of T . Since only our
procedure requires this parameter (due to its distinct
tiling approach), we solely compare different values.
We increment T from the minimum value of 2 to 22.
At T = 22, there is only one tile at L = 0. D is set to
100 so more T values may be tested. This test uses a
test dataset with f
c
= 10
5
features.
5.3.2 Result
Figure 12 illustrates that the parameter T has a less
pronounced impact on performance than D. The per-
formance achieved demonstrates significant variabil-
ity, making it challenging to draw definitive conclu-
sions. However, based on average values, the best
performance was observed at T = 8, which resulted
in 64 children per tile.
5.4 Performance Benchmark 4
5.4.1 Description
Each scene can have a large number of different fea-
ture types, e.g. different tree species. To test the influ-
ence of the number of types on the performance, we
utilize a test dataset with D = 750, T = 8 (or equiv-
alent settings for datasets generated by other gener-
ators), and f
c
= 10
5
. In this test, we increment the
number of different feature types in the scene from 1
to 10. Each feature is randomly assigned to one of the
feature types. Only 1 LOD is used.
5.4.2 Results
Figure 13 shows that the file sizes generated by differ-
ent methods are broadly similar. The tileset created by
i3dm.export is marginally smaller than that generated
by our proposed procedure. Meanwhile, Cesium Ion,
which employs additional model optimization steps,
produces slightly different file sizes.
The static performance of Cesium Ion is notably
more erratic and generally lower than other methods.
Upon visual inspection of the loading behavior, this
is likely due to the over-segmentation of data into an
excessive number of tiles. On the other hand, the per-
formance of the i3dm.export tool and our proposed
procedure are closely matched. While for less than
7 feature types, i3dm.export performs slightly better,
exceeding 7 different features results in a slightly bet-
ter performance for the proposed method.
5.5 Performance Benchmark 5
This test evaluates the dynamic performance of each
generator.
Efficient Tiling of Point Features to 3D Tiles with Discrete LOD
247
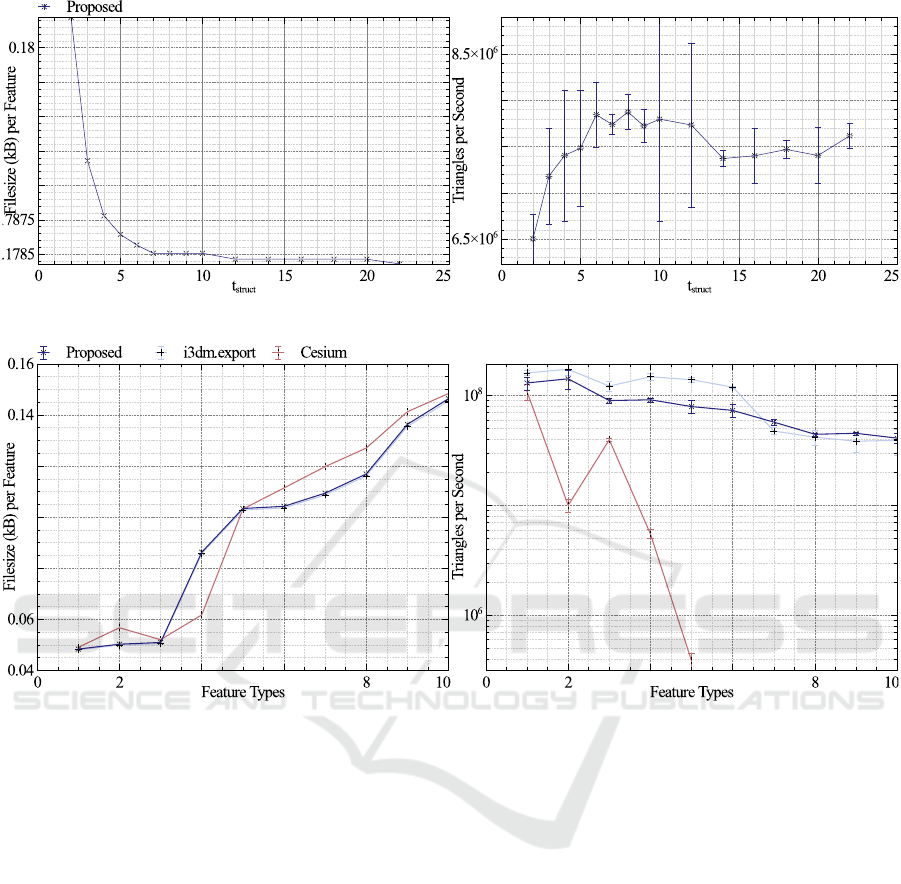
Figure 12: Performance Benchmark 3: The relation between T and the file size & performance.
Figure 13: Performance Benchmark 4: The relation between feature type count and the file size and performance.
5.5.1 Description
The optimal parameters determined during bench-
marks 1 through 4 are used to create a 3D Tileset with
3 different feature types (corresponding to the 3 tree
species found in the FID) and 2 LODs. The FID of
ESRF is used. As the i3dm.export tool does not sup-
port LODs, we use it to generate two 3D Tilesets (Low
and High) comprising models of LOD 1 and LOD 2
respectively. Cesium Ion was excluded, akin to pre-
vious tests, due to its inability to generate a complete
tileset of the entire FID.
5.5.2 Results
Notably, as visible in figure 14, our proposed proce-
dure delivered a considerable boost in performance,
achieving a geometric mean FPS of 48.70, outstrip-
ping i3dm.export’s results of 33.83 and 18.29 FPS.
Not only does the proposed method achieve a sig-
nificantly higher FPS, but it was also revealed that
the data loading process in dynamic scenes much
more stable. While it seems that i3dm.export’s tiles
achieve a higher FPS during time steps 130 − 160
and 225 − 275, the reason for this difference is that
i3dm.export’s tiles failed to load swiftly enough for
visualization, resulting in a blank scene and there-
fore seemingly higher performance. In contrast, our
procedure ensured quicker and more reliable loading
of the tileset in these areas. The only downside no-
ticed with our approach was a slight instability in FPS,
likely attributable to the usage of two different LODs.
The positive effect of the LODs is also visible in fig-
ure 14. During the time steps 90 − 110, 115 − 125,
140 − 160 and 230 − 260, the camera was far enough
from the trees so that the LOD switched to a lower
LOD, resulting in higher FPS.
5.6 Summary Performance
Benchmarks
All 3D Tileset generators tested exhibit high perfor-
mance and result in robust visualization for a limited
GRAPP 2025 - 20th International Conference on Computer Graphics Theory and Applications
248
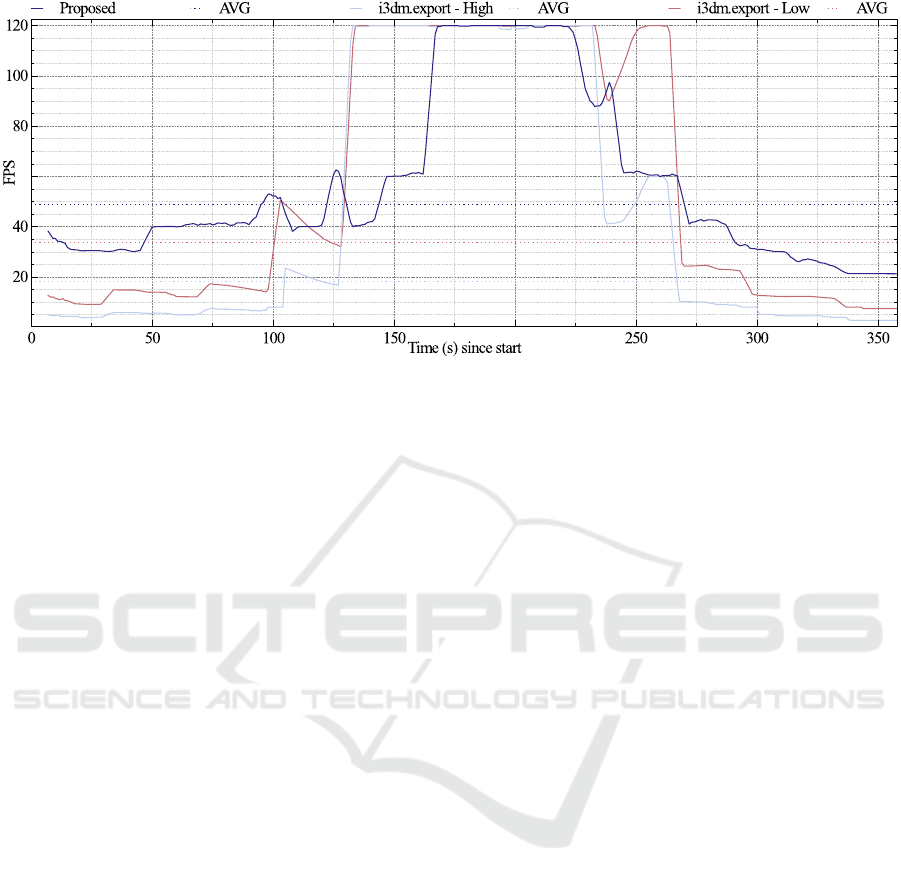
Figure 14: Performance Benchmark 5: The dynamic test.
number of features or those spread out extensively.
However, the two pre-existing generators we tested
demonstrated performance shortfalls when handling
datasets containing densely packed and clustered fea-
tures.
Our proposed procedure particularly excels in dy-
namic scenarios. While Cesium Ion failed to gen-
erate a complete tileset, i3dm.export managed the
tiling process but produced lower performance than
our procedure, even for tilesets containing only LOD-
0 models. Furthermore, the tileset created by our
procedure offered considerably more stable visualiza-
tion. On several occasions, the dataset generated by
i3dm.export failed to load tiles accurately. Although
manually adjusting the GE of the tileset improved
this, there were instances of missing tiles in the vi-
sualization.
Once the first 4 benchmarks established the
optional parameters for the proposed method and
i3dm.export, both generators exhibit an excellent stor-
age footprint. Similarly, both generators achieve a
high performance in regard to the loaded triangles per
second.
Despite initial indications from tilesets generated
by Cesium Ion and i3dm.export suggesting superior
performance to our procedure, Performance Bench-
mark 5 (as shown in Figure 14) conclusively demon-
strates that our approach achieves significantly higher
performance for outlined use cases: datasets compris-
ing multiple million features closely located to each
other.
While not explicitly tested against, the proposed
procedure can process datasets exceeding 10
7
point
features in less than 5 minutes. As such, it exceeds
the performance exhibited by Cesium Ion, especially
when considering the lengthy and error-prone prepa-
ration process, but is slightly behind the performance
of i3dm.export. This is likely caused by the substan-
tial employment of database-based feature point pro-
cessing over local processing.
6 CONCLUSION
This paper presents a new procedure for tiling point
features stored in different file formats to 3D Tiles
as specified in the OGC specifications. Compared to
other existing procedures, our procedure adds support
for LOD, does not require any intermediate formats,
and has excellent performance for highly dense fea-
tures and a large number of different feature types.
Due to its highly structured tiling approach, it is
possible to regenerate small areas of a dataset upon
changes in the base data compared to the complete
regeneration of the 3D Tileset.
Our procedure is perfectly qualified to visualize
large-scale datasets with millions of features. Due to
its capability to include models with different LODs,
it is possible to give the user a broad overview and
highly detailed visualization of complex geospatial
areas in their browser.
While it was shown that the procedure is already
exceeding the performance of generators, using the
most modern implementation of 3D Tiles, so-called
Composite (CMPT) tiles, could further improve the
performance while further reducing hardware require-
ments for the end user. CMPT files are capable of
combining separate I3DM tiles of different feature
types into a single file, resulting in faster retrieval
times and minimizing storage footprint.
Another potential improvement is automatically
recognizing changes in the dataset and the targeted re-
creation of the affected areas. At the moment, this has
Efficient Tiling of Point Features to 3D Tiles with Discrete LOD
249

to be done manually, which is not a straightforward
yet possible process. Lastly, to increase the usability
of the system, support for file formats besides Shape-
files and CSV files is desired. Geospatial data comes
in a wide array of potential formats, proprietary or
specified by the OGC. Adding this support can sig-
nificantly improve usability for various industries and
open the field up for more and better visualizations.
ACKNOWLEDGEMENT
This publication was prepared by Oregon State Uni-
versity using Federal funds under award #07-79-
07914 from the Economic Development Administra-
tion, U.S. Department of Commerce. The statements,
findings, conclusions, and recommendations are those
of the authors and do not necessarily reflect the views
of the Economic Development Administration or the
U.S. Department of Commerce.
REFERENCES
Armstrong, M. P., Wang, S., and Zhang, Z. (2019). The
Internet of Things and fast data streams: prospects
for geospatial data science in emerging information
ecosystems. Cartography and Geographic Informa-
tion Science, 46(1):39–56.
Breunig, M., Bradley, P. E., Jahn, M., Kuper, P., Mazroob,
N., R
¨
osch, N., Al-Doori, M., Stefanakis, E., and Ja-
didi, M. (2020). Geospatial Data Management Re-
search: Progress and Future Directions. ISPRS Inter-
national Journal of Geo-Information, 9(2):20.
Chen, Y., Shooraj, E., Rajabifard, A., and Sabri, S. (2018).
From IFC to 3D Tiles: An Integrated Open-Source
Solution for Visualising BIMs on Cesium. ISPRS In-
ternational Journal of Geo-Information, 7(10):393.
Department of Forestry (2023). Elliott State Research For-
est: Forest Management Plan (Draft). Technical re-
port, Oregon State University, Corvallis, OR, USA.
Gan, L., Li, J., and Jing, N. (2017). Hybrid organization and
visualization of the DSM combined with 3D building
model. In 2017 2nd International Conference on Im-
age, Vision and Computing (ICIVC), pages 566–571,
Chengdu, China. IEEE.
Gune, A., De Amicis, R., Sim
˜
oes, B., Sanchez, C. A., and
Demirel, H. O. (2018). Graphically Hearing: Enhanc-
ing Understanding of Geospatial Data through an In-
tegrated Auditory and Visual Experience. IEEE Com-
puter Graphics and Applications, 38(4):18–26.
Kotsev, A., Minghini, M., Tomas, R., Cetl, V., and Lutz,
M. (2020). From spatial data infrastructures to data
Spaces - A technological perspective on the evolu-
tion of european SDIs. ISPRS International Journal
of Geo-Information, 9(3):19.
Lu, M., Wang, X., Liu, X., Chen, M., Bi, S., Zhang, Y., and
Lao, T. (2021). Web-based real-time visualization of
large-scale weather radar data using 3D tiles. Trans-
actions in GIS, 25(1):25–43.
Prandi, F., Panizzoni, G., Magliocchetti, D., Devigili, F.,
and De Amicis, R. (2015). WebGL virtual globe for
efficient forest production planning in mountainous
area. In Proceedings of the 20th International Confer-
ence on 3D Web Technology, Web3D ’15, pages 143–
151, New York, NY, USA. Association for Computing
Machinery.
Rundel, S. and De Amicis, R. (2023). Leveraging digital
twin and game-engine for traffic simulations and vi-
sualizations. Frontiers in Virtual Reality, 4:13.
Singh, R., Gehlot, A., Vaseem Akram, S., Kumar Thakur,
A., Buddhi, D., and Kumar Das, P. (2022). Forest 4.0:
Digitalization of forest using the Internet of Things
(IoT). Journal of King Saud University - Computer
and Information Sciences, 34(8, Part B):5587–5601.
Wang, X., Wang, J., and Zhang, Y. (2023). Research on 3D
Visualization of Real Scene in Subway Engineering
Based on 3D Model. Buildings, 13(9):2317. Num-
ber: 9 Publisher: Multidisciplinary Digital Publishing
Institute.
Zhan, W., Chen, Y., and Chen, J. (2021). 3D Tiles-Based
High-Efficiency Visualization Method for Complex
BIM Models on the Web. ISPRS International Jour-
nal of Geo-Information, 10(7):476.
GRAPP 2025 - 20th International Conference on Computer Graphics Theory and Applications
250
