
Pre-Trained Models and Fine-Tuning for Negotiation Strategies with
End-to-End Reinforcement Learning
Yuji Kobayashi and Katsuhide Fujita
Tokyo University of Agriculture and Technology, Tokyo, Japan
Keywords:
Automated Negotiation, Bilateral Negotiation, Negotiation Strategy, Reinforcement Learning, Pre-Trained
Model, Fine-Tuning.
Abstract:
In the field of automated negotiation, designing negotiation strategies handling any opponents is a key goal,
and end-to-end reinforcement learning methods have been proposed. However, existing methods learn for
each specific agent individually, which leads to the risk of overfitting to that agent, making it difficult to adapt
to different situations or strategy changes even with the same agent. In addition, there is the issue that re-
training is necessary from scratch when facing unknown opponents. To address these challenges, this study
proposes a method that applies pre-training and fine-tuning to the model by an end-to-end reinforcement learn-
ing framework. Through evaluations, we demonstrate that the pre-trained model exhibits high generalizability.
Furthermore, we show that fine-tuning the pre-trained model not only has the potential to further improve per-
formance but also to have the potential to obtain high performance for unknown agents.
1 INTRODUCTION
In recent years, in the field of multiagent systems,
technologies that enable multiple agents to collabo-
rate and reach consensus have attracted significant
attention. Each agent has different objectives and
interests, and because they act autonomously based
on their unique preferences, conflicts arise between
agents. In such situations, it is difficult to control
all agents integrally, and methods are required to de-
rive efficient and fair agreements. Therefore, auto-
mated negotiation, where individual agents negotiate
and adjust their interests autonomously to find opti-
mal solutions, has emerged as an effective solution.
Applications of automated negotiation include sys-
tems for managing airspace and optimizing delivery
routes for unmanned aerial vehicles and the opera-
tional management systems of companies involved in
supply chains(Ho et al., 2022)(Klein and Rodr
´
ıguez-
Aguilar, 2015). These systems enable coordination in
various real-life scenarios. Therefore, research into
automated negotiation is highly significant.
In the field of automated negotiation, research
on negotiation strategies has been particularly active.
Various methods have been proposed and discussed
in the annual Automated Negotiating Agents Compe-
tition (ANAC), where participants create automated
negotiating agents to win their individual utility and
social welfare (Baarslag et al., 2015). Recently, ne-
gotiation strategies based on reinforcement learning
(RL) have gained attention, particularly in bilateral
multi-issue negotiation, due to their generalization ca-
pabilities to adapt to various negotiation scenarios and
strategies (Razeghi et al., 2020; Bakker et al., 2019;
Takahashi et al., 2022; Higa et al., 2023; Shimizu
et al., 2023).
As an example of prior research using RL, a Bid-
based general-purpose end-to-end RL framework for
learning negotiation strategies was proposed (Taka-
hashi et al., 2022). In this study, an agent us-
ing RL obtained higher utility values than an agent
that did not use RL. By analyzing the agent’s be-
havior after learning, it was confirmed that effective
strategies were learned against negotiation opponents.
However, learning is conducted individually for each
agent; thus, there is a risk of overfitting that agent,
which makes it difficult to adapt to different situations
or changes in strategy even with the same agent. In
addition, there is the issue of having to retrain from
scratch when encountering unknown opponents.
In this study, to address these challenges, we pro-
pose a pre-training and fine-tuning approach using
end-to-end RL to improve generalizability and reduce
the cost of retraining even though unknown oppo-
nents. The pre-trained model is based on an end-
to-end RL framework and is trained by changing op-
400
Kobayashi, Y. and Fujita, K.
Pre-Trained Models and Fine-Tuning for Negotiation Strategies with End-to-End Reinforcement Learning.
DOI: 10.5220/0013161500003890
In Proceedings of the 17th International Conference on Agents and Artificial Intelligence (ICAART 2025) - Volume 1, pages 400-411
ISBN: 978-989-758-737-5; ISSN: 2184-433X
Copyright © 2025 by Paper published under CC license (CC BY-NC-ND 4.0)

ponents randomly to learn general negotiation strate-
gies that can be adapted to various strategies. This
allows agents to negotiate effectively in various sit-
uations without being overly dependent on specific
opponents. Subsequently, fine-tuning is applied to
the pre-trained model to optimize strategies against
specific opponents. The proposed approach allows
agents to leverage the general negotiation capabili-
ties obtained from pre-training while learning specific
strategies against particular opponents in a short pe-
riod.
Through simulation experiments, we demonstrate
that the proposed pre-training and fine-tuning ap-
proach makes the following three contributions:
• The pre-trained model exhibits high generalizabil-
ity.
• Fine-tuning has the potential to further improve
performance.
• Fine-tuning has the potential to obtain high per-
formance for unknown opponents.
The remainder of this paper is organized as fol-
lows. Section 2 provides an overview of related re-
search, and Section 3 explains the negotiation rules
in detail. In Section 4, we present the proposed ap-
proach that applies pre-trained models and fine-tuning
to an end-to-end RL framework. Section 5 describes
the experimental settings used to evaluate the pro-
posed method. Section 6 evaluates the generalizabil-
ity of the pre-trained model, and Section 7 evaluates
the performance improvement obtained through fine-
tuning. Section 8 analyzes the effectiveness of fine-
tuning against unknown agents. Finally, Section 9
presents the conclusions and future challenges.
2 RELATED WORK
Automated Negotiating Agents Competition
(ANAC) The ANAC has been held annually since
2010 (Baarslag et al., 2015). In this competition,
participants create automated negotiating agents that
compete for individual utility and social welfare. Au-
tomated negotiating agents negotiate under various
rules, negotiation protocols, and scenarios set by the
competition, contributing to the development of new
negotiation strategies and the evaluation of strategies
by sharing the strategies of agents developed in the
competition.
We use the agents that won the ANAC competition
in this study.
Automated Negotiation Strategies Using Rein-
forcement Learning. In recent years, negotiation
strategies based on RL have attracted significant at-
tention in bilateral multi-issue negotiation problems
due to their versatility in adapting to various nego-
tiation scenarios and strategies. Based on the BOA
framework (Baarslag et al., 2014), the RLBOA frame-
work (Bakker et al., 2019) was proposed, which ap-
plies RL to individual decomposed negotiation strate-
gies. To demonstrate the effectiveness of this frame-
work, experiments were conducted using Q-learning
to evaluate the proposed strategy. In addition, an
approach that applies the deep Q-network to the ac-
ceptance strategy was also proposed (Razeghi et al.,
2020). However, these approaches limit the applica-
tion of RL to specific parts of the strategy, which can
create bottlenecks in other strategy elements.
To address this issue, the versatile negotiating
agent strategy (VeNAS) framework was proposed,
which enables the learning of an entire negotiation
strategy in an end-to-end manner, resulting in a more
comprehensive negotiation strategy (Takahashi et al.,
2022). VeNAS is formulated based on a Markov de-
cision process, receiving information such as offered
agreement candidates (Bid) as the state and outputting
actions such as accepting the opponent’s proposal or
proposing the next agreement if the offer is not ac-
cepted. Although the network structure of VeNAS is
based on deep Q-learning, it can also be adapted to
other RL methods, such as policy gradient methods.
The experimental results demonstrate that Ve-
NAS can achieve equal or higher utility than baseline
agents, including past ANAC champion agents. In ad-
dition, VeNAS outperformed agents that applied RL
to only parts of their strategies when negotiating with
agents employing time- or behavior-dependent strate-
gies, which confirmed its usefulness. Furthermore, by
analyzing the behavior of the agent after learning, it
was revealed that VeNAS could learn effective strate-
gies against negotiation opponents.
These existing studies have two remaining weak-
nesses. First, learning is performed individually for
each specific agent; thus, there is a risk of model
overfitting to that agent, which makes it difficult to
adapt to different situations and dynamic strategy
changes even with the same agent. Second, when fac-
ing unknown opponents, the agent must retrain from
scratch. In this study, we propose an approach that
applies a pre-trained model and fine-tuning to VeNAS
to improve generalizability and reduce the cost of re-
training for unknown opponents.
Pre-Trained Model and Fine-Tuning. A pre-
trained model is a model already trained on a large
dataset. The purpose of pre-training is to learn gen-
eral patterns and features, and such models are typ-
Pre-Trained Models and Fine-Tuning for Negotiation Strategies with End-to-End Reinforcement Learning
401

ically used to initialize the weights and parameters
of neural networks with knowledge that is not task-
specific. pre-trained models possess excellent feature
extraction capabilities in various tasks such as im-
age recognition, natural language processing (NLP),
and speech recognition, which facilitate adaptation
to new tasks. Representative examples include bidi-
rectional encoder representations from Transformers
(BERT)(Devlin et al., 2019) in NLP and ResNet(He
et al., 2016) pre-trained on ImageNet in image recog-
nition. These models are powerful in understand-
ing contexts and capturing image features, and they
demonstrate excellent performance in various down-
stream tasks.
Fine-tuning refers to the process of adjusting the
internal state of a pre-trained model to specialize it
to a new task (Li and Hoiem, 2016). Fine-tuning
uses the parameters obtained from pre-training as ini-
tial values; thus, it is more efficient than training an
untrained model from scratch, thereby allowing for
faster convergence. In addition, even when the new
dataset is small, fine-tuning can achieve higher accu-
racy by utilizing the general features obtained from
pre-training. In many cases, to prevent overfitting,
some parameters of the layers are fixed and not up-
dated. This method enables the model to retain exist-
ing knowledge while optimizing it for new data.
The combination of pre-training and fine-tuning
is an important approach in many real-world appli-
cations. For example, in the field of NLP, fine-
tuning pre-trained models such as BERT and genera-
tive pre-trained transformer (Radford et al., 2018) has
achieved state-of-the-art performance in text classifi-
cation, question answering, and sentiment analysis.
In this study, we apply a combined approach of
pre-training and fine-tuning to the design of auto-
mated negotiation agents. Specifically, in the field
of RL-based automated negotiation, we leverage pre-
trained models to learn general strategies for various
negotiation strategies and then fine-tune these models
to efficiently learn optimal strategies for specific op-
ponents. This allows agents to quickly adapt to new
negotiation partners while maintaining high general-
izability in various negotiation environments.
3 NEGOTIATION
ENVIRONMENT
3.1 Bilateral Multi-Issue Negotiation
We assume a bilateral multi-issue negotiation as the
negotiation environment. In this environment, two
agents negotiate in a common negotiation domain.
The negotiation domain comprises a set of issues
I =
{
I
1
,I
2
,··· , I
n
}
, and for each issue, a set of options
is defined as V
i
=
n
v
i
1
,v
i
2
,· ·· , v
i
k
i
o
. Here, n represents
the number of issues, and k
i
represents the number of
options for issue I
i
.
During the negotiation, each agent proposes a Bid.
A Bid is made by selecting one option from each is-
sue, specifically represented as ω =
v
1
c
1
,v
2
c
2
,. .. ,v
n
c
n
,
where c
i
∈
{
1,2, .. ., k
i
}
. The set of all possible Bids
is denoted as Ω, which represents all agreement op-
tions in the negotiation. The total number of Bids in
the negotiation domain is referred to as the domain
size and is represented by |Ω|.
Each agent possesses utility information repre-
senting their preferences in the negotiation, which
remains private. The utility information comprises
weights w
i
for each issue I
i
and the evaluation val-
ues eval(·) of the options v
i
c
i
. The function U(·) that
computes the utility value of a Bid based on this infor-
mation is called the utility function and is expressed
in Eq. (1).
U(ω) =
n
∑
i=1
w
i
·
eval
v
i
c
i
max
c
i
eval
v
i
c
i
(1)
Here, the weights of the issues must satisfy
∑
n
i=1
w
i
=
1 and w
i
≥ 0, and the evaluation values must satisfy
eval
v
i
c
i
≥ 0. The utility value is also constrained to
U ∈ [0,1].
3.2 Alternating Offers Protocol
In this study, we use the alternating offers protocol
(Jr., 1950), which is widely used in bilateral negotia-
tions. In this protocol, agents take turns acting. Each
agent selects one of the following three actions:
• Accept: Accept the opponent’s most recent offer
and conclude the negotiation.
• Offer: Reject the opponent’s offer and offer a new
Bid.
• End Negotiation: End the negotiation without
reaching an agreement.
The negotiation is subject to a deadline based on,
either based on time or the number of rounds (the
number of actions taken by each agent). The condi-
tions for terminating the negotiation are as follows:
• One of the agents accepts a Bid.
• One of the agents selects End Negotiation.
• The deadline is reached without an agreement.
If a Bid is accepted, the utility value U(ω) of that
Bid becomes the agent’s score. If no agreement is
reached, the score is 0.
ICAART 2025 - 17th International Conference on Agents and Artificial Intelligence
402
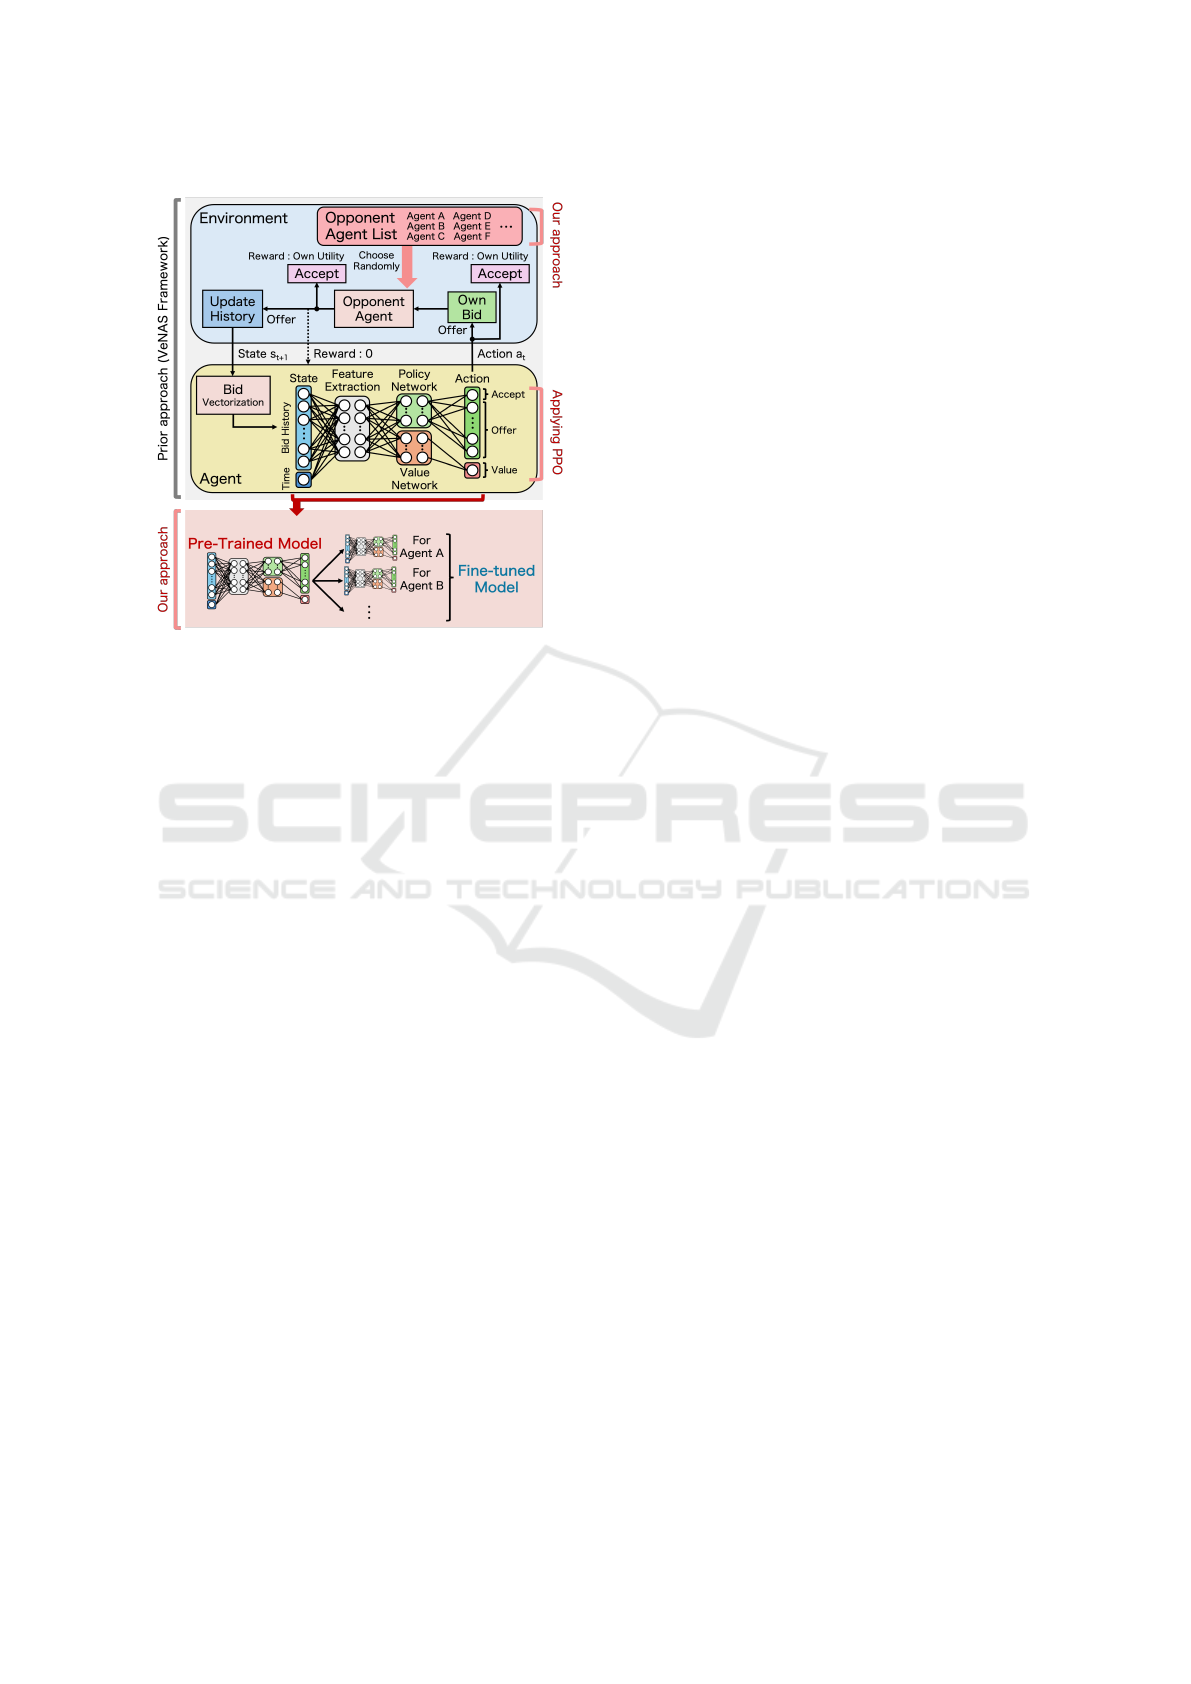
Figure 1: Overview of the proposed approach applying pre-
training and fine-tuning to VeNAS
4 PRE-TRAINING AND
FINE-TUNING APPROACH FOR
NEGOTIATION STRATEGIES
In this study, we propose an approach that applies pre-
training and fine-tuning to VeNAS, which is an end-
to-end RL framework introduced in Section 2. An
overview of the proposed approach is shown in Fig. 1.
The proposed approach is based on VeNAS; thus,
we first explain the learning process of VeNAS. The
RL agent receives the history of the proposed Bids
and the current time as the state and outputs an action
of either accepting the opponent’s offer or making the
next offer if not accepted. If the agent accepts the of-
fer, it receives the obtained utility as a reward; if it
makes the next offer without accepting it, the fixed
opponent selects the next action. If the opponent ac-
cepts the offer, the RL agent receives the obtained
utility as a reward; if the opponent makes the next
offer without accepting it, the agent receives a reward
of 0. After updating the negotiation history, the RL
agent again takes the next action. In addition, if ne-
gotiations fail and no agreement is reached, the RL
agent receives a reward of K as a penalty, reflecting
the negative impact of the negotiation outcome. The
negotiation is repeated in this manner, and learning
progresses.
However, in previous research, learning was per-
formed individually for specific agents. An illustra-
tive diagram of this is shown in Fig. 2a. Conse-
quently, there is a risk of model overfitting to those
agents, which makes it difficult to adapt to different
situations or changes in strategy even with the same
agent. In addition, there is the problem of having
to start learning from scratch when encountering un-
known opponents. Therefore, in this study, we pro-
pose an approach in which, at each step, the opponent
is randomly selected from multiple preprepared op-
ponents. The proposed approach allows the agent to
learn the characteristics of various opponents, which
is expected to improve generalizability and reduce
the risk of overfitting. The model learned using the
proposed approach will be used as the “pre-trained
model.” An illustrative diagram of the learning pro-
cess of this model is shown in Fig. 2b.
In addition, the network employs proximal policy
optimization (PPO) (Schulman et al., 2017), as ap-
plied to VeNAS. PPO is a policy gradient method in
RL that is designed to ensure simple implementation
and updates with an appropriate step size. The sur-
rogate objective function is used to set an appropri-
ate step size, and by clipping the ratio of the policy
before and after the update between 1 − ε and 1 + ε,
the update step size is controlled. This method im-
proves learning stability and exhibits high general-
izability even in environments with complex interac-
tions. Therefore, because it can achieve stable learn-
ing and high generalizability in negotiation environ-
ments with complex action spaces, we adopt PPO as
the network in this study.
After creating the pre-trained model, we fine-tune
it to specialize it for each opponent. Specifically, sim-
ilar to VeNAS, learning is performed by fixing the
number of opponents to 1, and the pre-trained model
is fine-tuned with a small number of steps. An il-
lustrative diagram of the learning process of the pre-
trained model is shown in Fig. 2c. This method allows
for the efficient construction of models specialized for
each opponent, thereby improving the performance of
the pre-trained model while reducing the cost of re-
training for unknown opponents. In addition, there is
the potential for high adaptability to unknown oppo-
nents.
5 EVALUATION SETTINGS
5.1 Negotiation Environment Settings
We assume a bilateral multi-issue negotiation, and ne-
gotiations are performed based on the AOP. The ne-
gotiation deadline is set to 40 rounds, and the negoti-
ation ends when each agent has taken 40 actions. The
learning agent takes the first turn, and the opponent
takes the second turn.
Pre-Trained Models and Fine-Tuning for Negotiation Strategies with End-to-End Reinforcement Learning
403
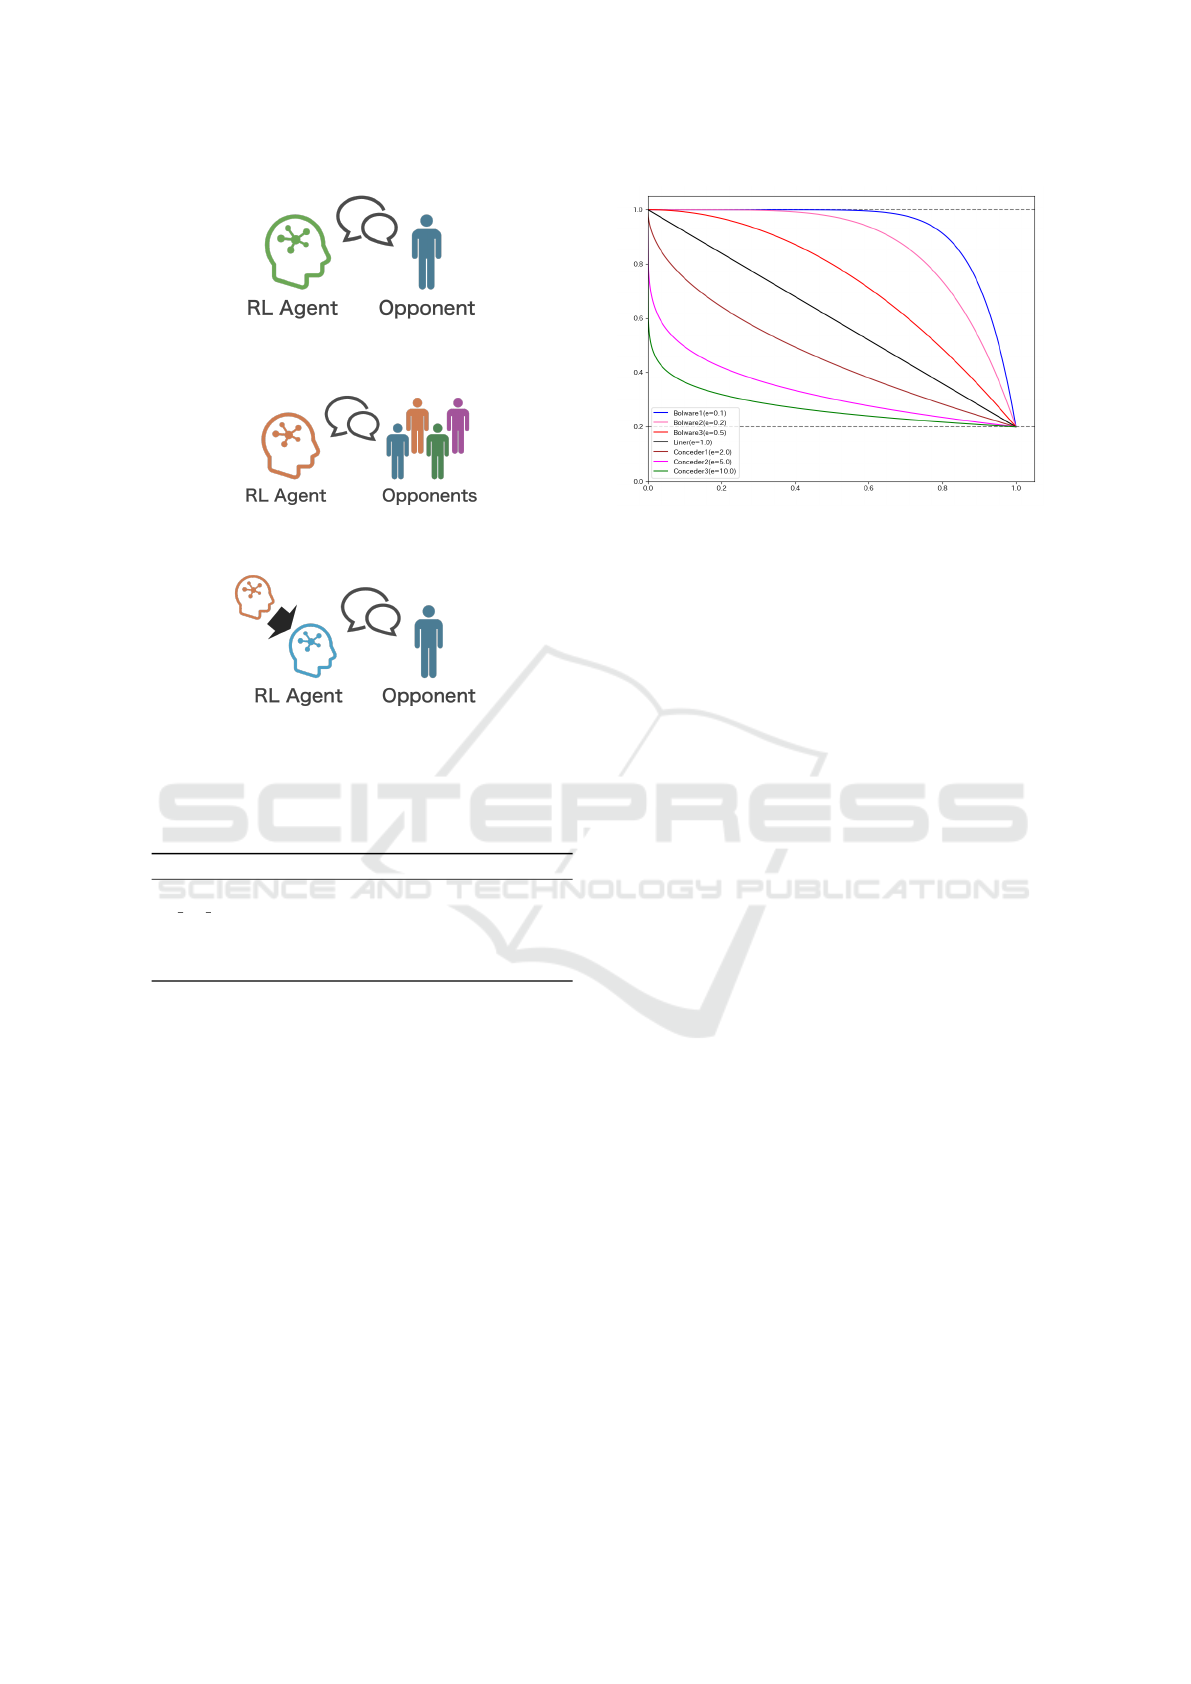
(a) Illustrative diagram of the learning method of RL agents
in previous research.
(b) Illustrative diagram of the learning method of RL agents
when training a “Pre-trained Model”
(c) Illustrative diagram of the learning method of RL agents
when training a “Fine-tuned Model”
Figure 2: Illustrative diagram of the learning methods for
three models.
Table 1: Negotiation Domains Used in the Evaluations.
Domain Name Domain Size Conflict Level
Laptop 27 (Small) 0.178 (Low)
IS BT Acquisition 384 (Medium) 0.124 (Low)
ItexvsCypress 180 (Medium) 0.433 (High)
Grocery 1,600 (Large) 0.197 (Low)
thompson 3,125 (Large) 0.325 (High)
Negotiation Domains
To perform evaluations in various negotiation do-
mains, we adopted five negotiation domains provided
by GENIUS (Lin et al., 2014). The negotiation do-
mains used were selected based on two aspects: do-
main size and the level of conflict. The details are
shown in Table 1. Here, the domain size listed in Ta-
ble 1 refers to the total number of all possible Bids.
In addition, the level of conflict is defined by the
Euclidean distance between the Kalai–Smorodinsky
solution(Kalai et al., 1975) in the utility space and
the ideal solution (1,1), representing the difficulty in
reaching mutually beneficial agreements. The higher
the level of conflict, the more difficult it becomes to
reach agreements that benefit both agents.
Figure 3: Concession curves for seven different time-
dependent strategies used in the experiment.
Opponent Strategies
In this experiment, 13 types of agents were used as
negotiation opponents. The agents are broadly cate-
gorized into the following three groups:
• seven time-dependent agents (Boulware1, Boul-
ware2, Boulware3, Linear, Conceder1, Con-
ceder2, Conceder3)
• two behavior-dependent agents (TitForTat1, Tit-
ForTat2)
• four ANAC champion agents (AgentK, Hard-
Headed, Atlas3, AgentGG)
In the following, the strategies of each agent used in
the experiment are explained.
Time-dependent agents make concessions as the
negotiation approaches the deadline. The degree of
concession for these agents changes depending on the
value of the parameter e, which determines the speed
of concession. Agents with e < 1 are called Boulware,
those with e = 1 are called Linear, and those with e >
1 are called Conceder.
In this experiment, we use three Boulware agents,
one Linear agent, and three Conceder agents. The
three Boulware agents have e = 0.1,0.2,0.5, and are
named Boulware1, Boulware2, and Boulware3, re-
spectively. The three Conceder agents have e =
2.0,5.0, 10.0, and they are named Conceder1, Con-
ceder2, and Conceder3, respectively. The Linear
agent has e = 1. The concession curves of these seven
agents are shown in Fig. 3. Here, the horizontal axis
represents time, and the vertical axis represents the
utility value of the proposed bid.
Behavior-dependent agents use strategies that de-
pend on the actions of opponents and imitate them,
known as Tit-for-Tat. In this experiment, we used
strategies with the adjustment parameter γ, which
controls the speed of concession and the degree of re-
ICAART 2025 - 17th International Conference on Agents and Artificial Intelligence
404
sponse to the opponent. The strategies where γ = 1
and γ = 2 are referred to as TitForTat1 and TitForTat2,
respectively.
Among the ANAC champion agents, four agents
were selected from tournaments that had rules sim-
ilar to those of the current experimental setup.
AgentK(Kawaguchi et al., 2011) is the ANAC2010
champion agent, employing a time-dependent conces-
sion strategy and a utility estimation strategy based on
a Gaussian distribution. Its strategy is characterized
by making probabilistic decisions for both proposal
and acceptance strategies, leading to complex nego-
tiation behavior. HardHeaded(Krimpen et al., 2013)
is the ANAC2011 champion agent that uses a tough
strategy that does not concede until the final phase
approaches the deadline and a utility estimation strat-
egy based on a frequency model. Atlas3(Mori and Ito,
2017) is the ANAC2015 champion agent that uses a
proposal strategy based on a time-dependent conces-
sion function and a utility estimation strategy based
on a frequency model. This agent is characterized
by determining the appropriate lower bound of the
concession function using game theory. AgentGG is
the ANAC2019 champion agent that employs a time-
dependent concession strategy and a utility estimation
strategy based on a frequency model.
In this study, to ensure the reproducibility of the
experiments, no noise was introduced for the time-
and behavior-dependent agents.
5.2 Common Experimental Settings
Comparison
In this study, we compared the performance of three
models: baseline, pre-trained and fine-tuned models.
The baseline is a method proposed in previous re-
search, where a model is trained on a specific agent
using VeNAS. PPO is employed in the network, and
an illustration of this method is shown in Fig. 2a.
The pre-trained model, as described in Section 4, is
trained by randomly selecting opponents from multi-
ple agents using the PPO in the network. The fine-
tuned model uses the parameters of the pre-trained
model as its initial parameters and applies fine-tuning
to a specific agent.
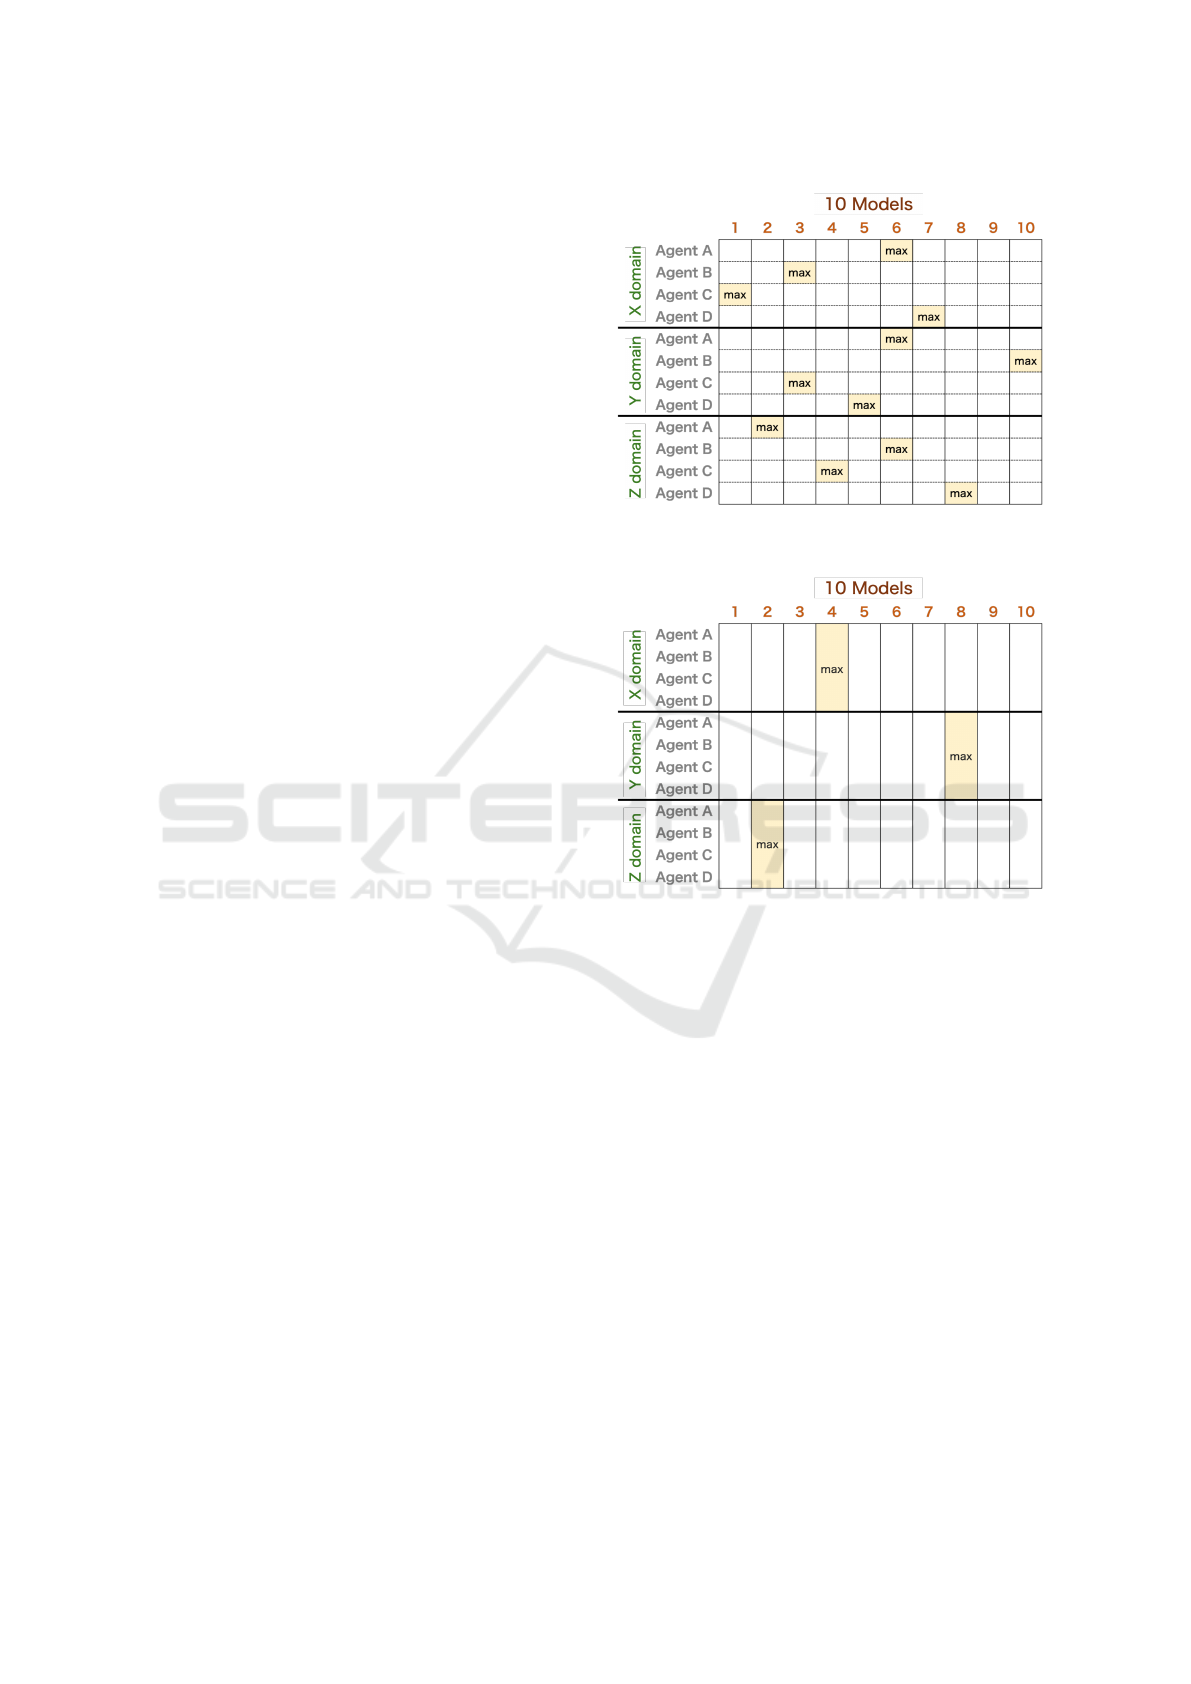
For all models, 10 models were created to reduce
bias. For the baseline and fine-tuned models, the
model with the highest individual utility value among
the 10 models is selected for each domain and oppo-
nent, and this value is considered the individual util-
ity. Fig. 4 shows a conceptual diagram of the best
model selection.
Figure 4: Method for selecting the best model in baseline
and fine-tuning.
Figure 5: Method for selecting the best model in pre-
training.
Conversely, for the pre-trained model, the average
utility is calculated for the 10 models in each domain,
and the model with the highest average utility is se-
lected. The utility value obtained from this model
is considered the individual utility of the pre-trained
model. Fig. 5 shows a conceptual diagram of this pro-
cess.
Evaluation Metrics
The utility obtained by the learning agent based on a
certain model is the average of the results from 100
negotiation simulations. This average is referred to
as “individual utility” and is used as a performance
evaluation metric. In addition, the average individual
utility across domains is used as a performance eval-
uation metric. Furthermore, for two models, the pro-
portion of agents that outperformed the other model in
each domain is referred to as the “win rate,” whereas,
for three models, the proportion of agents that ranked
first in each domain is referred to as the “top rate.”
Pre-Trained Models and Fine-Tuning for Negotiation Strategies with End-to-End Reinforcement Learning
405
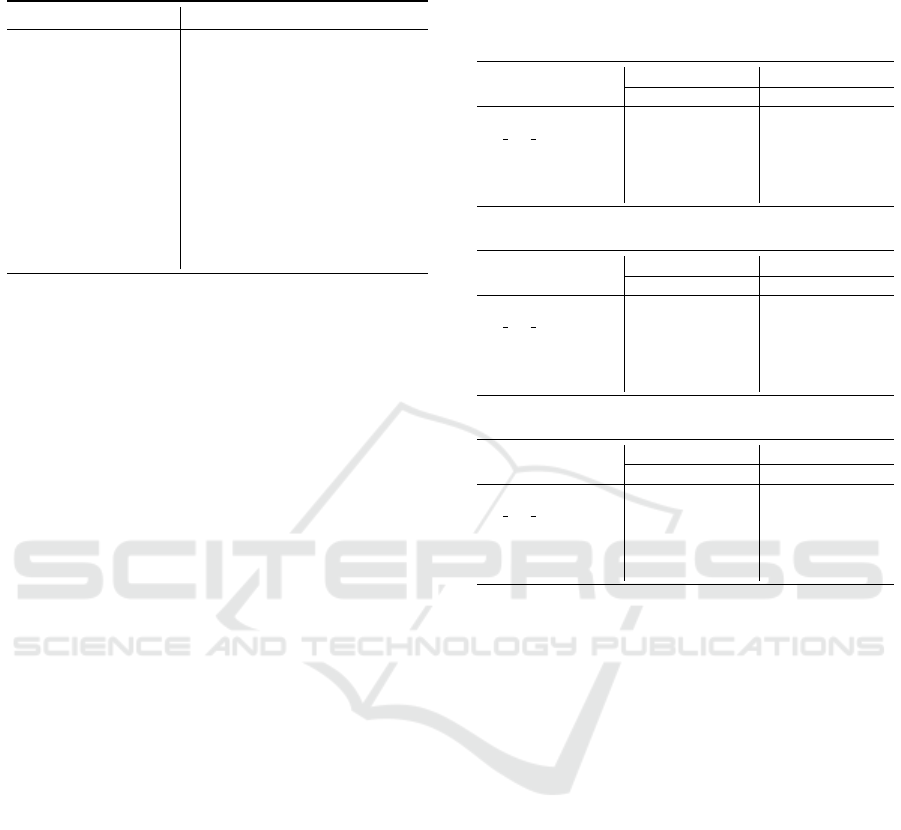
Table 2: Hyperparameters of the neural networks used in
the experiment.
Hyperparameter Value
Horizon (T) 2048
Optimizer Adam(Kingma and Ba, 2014)
Adam stepsize 3 × 10
−4
Num. epochs 10
Mini-batch size 64
Discount Rate 0.99
GAE parameter 0.95
Clipping parameter 0.2
Activation Function Tanh
Value Network [64, 64]
Policy Network [64, 64]
Learning Settings
The hyperparameters of the neural networks used in
this study are shown in Table 2. In addition, the
state in VeNAS includes the proposals from the previ-
ous two rounds and the current time, defined as s
t
=
{ω
t−1
,ω
′
t−1
,ω
t
,ω
′
t
,t/T }. In addition, the penalty K
for failed negotiations is set to −1.
The number of learning steps of the baseline was
set to 500,000 steps, that of the pre-trained model
was set to 500,000 steps multiplied by the number of
agents, and that of the fine-tuning model was set to
100,000 steps. After training, all models select ac-
tions deterministically.
6 EVALUATION OF
GENERALIZABILITY OF
PRE-TRAINED MODELS
6.1 Experimental Settings
To compare the performance of various pre-trained
models, the following three pre-trained models were
used, where the opponents for training differed:
• T7-(Pre): this model involves seven time-
dependent agents
A pre-trained model trained on the seven time-
dependent agents mentioned in the “Opponent
Strategies” subsection of Section 5.1.
• TB9-(Pre): this model involves nine time- and
behavior-dependent agents
A pre-trained model trained on the seven time-
dependent agents and two behavior-dependent
agents mentioned in the “Opponent Strategies”
subsection of Section 5.1.
Table 3: Comparison of pre-trained and baseline models.
The bold shows the highest scores among the comparative
approaches.
(a) Comparison of T7-(Pre) and baseline
Baseline-T7 T7-(Pre)
utility win rate utility win rate
Laptop 0.861 0% 1.000 57%
IS BT Acquisition 0.879 29% 0.874 14%
ItexvsCypress 0.776 29% 0.767 29%
Grocery 0.954 29% 0.960 14%
thompson 0.827 29% 0.825 43%
(b) Comparison between TB9-(Pre) and baseline
Baseline-TB9 TB9-(Pre)
utility win rate utility win rate
Laptop 0.892 0% 0.909 11%
IS BT Acquisition 0.893 44% 0.851 0%
ItexvsCypress 0.715 22% 0.757 78%
Grocery 0.964 0% 0.978 11%
thompson 0.844 67% 0.786 11%
(c) Comparison between TBA13-(Pre) and baseline
Baseline-TBA13 TBA13-(Pre)
utility win rate utility win rate
Laptop 0.853 0% 0.929 31%
IS BT Acquisition 0.880 54% 0.861 0%
ItexvsCypress 0.628 31% 0.678 62%
Grocery 0.880 31% 0.911 31%
thompson 0.712 46% 0.721 23%
• TBA13-(Pre): this model involves 13 time-
dependent, behavior-dependent, and ANAC
champion agents
A pre-trained model is trained on the seven
time-dependent agents, two behavior-dependent
agents, and four ANAC champion agents men-
tioned in the “Opponent Strategies” subsection of
Section 5.1.
In addition, the baselines corresponding to each
pre-trained model are referred to as Baseline-T7,
Baseline-TB9, and Baseline-TBA13, respectively.
These baselines are based on the agents used in the
pre-trained models. For example, Baseline-T7 repre-
sents the baseline for seven types of time-dependent
strategies, excluding ANAC and behavior-dependent
agents.
6.2 Experimental Results & Discussion
Table 3a, Table 3b, and Table 3c compare the per-
formance of the pre-trained models (T7-(Pre), TB9-
(Pre), and TBA13-(Pre)) with their respective base-
lines (Baseline-T7, Baseline-TB9, Baseline-TBA13).
Each table shows the average utility and win rate for
the models in each domain.
First, we discuss and analyze the results presented
ICAART 2025 - 17th International Conference on Agents and Artificial Intelligence
406

in Table 3a. In the Laptop domain, which has a small
domain size, the pre-trained model outperformed the
baseline in terms of both utility and win rate, in-
dicating superior performance. This is because the
small domain size allows the pre-trained model to ef-
ficiently capture data patterns and effectively demon-
strate its generalizability. In the IS BT domain, the
utility and win rate of the pre-trained model are lower
than those of the baseline. However, given that 54%
of the agents achieved the same utility, the pre-trained
model performed at a comparable level to the base-
line. In addition, although the pre-trained model
underperforms in terms of utility in the Itexvs and
thompson domains, its win rate is equal to or higher
than that of the baseline. In the Grocery domain, the
pre-trained model outperforms the baseline in terms
of utility, demonstrating performance on par with or
better than that of the baseline. In summary, the
pre-trained model, which is trained on seven time-
dependent strategies, exhibits comparable or superior
performance to the baseline across various domains,
indicating a high level of generalization ability.
Second, we discuss and analyze the results pre-
sented in Table 3b. In the Laptop domain, similar
to Table 3a, the pre-trained model outperforms the
baseline in terms of both utility and win rate. How-
ever, in the IS BT and thompson domains, the per-
formance is lower, whereas, in the Itexvs and Gro-
cery domains, the performance improves. Although
the performance varies by domain, overall, the pre-
trained model demonstrates equal or better perfor-
mance. Therefore, the pre-trained model, which also
includes behavior-dependent strategies, exhibits high
generalizability.
Finally, we discuss and analyze the results pre-
sented in Table 3c. The Laptop domain shows sim-
ilar results to Table 3a and Table 3b, with the pre-
trained model outperforming the baseline in terms
of both utility and win rate. Although the perfor-
mance in the IS BT domain is lower, in all other do-
mains, the pre-trained model outperforms the base-
line in terms of utility. The pre-trained model selects
the model with the highest average utility for each
domain; thus, having a higher utility in four of five
domains indicates that the pre-trained model outper-
forms the baseline. Therefore, the pre-trained model
trained on time-dependent, behavior-dependent, and
ANAC agents also demonstrates high generalizabil-
ity.
In addition, a comparative evaluation was per-
formed between the three models: T7-(Pre), TB9-
(Pre), and TBA13-(Pre). The evaluation criteria in-
cluded the average utility values obtained by each
model against the seven time-dependent agents in dif-
ferent domains. Furthermore, for each domain, the
top rate was defined as the percentage of times each
model achieved the highest utility among the four
models, including the baseline. Table 4 presents the
results of this comparison.
In Table 4, TBA13-(Pre) demonstrates the highest
utility and top rate in three domains with small do-
main sizes. The Grocery domain also exhibits gener-
ally high utility and top rate. However, in the thomp-
son domain, the utility and top rate of TB9-(Pre) and
TBA13-(Pre) are lower than those in the other do-
mains. This shows that a pre-trained model incorpo-
rating successful ANAC champion agents tends to ex-
hibit higher generalizability than other models. How-
ever, in more complex domains with large domain
sizes and higher conflict levels, a pre-trained model
specialized in time-dependent strategies performs bet-
ter.
7 EVALUATION ON
PERFORMANCE
IMPROVEMENT THROUGH
FINE-TUNING
7.1 Experimental Settings
To improve the learned negotiation strategy for the
specific individual agents, fine-tuning was performed
using the pre-trained model as the initial parameters.
The model fine-tuned from the pre-trained T7-(Pre)
is referred to as T7-(FT); similarly, the models fine-
tuned from TB9-(Pre) and TBA13-(Pre) are referred
to as TB9-(FT) and TBA13-(FT), respectively.
7.2 Experimental Results & Discussion
Table 5, Table 6, and Table 7 compares the perfor-
mance of the fine-tuned models (T7-(FT), TB9-(FT),
TBA13-(FT)) with their respective baselines and pre-
trained models. Each table shows the average utility
and top rate for each domain. In addition, the “up-rate
(P→F)”, which represents the percentage of agents
that improved from the pre-trained model to the fine-
tuned model, is also calculated for each domain.
First, we discuss and analyze the results presented
in Table 5. The up-rate in three of five domains
was 0%, indicating no performance variation after
fine-tuning the pre-trained model. The pre-trained
model was already optimized, indicating that it ef-
fectively learned general patterns from multiple op-
ponents, resulting in high generalizability. However,
in the IS BT domain, 43% of the agents improved in
Pre-Trained Models and Fine-Tuning for Negotiation Strategies with End-to-End Reinforcement Learning
407
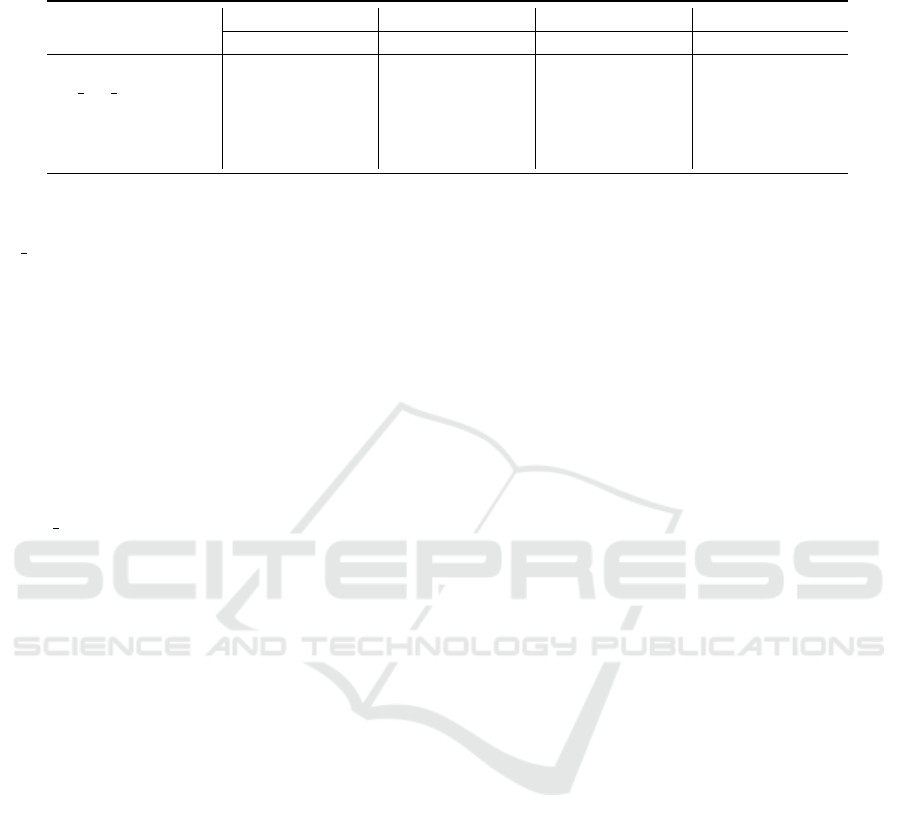
Table 4: Comparative evaluation among T7-(Pre), TB9-(Pre), and TBA13-(Pre). The text in bold indicates the highest scores
among the comparative approaches.
Baseline-7 T7-(Pre) TB9-(Pre) TBA13-(Pre)
utility top rate utility top rate utility top rate utility top rate
Laptop 0.861 43% 1.000 100% 0.882 57% 1.000 100%
IS BT Acquisition 0.879 86% 0.874 71% 0.866 57% 0.880 71%
ItexvsCypress 0.776 0% 0.767 0% 0.808 29% 0.824 71%
Grocery 0.954 86% 0.960 71% 0.971 100% 0.960 71%
thompson 0.827 57% 0.825 86% 0.787 0% 0.770 0%
performance due to fine-tuning, with both utility and
top rate increasing. As mentioned in Section 6, in the
IS BT domain, the pre-trained model exhibited lower
utility and win rate than the baseline, indicating that
improvement was still possible. This result shows that
even when the pre-trained model underperforms the
baseline, fine-tuning can improve its performance to
exceed that of the baseline.
Second, we discuss and analyze the results pre-
sented in Table 6. The up-rate in the Laptop do-
main was 0%, and for the other three domains, it
was 11%, indicating that few agents improved per-
formance through fine-tuning. However, the aver-
age utility is high in the three domains, excluding
the IS
BT and thompson domains, which is similar
to the insights from Table 6; therefore, the pre-trained
model exhibits high generalizability. In addition, a
noteworthy point is the change in the utility value of
the TitForTat1 agent in the Itexvs domain. The util-
ity value of the pre-trained model was 0.433, which
was significantly lower than that of the other agents;
however, it significantly improved to 0.904 after fine-
tuning. When a pre-trained model holds potential but
does not fully exhibit its performance, fine-tuning can
lead to significant performance improvements. Fur-
thermore, as seen in Table 3b, in the thompson do-
main, the utility and win rate of the pre-trained model
were lower than those of the baseline; however, after
fine-tuning, 33% of the agents exhibited performance
improvement. When the pre-trained model is not op-
timal, fine-tuning has a high potential to improve per-
formance.
Finally, we discuss and analyze the results pre-
sented in Table 7. The pre-trained model, which in-
corporates ANAC agents, demonstrates notable im-
provements compared to T7-(FT) and TB9-(FT),
because it achieves a higher up-rate across more
domains and exhibits increased utility in all do-
mains. This characteristic can be attributed to the en-
hanced generalizability resulting from learning across
a broader range of agents. By generalizing common
features more effectively, further improvements are
possible through fine-tuning. Consequently, when
the pre-trained model is not fully optimized, fine-
tuning can significantly enhance its performance, as
observed in this case. This highlights the effective-
ness of fine-tuning in improving the capabilities of a
model that has not been initially fully optimized.
8 EVALUATIONS ON
EFFECTIVENESS OF
FINE-TUNING FOR UNKNOWN
AGENTS
8.1 Experiment Settings
To evaluate the performance of unknown agents, this
study uses the following four fine-tuned models:
• T3-(FT-U·T)
A fine-tuned model based on the pre-trained
model (T3-(Pre)) that was trained with three
agents, namely, Boulware2, Linear, and Con-
ceder2, and then fine-tuned on four “unknown
agents,” namely, Boulware1, Boulware3, Con-
ceder1, and Conceder3.
• TBA11-(FT-U·T)
A fine-tuned model based on the pre-trained
model (TBA11-(Pre)), which was trained on
11 agents, excluding AgentK and HardHeaded,
which are two agents with lower baseline perfor-
mance, from the total of 13 agents mentioned in
the “Opponent Strategies” subsection of 5.1. This
model was fine-tuned on the two excluded “un-
known agents.”
• T7-(FT-U·A)
A fine-tuned model based on the pre-trained
model T7-(Pre), which was fine-tuned on four
“unknown ANAC agents” mentioned in the “Op-
ponent Strategies” subsection of 5.1.
• TB9-(FT-U·A)
A fine-tuned model based on the pre-trained
model TB9-(Pre), which was fine-tuned on four
“unknown ANAC agents” mentioned in the “Op-
ponent Strategies” subsection of 5.1.
ICAART 2025 - 17th International Conference on Agents and Artificial Intelligence
408
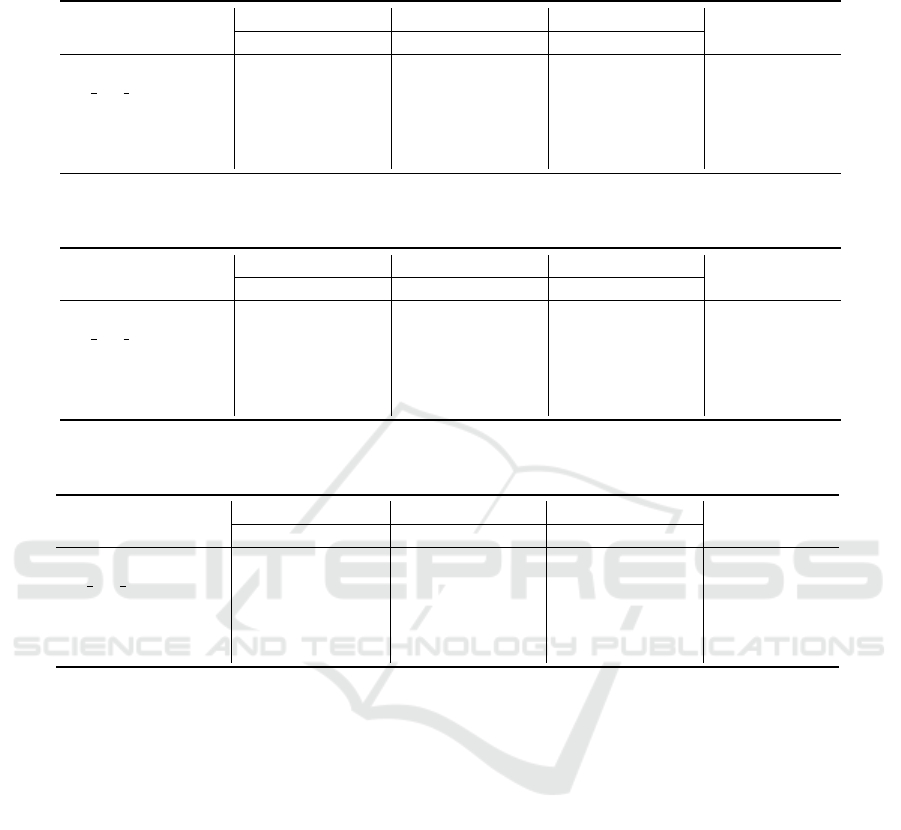
Table 5: Performance comparison between baseline, T7-(Pre), and T7-(FT). The text in bold represents the highest scores
among the comparative approaches.
Baseline-T7 T7-(Pre) T7-(FT)
up-rate(P→F)
utility top rate utility top rate utility top rate
Laptop 0.861 43% 1.000 100% 1.000 100% 0%
IS BT Acquisition 0.879 43% 0.874 43% 0.907 86% 43%
ItexvsCypress 0.776 71% 0.767 71% 0.767 71% 0%
Grocery 0.954 86% 0.960 71% 0.960 71% 0%
thompson 0.827 57% 0.825 71% 0.825 71% 14%
Table 6: Performance comparison between baseline, TB9-(Pre), and TB9-(FT). The text in bold represents the highest scores
among the comparative approaches.
Baseline-TB9 TB9-(Pre) TB9-(FT)
up-rate(P→F)
utility top rate utility top rate utility top rate
Laptop 0.892 89% 0.909 100% 0.909 100% 0%
IS BT Acquisition 0.893 89% 0.851 44% 0.858 56% 11%
ItexvsCypress 0.715 33% 0.757 67% 0.809 78% 11%
Grocery 0.964 78% 0.978 89% 0.982 100% 11%
thompson 0.844 89% 0.786 33% 0.801 33% 33%
Table 7: Performance comparison between baseline, TBA13-(Pre), and TBA13-(FT). The text in bold represents the highest
scores among the comparative approaches.
Baseline-TBA13 TBA13-(Pre) TBA13-(FT)
up-rate(P→F)
utility top rate utility top rate utility top rate
Laptop 0.853 46% 0.929 92% 0.962 92% 8%
IS BT Acquisition 0.880 77% 0.861 38% 0.864 54% 23%
ItexvsCypress 0.628 31% 0.678 46% 0.720 77% 38%
Grocery 0.880 69% 0.911 62% 0.915 54% 8%
thompson 0.712 77% 0.721 46% 0.725 33% 15%
In addition, the baselines corresponding to T3-
(FT-U·T) and TBA11-(FT-U·T) are referred to as
Baseline-T4, and the baselines corresponding to
T7-(FT-U·A) and TB9-(FT-U·A) are referred to as
Baseline-A2. These baselines are based on the agents
used in the pre-trained models.
8.2 Experimental Results & Discussion
Table 8a compares the performance of the fine-tuned
model T3-(FT-U·T) with the baseline (Baseline-T4).
The table shows the average utility and win rate for
each model in each domain.
In Table 8a, the utility shows that in four of
five domains, the baseline outperforms the fine-tuned
model for unknown agents. However, in terms of
win rate, the fine-tuned model outperforms the base-
line in three of five domains, with more than 50%
of the agents in all domains, excluding the thomp-
son domain, exhibiting performance on par with the
baseline. Therefore, although the fine-tuning of
pre-trained models on other time-dependent strate-
gies shows slightly inferior domain utility, it demon-
strates adaptability comparable to the performance of
the baseline, suggesting potential adaptability. This
adaptability implies benefits such as reduced initial
costs for developing pre-trained models and improved
generalization across more environments and situa-
tions.
Table 8b compares the performance of the fine-
tuned model TBA11-(FT-U·T) and the baseline model
(Baseline-A2). This table presents the average do-
main utility for both AgentK and HardHeaded.
As shown in Table 8b, for AgentK, both the base-
line and fine-tuned models exhibited equal or bet-
ter performance in the three domains. A similar re-
sult was observed for HardHeaded. The pre-trained
model, learned from time-dependent strategies,
behavior-dependent strategies, and ANAC agents, ex-
hibits baseline-equivalent performance against un-
known agents. In addition, in four of five domains,
excluding the Laptop domain, half of the agents out-
performed the baseline after fine-tuning, highlighting
the fact that some agents achieved performance equal
Pre-Trained Models and Fine-Tuning for Negotiation Strategies with End-to-End Reinforcement Learning
409
Table 8: Performance comparison between baseline and
fine-tuned models for unknown agents. The text in bold
represents the highest scores among the comparative ap-
proaches.
(a) Comparison between T3-(FT-UT) and baseline perfor-
mance
Baseline-T4 T3-(FT-U·T)
utility win rate utility win rate
Laptop 0.863 25% 0.826 0%
IS BT Acquisition 0.884 25% 0.854 25%
ItexvsCypress 0.786 50% 0.784 0%
Grocery 0.940 25% 0.960 25%
thompson 0.838 25% 0.828 75%
(b) Performance comparison between TBA11-(FT-U·A)
and baseline performance
Baseline-A2 TBA11-(FT-U·A)
AgentK HardHeaded AgentK HardHeaded
Laptop 0.726 0.726 0.726 0.726
IS BT Acquisition 0.873 0.850 0.763 0.873
ItexvsCypress 0.211 0.211 0.309 0.308
Grocery 0.630 0.630 0.385 0.000
thompson 0.294 0.290 0.447 0.000
to or better than that of the baseline. This result is at-
tributed to the high generalizability of the pre-trained
model.
Table 9 compares the performance of the fine-
tuned models T7-(FT-U·A) and TB9-(FT-U·A) and
the baseline model (Baseline-A4). The table shows
the average utility and top rate.
As shown in Table 9, the baseline model out-
performs the other models in terms of both utility
and top rate. For unknown ANAC champion agents
with highly complex strategies, models composed of
simpler time- and behavior-dependent strategies have
limitations.
Conversely, as shown in Table 8b, incorporating
ANAC agents into the pre-trained models confirms
that fine-tuning demonstrates adequate adaptability to
unknown and complex ANAC agents. Therefore, to
handle unknown complex strategies, it is necessary to
learn complex strategies such as ANAC agents during
the pre-training phase, which is expected to enhance
adaptability to unknown agents and improve general-
izability.
9 CONCLUSION AND FUTURE
WORK
In this study, we proposed an approach that applies
pre-training and fine-tuning to the end-to-end RL
framework VeNAS to address the issues identified in
previous research, such as overfitting specific agents
and the high cost of learning from scratch when en-
countering unknown opponents. By randomizing the
selection of opponents, we developed a pre-trained
model that captured the characteristics of diverse op-
ponents, and then, we fine-tuned this model for indi-
vidual agents. Through experiments evaluating met-
rics such as utility and win rate, we demonstrated the
following three points: First, the pre-trained model
exhibits high generalizability; second, fine-tuning has
the potential to further improve performance; third,
fine-tuning has the potential to obtain high perfor-
mance for unknown agents.
Although this study provides valuable insights
into RL-based automated negotiation strategies, three
key challenges remain for future work. First, in real-
world negotiations, fine-tuning must be performed in
real time. Addressing this challenge will require the
development of new methods that enable real-time
adaptation. Second, in the proposed approach, the
pre-trained model was selected based on the high-
est average utility across the domains. However,
exploring more sophisticated model selection meth-
ods could further expand the potential for perfor-
mance improvement through fine-tuning. The se-
lection of the optimal pre-trained model is expected
to contribute to further performance gains. Finally,
to develop a pre-trained model that can best adapt
to unknown agents, it will be necessary to care-
fully consider which agents should be included in the
training set. This will enable the construction of a
pre-trained model that maximizes adaptability to un-
known agents.
By addressing the results and challenges outlined
in this study, we expect to realize more advanced and
generalizable automated negotiation strategies.
Table 9: Performance comparsion between T7-(FT-U·A), TB9-(FT-U·A), and baseline. The text in bold represents the highest
scores among the comparative approaches.
Baseline-A4 T7-(FT-U·A) TB9-(FT-U·A)
utility top rate utility top rate utility top rate
Laptop 0.765 50% 0.547 50% 0.744 25%
IS BT Acquisition 0.851 75% 0.816 25% 0.788 0%
ItexvsCypress 0.432 100% 0.211 25% 0.263 25%
Grocery 0.691 50% 0.573 50% 0.571 0%
thompson 0.415 75% 0.184 25% 0.206 0%
ICAART 2025 - 17th International Conference on Agents and Artificial Intelligence
410

REFERENCES
Baarslag, T. et al. (2014). Decoupling negotiating agents to
explore the space of negotiation strategies. In Novel
Insights in Agent-based Complex Automated Negotia-
tion, pages 61–83. Springer.
Baarslag, T. et al. (2015). The automated negotiating agents
competition, 2010–2015. AI Magazine, 36(4):115–
118.
Bakker, J. et al. (2019). Rlboa: A modular reinforce-
ment learning framework for autonomous negotiating
agents. In Proceedings of the 18th International Con-
ference on Autonomous Agents and MultiAgent Sys-
tems (AAMAS2019), pages 260–268.
Devlin, J. et al. (2019). Bert: Pre-training of deep bidi-
rectional transformers for language understanding. In
Proceedings of the 2019 Conference of the North
American Chapter of the Association for Computa-
tional Linguistics: Human Language Technologies,
Volume 1 (Long and Short Papers), pages 4171–4186.
He, K., Zhang, X., Ren, S., and Sun, J. (2016). Deep resid-
ual learning for image recognition. In Proceedings of
the IEEE Conference on Computer Vision and Pattern
Recognition (CVPR), pages 770–778.
Higa, R. et al. (2023). Reward-based negotiating agent
strategies. In Proceedings of the 37th AAAI Confer-
ence on Artificial Intelligence, pages 11569–11577.
Ho, F., Geraldes, R., Gonc¸alves, A., Rigault, B., Sportich,
B., Kubo, D., Cavazza, M., and Prendinger, H. (2022).
Decentralized multi-agent path finding for uav traffic
management. IEEE Transactions on Intelligent Trans-
portation Systems, 23(2):997–1008.
Jr., J. F. N. (1950). The bargaining problem. Econometrica:
Journal of the Econometric Society, pages 155–162.
Kalai, E., Smorodinsky, M., et al. (1975). Other solutions to
nash’s bargaining problem. Econometrica, 43(3):513–
518.
Kawaguchi, S., Fujita, K., and Ito, T. (2011). Compromis-
ing strategy based on estimated maximum utility for
automated negotiation agents competition (anac-10).
In Proceedings of the 24th International Conference
on Industrial Engineering and Other Applications of
Applied Intelligent Systems, (IEA/AIE2011), volume
6704, pages 501–510. Springer.
Kingma, D. P. and Ba, J. (2014). Adam: A
method for stochastic optimization. arXiv preprint
arXiv:1412.6980.
Klein, M. and Rodr
´
ıguez-Aguilar, J. A. (2015). Using au-
tomated negotiation to manage supply chain alliances.
IEEE Intelligent Systems, 30(4):63–69.
Krimpen, T., Looije, D., and Hajizadeh, S. (2013). Hard-
headed. In Springer, volume 435, pages 223–227.
Li, Z. and Hoiem, D. (2016). Learning without forgetting.
In Leibe, B., Matas, J., Sebe, N., and Welling, M.,
editors, Computer Vision - ECCV 2016 - 14th Euro-
pean Conference, Proceedings, Part IV, volume 9908,
pages 614–629. Springer.
Lin, R. et al. (2014). Genius: An integrated environment
for supporting the design of generic automated nego-
tiators. Computational Intelligence, 30(1):48–70.
Mori, A. and Ito, T. (2017). Atlas3: A negotiating agent
based on expecting lower limit of concession function.
In Proceedings of the International Workshop on Ne-
gotiation Agents, pages 169–173. Springer.
Radford, A., Narasimhan, K., Salimans, T., and
Sutskever, I. (2018). Improving language under-
standing by generative pre-training. https://cdn.
openai.com/research-covers/language-unsupervised/
language understanding paper.pdf.
Razeghi, Y. et al. (2020). Deep reinforcement learning for
acceptance strategy in bilateral negotiations. Turkish
Journal of Electrical Engineering & Computer Sci-
ences, 28:1824–1840.
Schulman, J. et al. (2017). Proximal policy optimization
algorithms. arXiv preprint arXiv:1707.06347.
Shimizu, T., Higa, R., Takahashi, T., Fujita, K., and
Nakadai, S. (2023). Scalable negotiating agent strat-
egy via multi-issue policy network. In Proceedings of
the 37th AAAI Conference on Artificial Intelligence,
pages 16326–16327.
Takahashi, T. et al. (2022). Venas: Versatile negotiating
agent strategy via deep reinforcement learning (stu-
dent abstract). In Proceedings of the 36th AAAI Con-
ference on Artificial Intelligence, pages 13065–13066.
Pre-Trained Models and Fine-Tuning for Negotiation Strategies with End-to-End Reinforcement Learning
411
