
Internal State Estimation Based on Facial Images with Individual
Feature Separation and Mixup Augmentation
Ayaka Asaeda and Noriko Takemura
a
Kyushu Institute of Technology, Fukuoka, Japan
Keywords:
Mixup Augmentation, Drowsiness Estimation, Feature Separation.
Abstract:
In recent years, the opportunity for e-learning and remote work has increased due to the impact of the COVID-
19 pandemic. However, issues such as drowsiness and decreased concentration among learners have become
apparent, increasing the need to estimate the internal state of learners. Since facial expressions reflect internal
states well, they are often utilized in research on state estimation. However, individual differences in facial
structure and expression methods can influence the accuracy of these estimations. This study aims to estimate
ambiguous internal states such as drowsiness and concentration by considering individual differences based
on the Deviation Learning Network (DLN). Such internal states exhibit very subtle and ambiguous changes in
facial expressions, making them more difficult to estimate compared to basic emotions. Therefore, this study
proposes a model that uses mixup, which is one form of data augmentation, to account for subtle differences
in expressions between classes. In the evaluation experiments, facial images of learners during e-learning will
be used to estimate their arousal levels in three categories: Asleep, Drowsy, and Awake.
1 INTRODUCTION
The COVID-19 pandemic has led to an increase in
e-learning, allowing educational activities to be con-
ducted from home. In the workplace, an increasing
number of companies are introducing remote work,
allowing employees to perform their tasks from home
without the need to commute to the office. However,
remote work can cause fatigue and drowsiness from
long hours of sitting and watching videos, decreased
concentration due to the lack of people around, and
reduced tension.To prevent such situations, systems
that estimate the user’s state and provide alerts have
gained attention in recent years. For the development
of such systems, accurately understanding the user’s
internal state is crucial. Various sensing data, such as
facial expressions, heart rate, and brain activity, are
used to estimate internal states. Among them, facial
expressions have been used in many state estimation
studies because they contain much information about
the human mental state, and it is easy to collect the
data(Kim et al., 2019)(Zhang et al., 2019). However,
there are issues with using facial expressions for state
estimation. Typical facial features such as eyebrows,
eyes, nose, and mouth differ in size, spacing, angles,
a
https://orcid.org/0000-0003-1977-4690
and shapes from person to person. Such individual
differences in facial structure are crucial for individ-
ual identification but may negatively impact facial ex-
pression recognition accuracy. In addition to struc-
tural differences, it is also known that cultural differ-
ences can cause variations in how facial expressions
are displayed and their intensity, leading to individual
differences in expression(Friesen, 1973). One possi-
ble way to reduce the effects of such individual differ-
ences is to collect facial image data from many peo-
ple, but this is not readily achievable due to privacy
and ethical issues. In addition, to construct a state es-
timation model by machine learning, labels of inter-
nal states are required for each data set. However, the
time and financial cost of annotation is high, and the
larger the dataset, the greater the cost in proportion.
Therefore, this research aims to estimate human states
with a small dataset, considering individual differ-
ences. Although there have been various approaches
to reduce the influence of individual differences in fa-
cial expression recognition, most of the previous stud-
ies have focused on basic emotions, which are rel-
atively easy to estimate(Xie et al., 2021; Liu et al.,
2019; Meng et al., 2017). However, it is essential to
estimate ambiguous internal states such as concentra-
tion, drowsiness, and fatigue, in addition to simple
and clear emotion estimation when considering the
Asaeda, A. and Takemura, N.
Internal State Estimation Based on Facial Images with Individual Feature Separation and Mixup Augmentation.
DOI: 10.5220/0013161900003912
Paper published under CC license (CC BY-NC-ND 4.0)
In Proceedings of the 20th International Joint Conference on Computer Vision, Imaging and Computer Graphics Theory and Applications (VISIGRAPP 2025) - Volume 2: VISAPP, pages
911-918
ISBN: 978-989-758-728-3; ISSN: 2184-4321
Proceedings Copyright © 2025 by SCITEPRESS – Science and Technology Publications, Lda.
911

application to actual systems. Since ambiguous in-
ternal states are not easily expressed in facial expres-
sions and their minute changes, they are more affected
by individual differences than basic emotions. In this
study, we aim to estimate ambiguous internal states
while accounting for individual differences in facial
expression recognition using the Deviation Learning
Network (DLN) (Zhang et al., 2021). The DLN’s
deviation module extracts individual-independent fa-
cial features by subtracting individual-specific fea-
tures. Since ambiguous expressions vary by individ-
ual and situation, their features cannot be uniquely
defined, requiring diverse data for accurate identifi-
cation. However, annotating such subtle changes, es-
pecially for intermediate states, is challenging. To ad-
dress this, we propose a model learning method that
generates intermediary data between classes using the
mixup (Zhang et al., 2018) data augmentation tech-
nique.
In the evaluation experiment, we estimated
drowsiness levels (Awake, Drowsy, and Asleep), us-
ing face image data from 27 e-learning participants.
2 STATE ESTIMATION
SEPARATING INDIVIDUAL
FEATURES
2.1 Facial Region Extraction Method
The Multi-task Cascaded Convolutional Neural Net-
works (MTCNN)(Zhang et al., 2016) was used to
create face image data (160 × 160 pixels) by extract-
ing the face regions of the learner in the image data.
MTCNN is a facial detection method composed of
three stages of CNNs: the Proposal Network (P-Net),
which detects facial regions; the Refine Network (R-
Net), which removes non-facial areas from the can-
didates based on the outputs of the P-Net; and the
Output Network (O-Net), which detects parts such
as the eyes, nose, and mouth, and ultimately outputs
the facial regions. Faces smaller than a certain mini-
mum detection size were excluded to ensure that even
if other people appear in the background behind the
learner, only the learner’s face is targeted for detec-
tion. MTCNN cannot detect a face if the person to
be estimated is looking down from a certain angle. In
some cases, more than one person appeared in the im-
age, so the faces of non-target persons were removed
based on the size of the face area and similarity in-
formation. An example of MTCNN applied to image
data is shown in Figure 1.
Figure 1: Examples of face region extraction using
MTCNN.
2.2 State Estimation Method
The proposed method introduces a state estimation
model that considers individual differences. It con-
sists of a deviation module for separating individual
features and a state estimation module that estimates
the internal state based on the output of the features
by the deviation module. The overview of the state
estimation method is shown in Figure 2. Further de-
tails on both the deviation and state estimation mod-
ules will be provided.
Deviation Module. In the deviation module, an in-
dividual identification model (Identity Model) and a
face recognition model (Face Model) are used as par-
allel networks to extract internal state features in-
dependent of individuals. First, the Identity Model
uses a pre-trained model called FaceNet(Schroff et al.,
2015) to extract individual features. FaceNet is de-
signed to learn optimal embeddings of facial features
extracted from images into an Euclidean space. By
calculating the distances between faces in this gen-
erated space, the method facilitates the determina-
tion of facial similarities. For pre-training the Iden-
tity Model, the VggFace2 dataset(Cao et al., 2018),
comprising face images of 9,131 individuals (approx-
imately 3.31 million images) encompassing diverse
ages and ethnicities, is utilized. The CNN consti-
tuting Identity Model employs the Inception Resnet
(v1)(Szegedy et al., 2017) as in FaceNet. Subse-
quently, we prepared a Face Model with the same
structure and weights as the Identity Model to estab-
lish a parallel network. During the training of this
network, the weights of the Identity Model are fixed,
and the Face Model is trained. The 512-dimensional
state feature vector V
state
that is independent of the
individual is obtained by subtracting the individual
feature vector V
id
(512-dimensional), outputted from
the Identity Model from the facial image feature vec-
tor V
face
(512-dimensional), outputted from the Face
Model. It is formulated as in equation (1).
V
state
= V
face
− V
id
(1)
State Estimation Module. The state estimation mod-
ule uses the 512-dimensional state feature vector V
state
obtained from the deviation module to output features
VISAPP 2025 - 20th International Conference on Computer Vision Theory and Applications
912
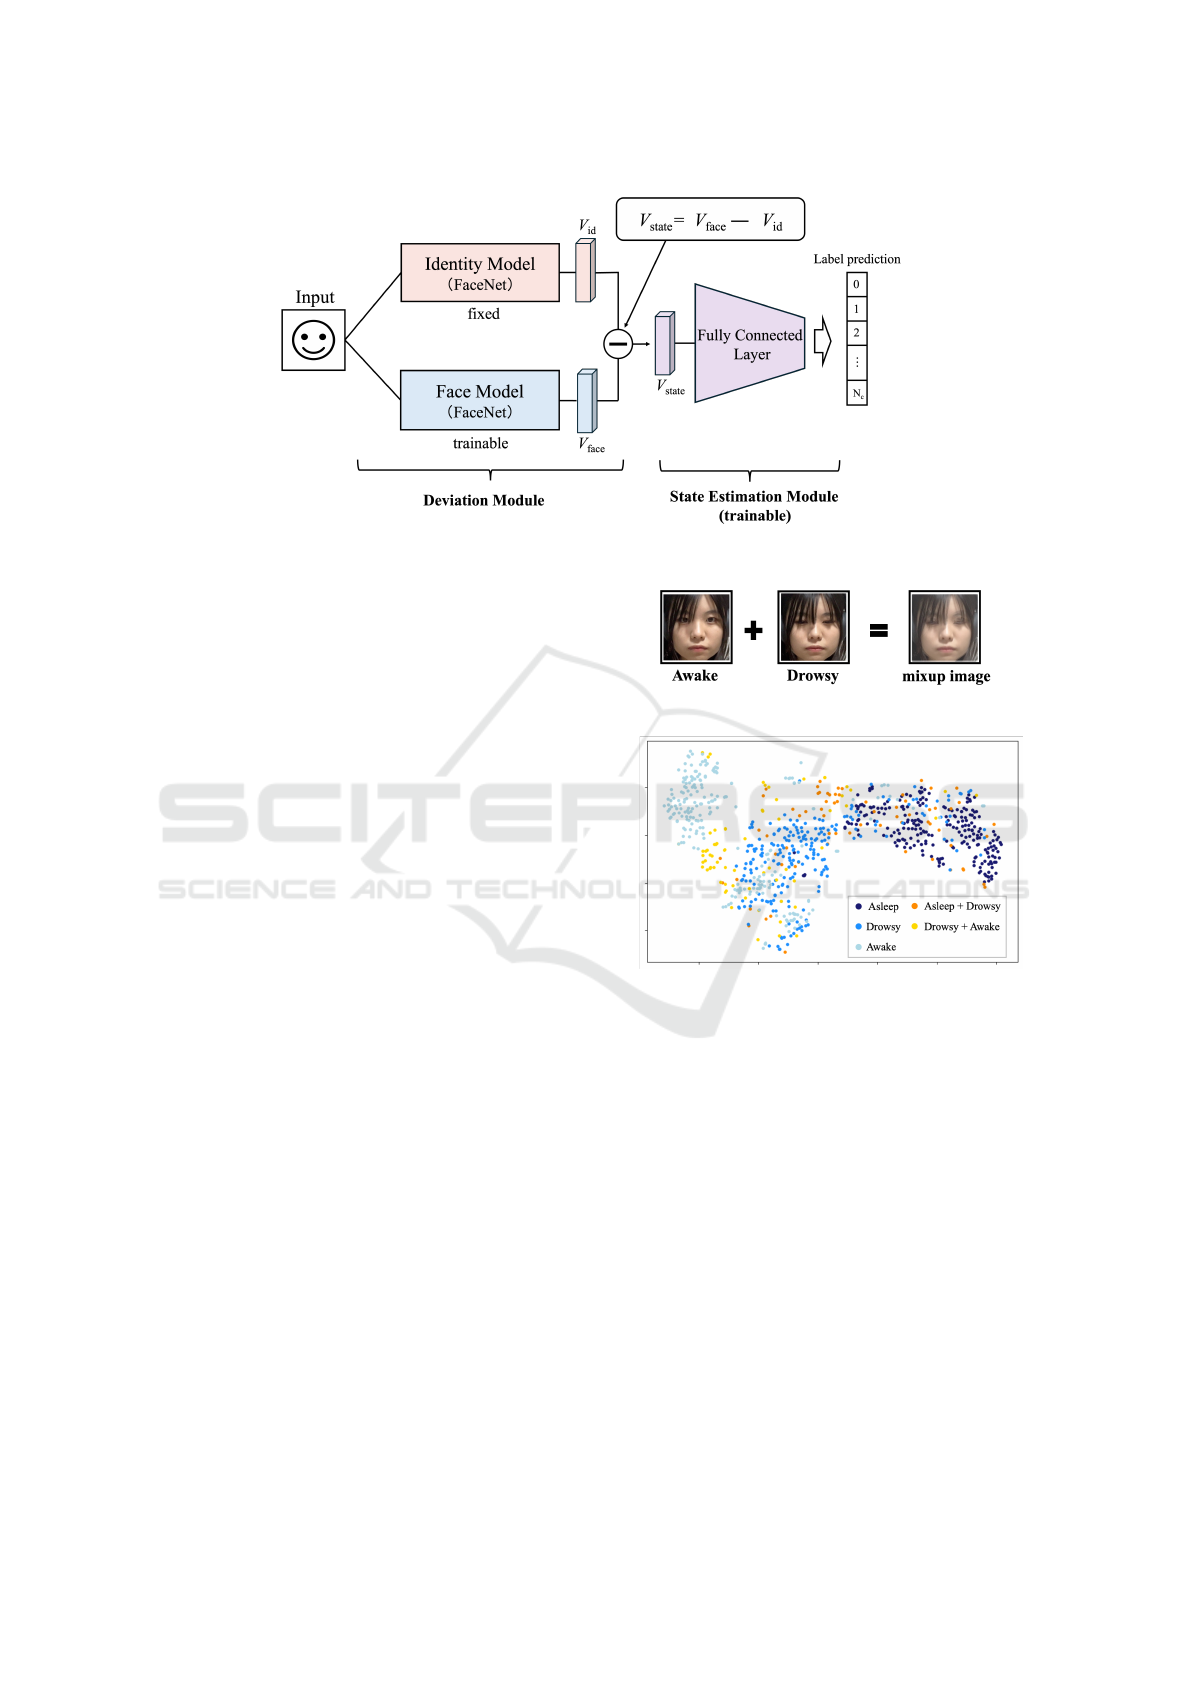
Figure 2: Overview of the proposed method for state estimation separating individual features.
of N
c
dimensions (where N
c
represents the number of
state classes) as its final layer for estimating internal
states. This module comprises two fully connected
layers that reduce dimensions from 512 to 128 and
then to N
c
dimensions. Activation functions Rectified
Linear Unit and Dropout (with a selection rate of 0.4)
are applied in each layer. The final layer employs a
Softmax function, and the loss function used is the
cross-entropy loss.
3 DATA AUGMENTATION WITH
MIXUP
3.1 Mixed Data Generation Method
Mixup is a data augmentation technique that mixes
two images. In this study, we expect to improve
the model’s generalization performance by generat-
ing data intermediate between the two classes that are
difficult to distinguish and increasing the data around
the class boundaries. The mixing process for creat-
ing a mixed data
e
x
i j
and mixed label
e
y
i j
from data i
(image x
i
, label y
i
) and data j (image x
j
, label y
j
) us-
ing the mixing ratio λ is formulated as in equations as
follows.
e
x
i j
= λx
i
+ (1 − λ)x
j
(2)
e
y
i j
= λy
i
+ (1 − λ)y
j
(3)
Figure 3 shows an example of a mixed image ap-
plying mixup using the drowsiness level labeled im-
ages used in the evaluation experiment. Figure 4 dis-
plays a t-SNE visualization of the feature vectors for
both pre-mixed and mixed data (using β(2, 2)), il-
lustrating the distribution of the data in a reduced-
dimensional space.
Figure 3: Examples of applying mixup to facial images.
Figure 4: Visualization of feature vectors including mixup
data with t-SNE.
In this study, we also evaluate the performance of
mixing feature vectors output by the deviation mod-
ule in addition to mixing images. As in the case of
images, mixup is applied using equation (2) and equa-
tion (3) (where x is the feature vector).
3.2 State Estimation with Mixed Images
When training the state estimation model, the train-
ing data is augmented by generating a mixture of
two images with different labels. The network struc-
ture described in Section 2 (Figure 2) uses the Vg-
gface2 dataset for pre-training the Identity Model,
which may not extract individual features correctly
when mixed images are input. Therefore, the Iden-
tity Model is added as a parallel network in the devi-
ation module, and two Identity Models and one Face
Internal State Estimation Based on Facial Images with Individual Feature Separation and Mixup Augmentation
913
(a) Applying mixup to facial images
(b) Applying mixup to feature vectors
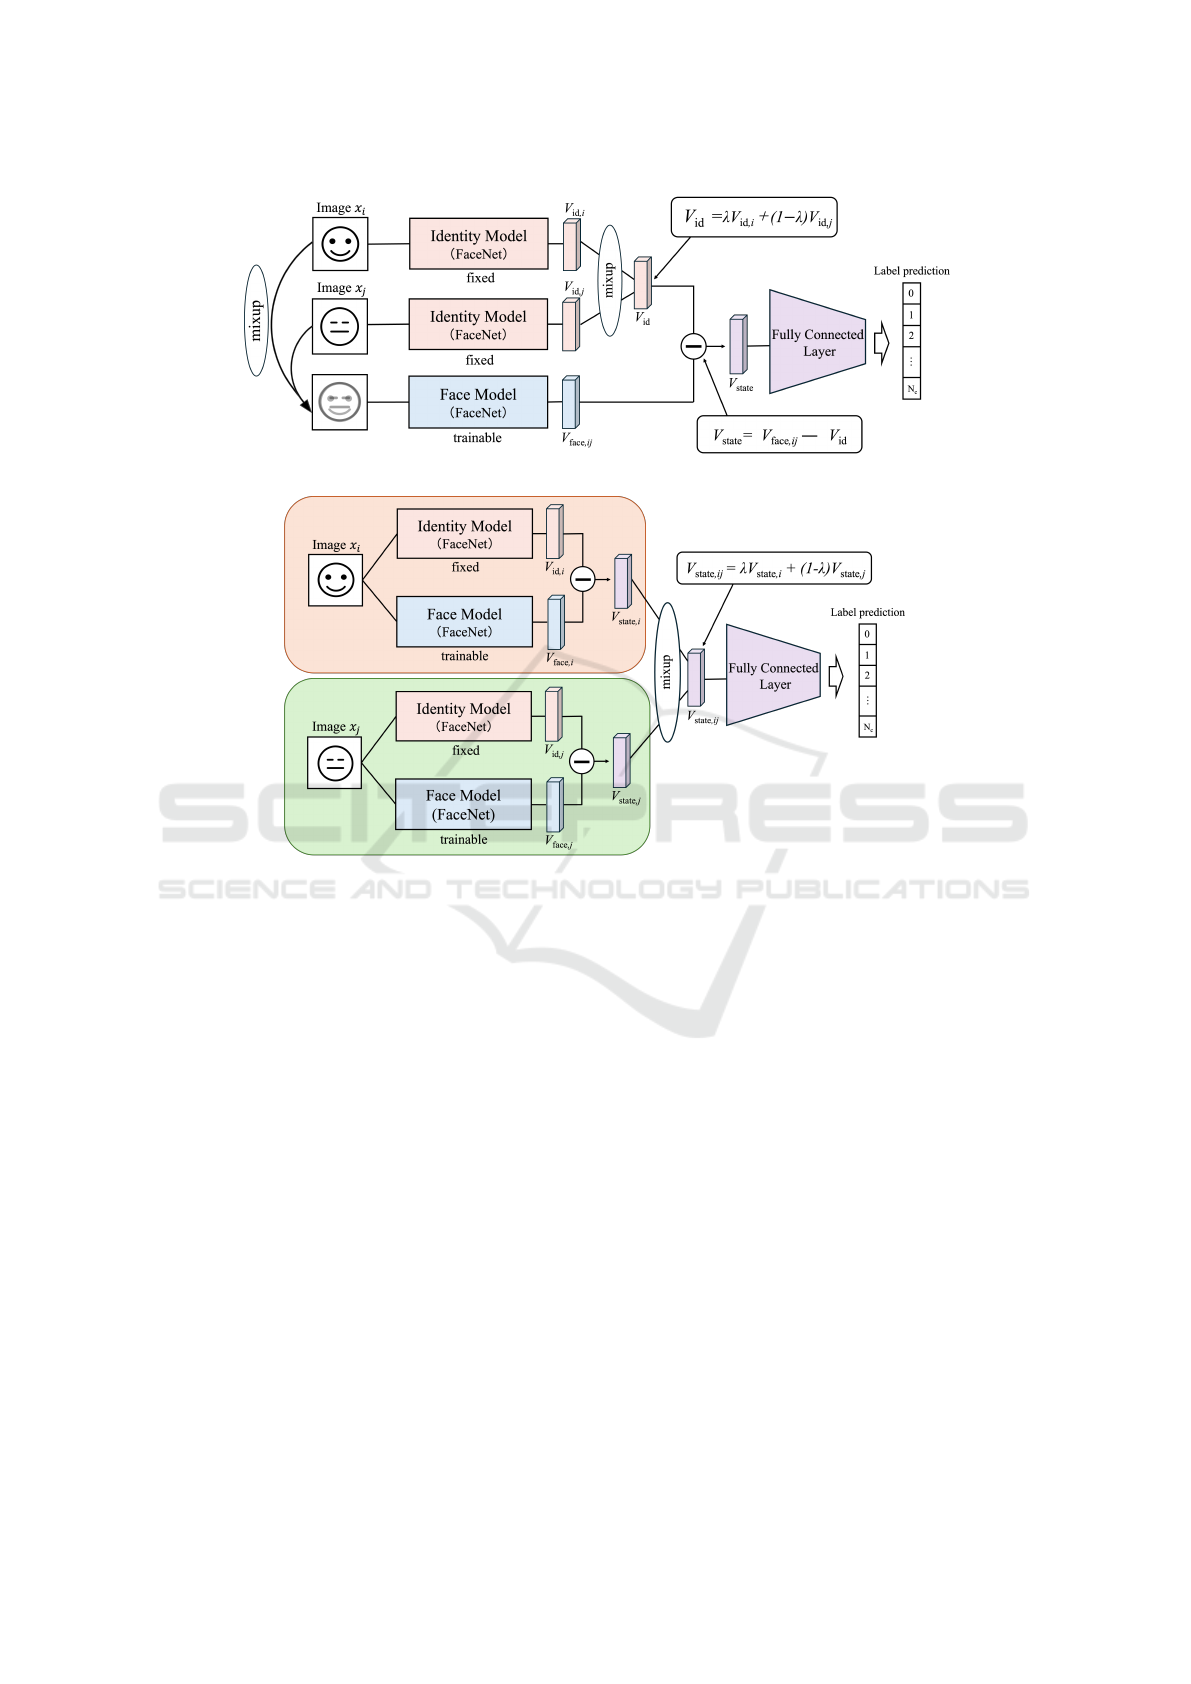
Figure 5: Overview of the state estimation model using mixup.
Model are used for training. The overview of the net-
work is shown in Figure 5(a). The two pre-mixed fa-
cial image data x
i
and x
j
are inputted for the Iden-
tity Model. Based on the mixing ratio λ, individ-
ual feature vectors V
id,i
and V
id, j
that include individ-
ual features from each facial image data are calcu-
lated(equation (2)). The Face Model inputs the mixed
image, blended based on the mixing ratio λ, to obtain
the facial image feature vector V
face,i j
. Then, the in-
dividual feature vector V
id
is subtracted from the face
image features V
face,i j
, and the obtained state features
vector V
state
are used to estimate the state in the state
estimation module.
3.3 State Estimation with Mixed State
Feature Vector
The results were verified not only in the case of blend-
ing two images, but also in the case of blending fea-
ture vectors extracted from each image. For each of
the two face image data x
i
and x
j
, the state feature
vectors V
state,i
and V
state, j
are obtained by the devia-
tion module shown in Figure 2. These are blended
using mixup to obtain V
state,i j
(equation (2)). After
that, V
state,i j
is input to the state estimation module
to estimate the state, as described in Section 2. The
overview of the network is shown in Figure 5(b).
4 EVALUATION EXPERIMENTS
4.1 Datasets
We collected video data of 53 undergraduate students
learning about information science by e-learning. The
subjects were 17 males and 36 females of East Asian
descent, with varying hairstyles and clothing. They
viewed the lecture videos(slides + audio) on a laptop
and were recorded from the front, capturing their up-
per body using the laptop’s built-in camera, as shown
in Figure 1. The data collection experiment was
conducted over four days, with each subject view-
VISAPP 2025 - 20th International Conference on Computer Vision Theory and Applications
914
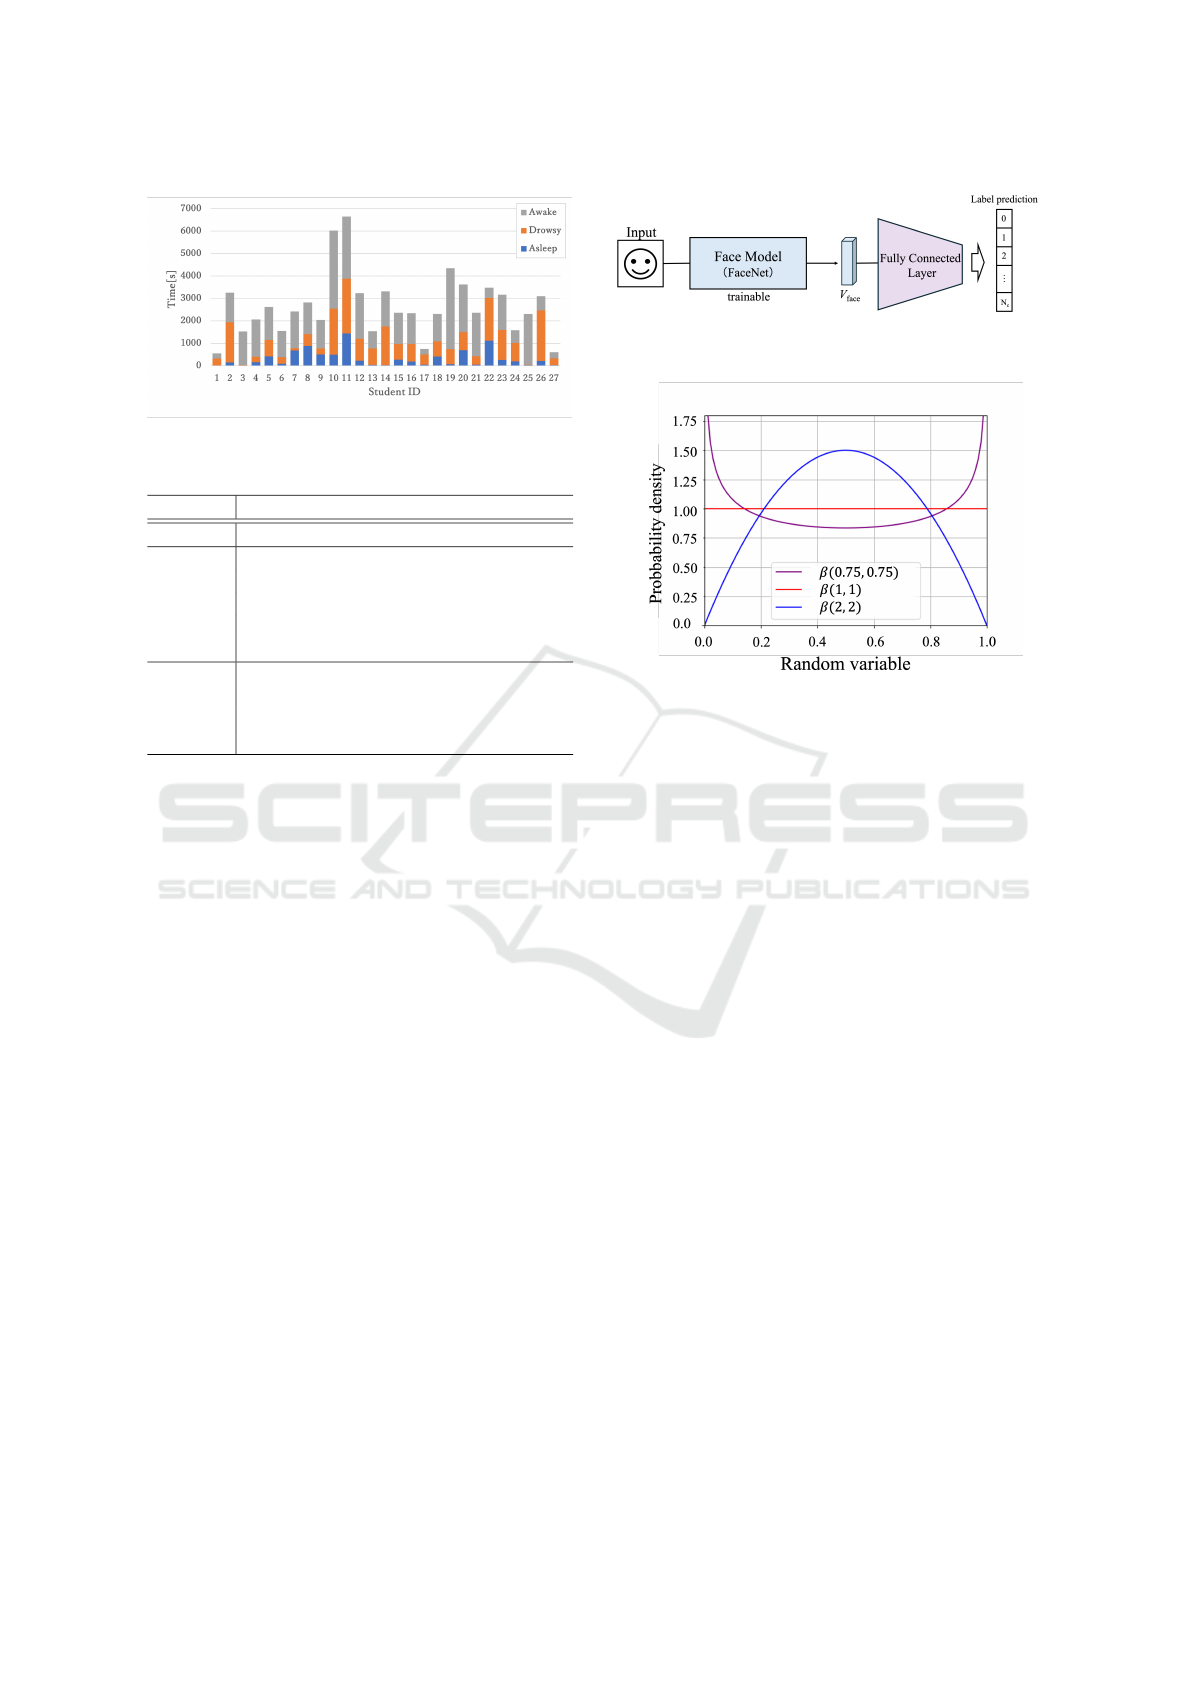
Figure 6: Distribution of each drowsiness state(Before un-
dersampling).
Table 1: Coding scheme of drowsiness state.
Label Scheme
Asleep - Eyes are closed over 1 second
- Eyes are not always open
- Pupils do not move
Drowsy - Eyes are closed for less than 1 second
- Body movements and head poses are
uncontrolled
- Eyes are wide open
Awake
- Pupils move to the right and left
- Body movements and head poses are
under control
ing 1 to 3 lecture videos (about 10 minutes each)
daily. However, since each subject attended only the
days they could, the total number of data varied per
subject.The captured image size was 640 × 480 pix-
els with a frame rate of 10fps. A single annotator
manually annotates the drowsiness level of the sub-
ject while watching the video of the subject learning
and the lecture video. In the annotation process, the
annotator labeled the drowsiness level of the learn-
ers (Asleep/Drowsy/Awake) every second based on
their state in continuous videos. Drowsiness levels
were annotated based on the criteria shown in Table
1. In this study, we performed an evaluation exper-
iment using a three-class classification based on the
images for the 27 subjects who had data for all labels
(Asleep/Drowsy/Awake). A breakdown of the data
for each label by subject is shown in Figure 6.
4.2 Comparative Methods
In this experiment, we evaluate the model’s perfor-
mance with and without individual feature separa-
tion, with and without mixup, and by its application
method.
4.2.1 Comparison with and Without Individual
Feature Separation
This experiment compares the proposed method,
which estimates drowsiness using state features sepa-
Figure 7: Overview of the comparative method without the
deviation module.
Figure 8: Graph of the beta distribution.
rated from individual features via the deviation mod-
ule (Figure 2), with a method that does not sep-
arate features. The comparative method directly
extracts features from input images using only the
Face Model and estimates drowsiness, with its initial
weights identical to those in the proposed method. An
overview of the comparative method is shown in Fig-
ure 7.
4.2.2 Comparison Based on Mixup Application
Method
Accuracy comparisons are conducted for the state
estimation model that separates individual features
based on whether mixup is applied and the method of
its application (across four specified patterns). In this
experiment, for the combination of classes to apply
mixup, we mixed the images and state features of the
Asleep-Drowsy and Drowsy-Awake classes, which
have relatively close features between the classes.
In this experiment, mixed data is used only for the
training set, while the validation and test data consist
solely of the original data (Asleep/Drowsy/Awake)
without any mixing.
Comparison Based on the Stage of Mixup. Appli-
cation We compare two patterns for the mixup appli-
cation stages. The first is to mix the images directly
before input (Figure 5(a)). The other method is to mix
feature vectors (Figure 5(b)).
Comparison Based on the Subject of Mixup. Ap-
plication The model performance is compared for
Internal State Estimation Based on Facial Images with Individual Feature Separation and Mixup Augmentation
915
Table 2: Number of samples in each group for cross-
validation.
Asleep Drowsy Awake
group1 1,810 1,811 1,810
group2 5,934 5,934 5,934
group3 6,002 6,002 6,002
group4 15,165 15,165 15,165
group5 2,109 2,110 2,109
group6 4,822 4,822 4,822
group7 5,336 5,336 5,336
group8
8,859 8,859 8,860
group9 2,800 2,880 2,880
Table 3: Comparison of macro-F1 scores with and without
the deviation module.
Method macro-F1
w/ DM
∗
(Ours) 0.535
w/o DM 0.523
∗
DM: Deviation Module
two patterns of mixups: mixing the same and different
persons.
Comparison Based on the Number of Mixups. The
number of mixed data with mixups used for the train-
ing data is compared for accuracy in 5 patterns: 0%,
10%, 20%, 30%, and 40% of the original data.
Comparison Based on the Mixup Ratio. Randomly
generates values of λ based on the beta distribu-
tion. Three patterns of beta distributions were set
up with different shapes: Beta(0.75, 0.75), Beta(1, 1)
and Beta(2, 2). A graph of the beta distribution is
shown in Figure 8.
4.3 Evaluation Methods
The 27 participants were divided into nine groups of
three, and leave-one-group-out cross-validation was
performed. One group was used as test data, another
as validation data, and the remaining seven as training
data. This process was repeated nine times so each
group served as test data once, and performance was
evaluated by averaging the nine results. Table 2 shows
the label distribution in each group. To address label
imbalance, face images for training were undersam-
pled per subject. The macro-F1 score, the average of
F1 scores across classes, was used as the evaluation
metric. Mini-batch learning was applied with a batch
size of 128. Models were trained for 1500 batches and
evaluated on test data. The initial learning rate was
0.001 and reduced by a factor of 0.1 at the end of each
epoch (approximately 1000 batches). Weight decay
of 0.001 was used to prevent overfitting, and Stochas-
tic Gradient Descent (SGD) was employed as the op-
Table 4: Comparison of macro-F1 scores with and without
mixup (β(0.75, 0.75)).
Method Pair macro-F1
w/o mixup - 0.535
mixup Images
Other 0.537
Same 0.549
mixup V
state
Other 0.550
Same 0.569
timizer. A fixed seed ensured reproducibility, and the
same pairs were mixed when generating mixed data.
4.4 Evaluation Results
4.4.1 Comparison with and Without Individual
Feature Separation
Table 3 shows the macro-F1 score results for cases
where state estimation was conducted with individual
features separated using the deviation module, com-
pared to direct state estimation from facial images
without using the deviation module. A comparison of
accuracy with and without individual feature separa-
tion showed that the proposed method with individual
feature separation improved accuracy. This indicates
that separating individual features from facial image
features and extracting state features independent of
the individual is effective for estimating ambiguous
internal states.
4.4.2 Comparison with and Without Mixup and
Its Application Methods
Table 4 shows the macro-F1 score results with and
without mixup, as well as different application meth-
ods, when individual features are separated using the
deviation module. The amount of mixed data added
was set to 10%, with the mixup ratio determined by
the beta function β(0.75, 0.75). The results indicate
that applying mixup increases accuracy across all
patterns compared to not applying it, demonstrating
its effectiveness in the proposed model. Confusion
matrices for cases with and without mixup (mixing
the same individuals, V
state
) are shown in Table 5,
which presents the cumulative results of nine cross-
validation rounds. Table 5 also highlights that mixup
improves identification accuracy for Asleep-Drowsy
and Drowsy-Awake transitions.
Comparison Based on the Stage of Mixup Appli-
cation. Comparing the stages of the mixup appli-
cation, higher accuracy was obtained when feature
vectors were mixed than when images were mixed.
This could be because directly mixing images might
VISAPP 2025 - 20th International Conference on Computer Vision Theory and Applications
916
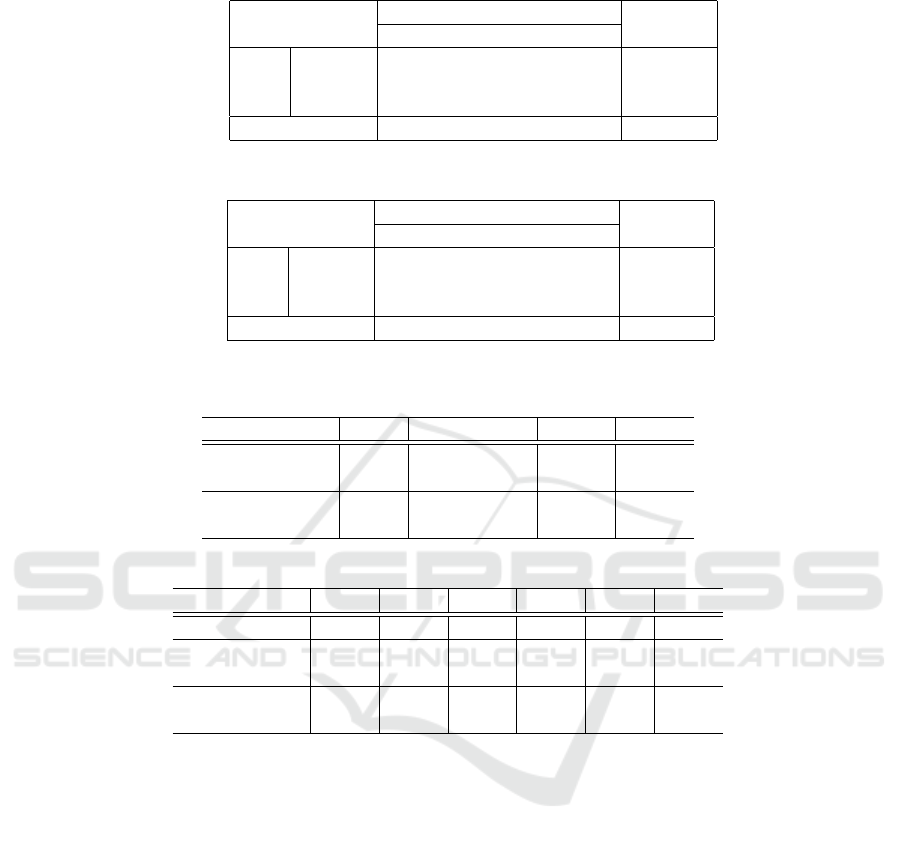
Table 5: The confusion matrices with and without mixup (mixing the same persons, V
state
).
Preds
Recall
Asleep Drowsy Awake
Asleep 42,685 5,515 4,637 0.808
True Drowsy 9,178 15,950 27,710 0.302
Awake 5,229 16,608 31,000 0.587
Precision 0.748 0.419 0.489 F1:0.535
(a) Without mixup
Preds
Recall
Asleep Drowsy Awake
Asleep 44,977 4,629 3,231 0.851
True Drowsy 9,753 16,651 26,434 0.315
Awake 5,042 15,476 32,319 0.612
Precision 0.752 0.453 0.521 F1:0.569
(b) With mixup
Table 6: Comparison of macro-F1 scores based on the beta distribution parameter.
Method Pair β(0.75, 0.75) β(1, 1) β(2, 2)
mixup Images
Other 0.537 0.537 0.537
Same 0.549 0.549 0.549
mixup V
state
Other 0.550 0.550 0.550
Same 0.569 0.569 0.568
Table 7: Comparison of macro-F1 scores when changing the number of mixups.
Method Pair 0% 10% 20% 30% 40%
w/o mixup 0.535 - - - -
mixup Images
Other - 0.537 0.536 0.536 0.532
Same - 0.549 0.539 0.536 0.529
mixup V
state
Other - 0.550 0.548 0.549 0.547
Same - 0.569 0.565 0.556 0.558
include unnecessary information for the model’s es-
timations, making it harder to identify the essential
features. On the other hand, mixing state feature vec-
tors, which only handle the feature of drowsiness al-
ready separated from individual features in the devi-
ation module, likely include less irrelevant informa-
tion. This makes it easier to extract the crucial infor-
mation related to state estimation.
Comparison Based on the Subject of Mixup Appli-
cation. Comparing the results for the mixup pairs,
better accuracy was achieved when mixing the same
person than when mixing different persons, both mix-
ing images directly and mixing feature vectors. This
is likely because when mixing different persons, not
only are the features of different classes mixed due
to the mixup, but also the features of different indi-
viduals are mixed together, which prevents effective
learning of the model for state estimation.
4.4.3 Ablation Study
Comparison Based on the Mixup Ratio. Table 6
shows the results of the beta distribution for three
patterns of mixing ratio λ: β(0.75, 0.75), β(1, 1) and
β(2, 2). The accuracy did not change significantly un-
der each condition, likely because the added mixture
data is relatively small (about 10%).
Comparison Based on the Number of Mixups Ta-
ble 7 shows the results of incrementally adding mixup
data as training data to find the optimal amount. With
the beta distribution set to β(0.75, 0.75), adding 10%
mixup data achieves the highest accuracy, after which
accuracy declines with further increases. This sug-
gests that while mixup is effective, finding the optimal
proportion is crucial, as excessive amounts reduce ac-
curacy.
Internal State Estimation Based on Facial Images with Individual Feature Separation and Mixup Augmentation
917

Table 8: Comparison of the individual identification accu-
racy with and without the deviation module.
Method Accuracy
w/ DM (Ours) 0.633
w/o DM 0.830
4.5 Verification of Individual Features
Separation
To verify whether the deviation module effectively
separates individual features, we compare the indi-
vidual identification accuracy of the proposed method
(Figure 2) and the comparative method (Figure 7).
For individual identification, we use the Awake data
of 25 subjects who have data from two or more lec-
ture sessions. We randomly select one facial image
of each subject from the data of different lecture ses-
sions and use them as Gallery (registered data) and
Probe (test data), respectively. We compare the fea-
ture vector obtained by inputting a Probe into the es-
timation model with the feature vectors obtained by
inputting each subject’s Gallery into the model, and
estimate that the subject whose feature vector is most
similar to the Probe is the same person. However,
the feature vector is V
state
for the proposed method
and V
face
for the comparison method, and the simi-
larity of the feature vectors is obtained using cosine
similarity. Individual identification is performed for
each Probe and the percentage of correct recognition
is calculated. The trials were repeated 100 times and
the averages of the recognition accuracy are shown
in Table 8. Lower recognition accuracy values indi-
cate better performance, and the proposed method’s
lower accuracy confirms the deviation module effec-
tively separates individual features.
5 CONCLUSION
In facial expression recognition, individual facial fea-
ture differences and expression methods can nega-
tively affect recognition accuracy. This study pro-
poses a method using a deviation module to reduce
the impact of individual differences, especially for es-
timating ambiguous internal states, which are more
challenging than basic emotions. To handle subtle and
ambiguous expression changes, we also utilize mixup
for data augmentation. Evaluation on e-learning facial
images for drowsiness estimation showed that using
the deviation module improved accuracy, confirming
its effectiveness in handling individual differences.
Applying mixup further enhanced accuracy, with the
best results achieved when mixing state feature vec-
tors for the same individual.
REFERENCES
Cao, Q., Shen, L., Xie, W., Parkhi, O. M., and Zisserman,
A. (2018). Vggface2: A dataset for recognising faces
across pose and age. In 2018 13th IEEE International
Conference on Automatic Face and Gesture Recogni-
tion (FG 2018), pages 67–74.
Friesen, W. V. (1973). Cultural differences in facial expres-
sions in a social situation: An experimental test on the
concept of display rules.
Kim, J.-H., Kim, B.-G., Roy, P. P., and Jeong, D.-M.
(2019). Efficient facial expression recognition algo-
rithm based on hierarchical deep neural network struc-
ture. IEEE Access, 7:41273–41285.
Liu, X., Vijaya Kumar, B., Jia, P., and You, J. (2019). Hard
negative generation for identity-disentangled facial
expression recognition. Pattern Recogn., 88(C):1–12.
Meng, Z., Liu, P., Cai, J., Han, S., and Tong, Y. (2017).
Identity-aware convolutional neural network for fa-
cial expression recognition. In 2017 12th IEEE In-
ternational Conference on Automatic Face & Gesture
Recognition (FG 2017), pages 558–565.
Schroff, F., Kalenichenko, D., and Philbin, J. (2015).
Facenet: A unified embedding for face recognition
and clustering. In 2015 IEEE Conference on Com-
puter Vision and Pattern Recognition (CVPR), pages
815–823.
Szegedy, C., Ioffe, S., Vanhoucke, V., and Alemi, A. A.
(2017). Inception-v4, inception-resnet and the impact
of residual connections on learning. In Proceedings of
the Thirty-First AAAI Conference on Artificial Intelli-
gence, AAAI’17, page 4278–4284. AAAI Press.
Xie, S., Hu, H., and Chen, Y. (2021). Facial expression
recognition with two-branch disentangled generative
adversarial network. IEEE Transactions on Circuits
and Systems for Video Technology, 31(6):2359–2371.
Zhang, H., Cisse, M., Dauphin, Y. N., and Lopez-Paz, D.
(2018). mixup: Beyond empirical risk minimization.
In International Conference on Learning Representa-
tions.
Zhang, H., Jolfaei, A., and Alazab, M. (2019). A face
emotion recognition method using convolutional neu-
ral network and image edge computing. IEEE Access,
7:159081–159089.
Zhang, K., Zhang, Z., Li, Z., and Qiao, Y. (2016). Joint
face detection and alignment using multitask cascaded
convolutional networks. IEEE Signal Processing Let-
ters, 23(10):1499–1503.
Zhang, W., Ji, X., Chen, K., Ding, Y., and Fan, C. (2021).
Learning a facial expression embedding disentangled
from identity. In 2021 IEEE/CVF Conference on
Computer Vision and Pattern Recognition (CVPR),
pages 6755–6764.
VISAPP 2025 - 20th International Conference on Computer Vision Theory and Applications
918
