
Sorting Circulating Tumor Cells: A Low Flow Microfluidic
Pre-Enrichment Function for Improved Separation
in Serial Two-Stage Sorting Device
Emma Dupont
1,2 a
, Emilie Laffont
1,2
, Marie Piecyk
3b
, Léa Payen
3c
, Clément Albin
2
,
Gilles Simon
2
, Damien Le Roy
2d
and Anne-Laure Deman
1e
1
Université Claude Bernard Lyon 1, CNRS, INSA Lyon, Ecole Centrale de Lyon, CPE Lyon, INL, UMR5270 69621
Villeurbanne, France
2
Université Claude Bernard Lyon 1, CNRS, Institut Lumière Matière, UMR5306, F-69100, Villeurbanne, France
3
Laboratoire de Biochimie Et Biologie Moléculaire, Groupe Hospitalier Sud, Hospices Civils de Lyon, 69495 Pierre Bénite,
France
Keywords: Cell Separation, Circulating Tumor Cells, Dean Vortices, Liquid Biopsy, Micro Milling, Microfluidic Device,
Passive Separation, Size Sorting, Spiral Microchannel.
Abstract: The isolation of Circulating Tumor Cells (CTCs) directly from blood by liquid biopsy could lead to a paradigm
shift in clinical cancer care by enabling earlier diagnosis, more accurate prognosis and personalized treatment.
Nevertheless, the specific challenges of CTCs, including their rarity and heterogeneity, have so far limited
the use of CTCs in clinical studies. Currently, no device fully meets the requirements of high recovery, high
purity, short processing time and ease of use for end-users. A promising new strategy involves combining a
higher throughput but less specific pre-enrichment step based on size sorting together with a highly specific
but slower immunomagnetic sorting. This approach requires the initial function to operate at lower flow rates
than commonly used to connect the two functions in series. In this context, we developed a Dean spiral
microfluidic device, optimized for sorting 10µm and 15µm beads by size. We showed that it successfully
separates mimicking CTCs from white blood cells at low flow rates (<100 mL/h).
1 INTRODUCTION
Circulating tumor cells (CTCs) have been biomarkers
of interest to the medical community for many years.
Originating from the patient tumor and accessible by
blood sampling, they can be used to enhance our
understanding of metastasis dynamics, improve
cancer detection (through liquid biopsy) (Mazzitelli,
et al., 2023), prognosis assessment and refine
monitoring strategies (CellSearch, 2024). Despite the
appealing interests of CTCs, a major issue stands in
the way of their recovery. The CTC are extremely
rare in the blood: 1-1000 CTC per mL, i.e. 1-1000
CTC per 10
7
white blood cells (WBC) and 10
9
red
a
https://orcid.org/0009-0007-8381-3080
b
https://orcid.org/0009-0000-3765-9472
c
https://orcid.org/0000-0002-1599-5886
d
https://orcid.org/0000-0002-3111-6044
e
https://orcid.org/0000-0001-9351-8703
blood cells (RBC) (Stoecklein, et al., 2016), making
the sorting complex. Moreover, CTC sorting must
fulfill some requirements. First, it must have a high
recovery rate (>90%): the fraction of CTCs being
very low in a blood sample, it is necessary to get the
maximum of them downstream of the process.
Secondly, the purity of the sample is also crucial. The
other blood cells are outnumbered compared to the
CTCs, and they may pollute the downstream analysis,
so the purity of the sorting must be high (>99,99%).
Additionally, it is important to preserve cell viability
during isolation.
Studies in the literature generally isolate CTCs
from other blood cells based on differences in their
biological or physical properties, such as surface
Dupont, E., Laffont, E., Piecyk, M., Payen, L., Albin, C., Simon, G., Roy, D. L. and Deman, A.-L.
Sorting Circulating Tumor Cells: A Low Flow Microfluidic Pre-Enrichment Function for Improved Separation in Serial Two-Stage Sorting Device.
DOI: 10.5220/0013162200003911
Paper published under CC license (CC BY-NC-ND 4.0)
In Proceedings of the 18th International Joint Conference on Biomedical Engineering Systems and Technologies (BIOSTEC 2025) - Volume 1, pages 163-170
ISBN: 978-989-758-731-3; ISSN: 2184-4305
Proceedings Copyright © 2025 by SCITEPRESS – Science and Technology Publications, Lda.
163

marker expression or size, deformability, and
dielectric properties. In terms of biological properties,
two strategies are possible: positive enrichment by
labelling CTCs with magnetic nanoparticles or
negative depletion by labelling WBCs. However, not
all CTCs express the same markers on their surface,
so there is a risk of losing some of them by targeting
a specific marker. Furthermore, labelling WBCs with
anti-CD15 or anti-CD45 markers is not fully efficient,
and some WBCs remain non-magnetic. The
biological approach has therefore its limitations.
Alternatively, physical property differences can be
exploited to separate CTCs from other blood cells by
driving them into different outlets. This method offers
high throughput without any labelling steps, but if the
physical properties are too similar, a precise
separation is challenging. For instance, CTCs are
typically larger than WBCs and RBCs (Hou et al.,
2013). However, the overlapping size range between
CTCs and WBCs inevitably limits the purity of the
isolation process.
Much work has been published in the literature in
recent years on sorting CTCs in microsystems (Qiao,
et al., 2024) (Descamps, et al., 2022), and devices
have been commercialized (Parsortix PC1, ANGLE,
Genesis System, BIORAD; ClearCell FX1,
BIOLIDICS; VTX-1 Liquid Biopsy System,
VORTEX) but CTC analysis is still not routinely
carried out in hospitals. Indeed, despite significant
successes, isolation methods relying on a single
separation technique do not meet all the CTC sorting
requirements mentioned earlier. A promising
approach is to combine two different sorting methods
to make up for the shortcomings of each, using
physical separation method as a pre-enrichment step
followed by an immunomagnetic sorting step (Li, et
al., 2024) (Nian, et al., 2024) (Descamps, et al.,
2021).
Combining two functions in microfluidics is
challenging as each function optimally operates at a
different flow rate. In particular, hydrodynamic
devices often work at much higher flow rates than
immunomagnetic ones. In this work we set out to
develop a hydrodynamic pre-enrichment function
operating at low flow rates. Dean vortices have been
widely studied as a size-based CTC sorting technique,
using inertial microfluidics to position particles
within the channel based on their size. Different
systems have been developed yielding promising
results (Zhu, et al., 2024) (Akbarnataj, et al., 2023)
(Al-Halhouli, et al., 2018) at flow rates ranging from
100-300mL/h. Here we report on a design of Dean
flow device that operates at lower flow rates (<100
mL/h) compared to most spirals developed for CTC
sorting, and that can be used as a pre-enrichment step
prior to an immunomagnetic sorting step.
2 DEVICE FABRICATION
2.1 Microchannel Design
In rectangular straight microchannels, the equilibrium
position of a particle, in the section of the channel of
width 𝑤 and height ℎ, is mainly due to lift forces (Di
Carlo, et al., 2009):
𝐹
=
𝜌𝑈
𝑎
𝐷
𝑓
𝑅𝑒,𝑥
(𝑁)
(1
)
where 𝜌 is the fluid density, U the fluid mean velocity
(m/s), 𝑎
the particle diameter, and 𝐷
=𝑤ℎ/(𝑤+
ℎ) is the hydraulic diameter of the channel and 𝑓
a
lift coefficient ranged between 0.02-0.05, depending
on 𝑅𝑒 the Reynolds number and 𝑥
, the particle
position in the channel.
In curved channels, the curvature creates a
pressure gradient in the channel, which leads to the
formation of two counter-rotating vortices, known as
Dean vortices. In such vortices, a particle is submitted
to the Dean drag force, which can be expressed as (Di
Carlo, et al., 2007):
𝐹
=𝜌
𝑈
𝑎
𝐷
𝑅
(N)
(2
)
where R is the radius curvature of the spiral. The Dean
number De is often use to quantitively characterize
the strength of secondary flows in such channels:
𝐷𝑒=𝑅𝑒
𝐷
2𝑅
(3
)
The higher it is, the stronger are the secondary
vortices. A particle flowing in a spiral or curved
channel is then mainly subjected to 𝐹
and 𝐹
in the
section perpendicular to the main flow. The
competition between these two forces is often used to
describe the particle behavior and predict its
equilibrium positions in the channel section. It is
important, for particle size sorting, to note that both
forces depend on the particle diameter 𝑎
(𝐹
∼𝑎
and 𝐹
∼𝑎
). This results in two distinct behaviors:
bigger particles tend to focus at an equilibrium
position and remain in a specific location within the
channel’s section, while smaller particles tend to be
dragged into Dean's vortices and recirculate across
BIODEVICES 2025 - 18th International Conference on Biomedical Electronics and Devices
164

the channel width (Bhagat A. A., et al., 2010), (Wu,
et al., 2012).
To effectively separate WBCs from CTCs in a
spiral microfluidic channel, we aim to focus the two
populations in separate locations of the channel
width. We have designed a spiral channel based on
key principles described in the literature.
First, to ensure proper particle focusing, we
considered the confinement ratio of the particle. As
outlined by Di Carlo et al. (2007), this ratio must
satisfy:
>0.07
(4)
to achieve proper focusing. Another critical
parameter is the ratio of lift forces to Dean forces, as
described by Amini et al. (2014). They established the
inequality:
𝑅
=
𝐹
𝐹
~
2𝑅𝑎
𝐷
>~0.08
(5)
This inequality, derived from their previous
experimental results and other study (Di Carlo, et al.,
2007), provides a guideline for selecting suitable
spiral geometry to achieve efficient particle focusing.
Secondly, a trapezoidal cross-section was selected
to enhance size-based separation across the channel.
This design introduces asymmetry in the flow profile,
which shifts the Dean vortices centres toward the outer
wall of the channel. As a result, smaller particles, such
as WBCs, entrained in the vortices, are pushed toward
the outer wall, whereas larger particles, like CTCs,
remain focused near the inner wall. This configuration
significantly improves the separation efficiency
between different size populations. (Wu, et al., 2012)
(Akbarnataj, et al., 2023).
In order to operate at lower flow rates, we
developed a spiral with a reduced cross-sectional area
compared to those reported in the literature. The
reduction in channel dimensions aims to achieve the
necessary velocities to generate Dean vortices at low
flow rates.
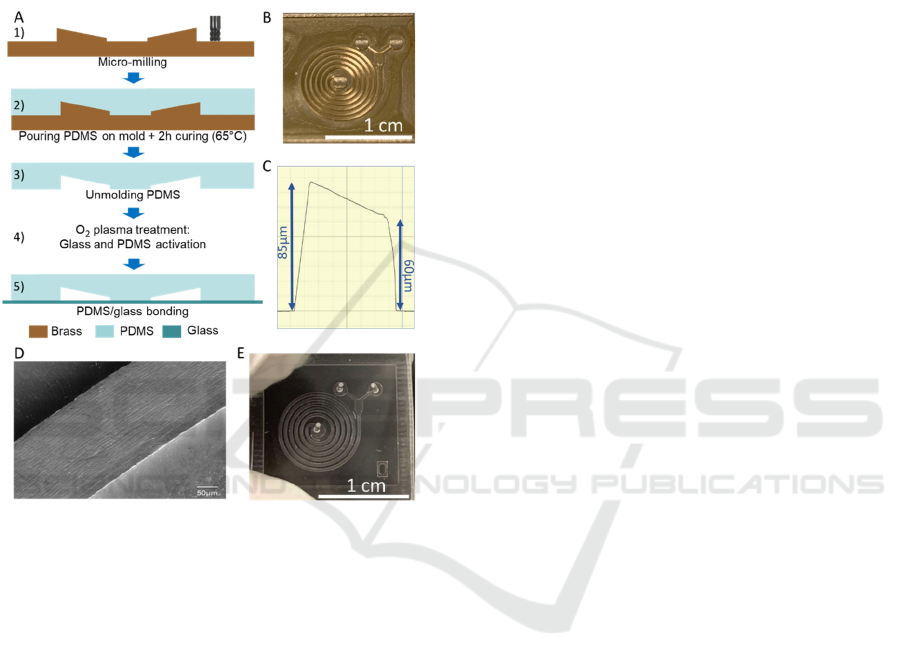
Based on these criteria, we designed a 6-loops
spiral with one inlet and two outlets, an internal radius
of 1 mm and a trapezoidal cross-section. The width w
of the channel is 250 µm, the height of the inner wall
of the channel is 60 µm and the height of the outer
one is 85 µm. The spacing between the windings is
equal to the width of the micro-channels.
2.2 Microsystem Fabrication Steps
To create a microchannel with a trapezoidal cross-
section, a mold with variable height was required.
The master mold was fabricated by micro-milling
(CNC Mini-Mill/3, Minitech Machinery
Corporation) on brass (Figure 1.A.1) in a two-step
process (Figure 1.B). First the horizontal contour of
the spiral has been milled using 500 µm and 200 µm
flat nose end mill. Secondly, the machining of the top
wall of the channel (which is inclined due to the
trapezoidal cross-section) was obtained
using a 200
µm diameter ball nose mill with z-axis steps of 1 µm.
A SEM-image and the profile (Dektak150, Veeco) of
the channel are shown in Figure 1.C and Figure 1.D.
The microchannels were then fabricated by casting
PDMS (Sylgard
Silicone Elastomer, 10:1 base and
curing agent mixing ratio) on the mold and curing it
at 65°C during 2 h (Figure 1.A.2). After curing, the
PDMS was peeled from the mold and plasma bonded
to a 1 mm thick flat glass slide to complete the
microchannel (Figure 1.A.5). Input and output ports
of 0.5 mm were punched prior to bonding step with
the Uni-Core TM Puncher. Figure 1.E shows a picture
of the PDMS final device.
3 MATERIALS AND METHODS
3.1 Sample Preparation
For bead experiments, fluorescent-polystyrene
particles with diameter of 10 μm (9.9 ± 0.09 μm,
blue), 15 μm (15.4 ± 0.139 μm, red) (Thermofisher
scientific), were diluted in Phosphate-buffered saline
(PBS). A solution containing both bead populations
was prepared with equal concentrations of 1.10
beads/mL for each population.
For cells and blood sample experiments, MDA-MB-
231 and MCF7 cells were cultured to mimic the CTC
in blood. The cells were stained with Hoechst
(1µL/mL, blue) for 15 minutes at 37°C, followed by
three centrifugation (1000 rpm, 5 minutes) and
resuspension (in 1xPBS) steps. The final
concentration used was 9.10
cells/mL (MDA) and
10.10
cells/mL (MCF7). All experiments involving
healthy blood samples were carried out in conformity
with the relevant French laws and institutional
guidelines and approved by the French national blood
collection institution, named “Etablissement Français
du Sang” (EFS). All healthy volunteers gave
informed consent for the collection of blood samples.
Blood samples were collected from healthy
volunteers into EDTA tubes (BD Vacutainer). Red
blood cells were first removed using a lysis buffer x
1 (EurX®, E0326-02). Following the manufacturer's
protocol, lysis buffer was added in a 1 : 4 v/v ratio
(blood/lysis buffer) and incubated for 10 min at room
Sorting Circulating Tumor Cells: A Low Flow Microfluidic Pre-Enrichment Function for Improved Separation in Serial Two-Stage Sorting
Device
165
temperature (RT) and then centrifuged at 500 × g for
10 min. After centrifugation, the supernatant,
containing lysed red blood cells, is discarded. The
WBCs, contained in the pellet, are stained with
Hoechst (1 µL/mL, blue) following the same steps as
for the MDA and MCF7 cells. The WBCs are counted
in Malassez cells at around 9.10
cells/mL. The
behaviors of the cell populations in the device were
characterized independently.
Figure 1: A) Device fabrication steps. 1) Micro-milling of
the brass mold, 2) Pouring and curing of PDMS 3)
Unmolding PDMS and 4) O
2
plasma treatment 5) bonding
on glass slide B) Picture of the brass mold C) 2D-Profil of
the spiral channel cross-section. The vertical distortion is
due to the stylus tip angle D) SEM picture of a 6
th
turn
portion and E) Picture of the final device in PDMS.
3.2 Acquisition Method
The different sample solutions have been injected in
the spiral channel with a syringe pump (DKInfusetek,
ISPLab02). Fluorescents images were recorded with
Thunder microscope (Leica Microsystems). The
fluorescence signal intensities for each bead
populations were extracted with ImageJ and
subsequently processed on MATLAB. On the
boxplots (Figure 2.B and Figure 4), the central mark
indicates the median value, and the bottom and top
edges of the box indicate the 25th and 75th percentiles
of the intensity throughout the channel width,
respectively. The whiskers extend to the most
extreme data points not considered outliers.
4 RESULTS AND DISCUSSION
4.1 Microbeads Separation
In this section, we aimed to separate the 10 µm and
15 µm bead populations into distinct, narrow streams
across the channel width. The following sections
focus on identifying the optimal conditions for
effective separation. To achieve that, we investigated
the bead trajectories at flow rates ranging from 10 to
120 mL/h.
4.1.1 Flow Rate Dependency of Bead
Positioning
Images of the spiral outlet were taken, just before the
bifurcation into two separate outlets, at various flow
rates, as depicted in Figure 2.A. Depending on the
flow rate, the beads were observed to focus into either
a single stream or two closely spaced streams.
When examining the focusing positions across the
channel width, both bead populations demonstrated
similar migration patterns (Figure
2.B), as reported in
the literature (Martel, et al. 2013) (Guan, et al., 2013).
At low flow rates (10–20 mL/h), the two bead
populations remained mixed and focused near the
channel center. As the flow rate increased, both
populations began migrating toward the inner wall of
the channel, but at different flow rates: the small 10
µm beads reached their most inner position at around
30 mL/h, while the large 15 µm beads reached this
position at higher flow rate, at around 60 mL/h. The
location of the inner equilibrium position also differs
between the two populations, with the larger beads
focusing closer to the inner wall than the smaller
ones. At even higher flow rates, both bead
populations migrated toward the outer wall of the
channel. This outward migration occurred at lower
flow rates for the 10 µm beads compared to the 15 µm
ones. By 120 mL/h, both populations have moved to
a similar position close the outer wall of the channel.
As suggested in the literature, this position may
correspond to the center of the Dean vortices (Wu, et
al., 2012).
Additionally, one can notice that at flowrate in
which the beads move through the channel section
(i.e. are not in a specific equilibrium position), the
observed focusing beam may widen or split into two
adjoining sub-beams.
BIODEVICES 2025 - 18th International Conference on Biomedical Electronics and Devices
166
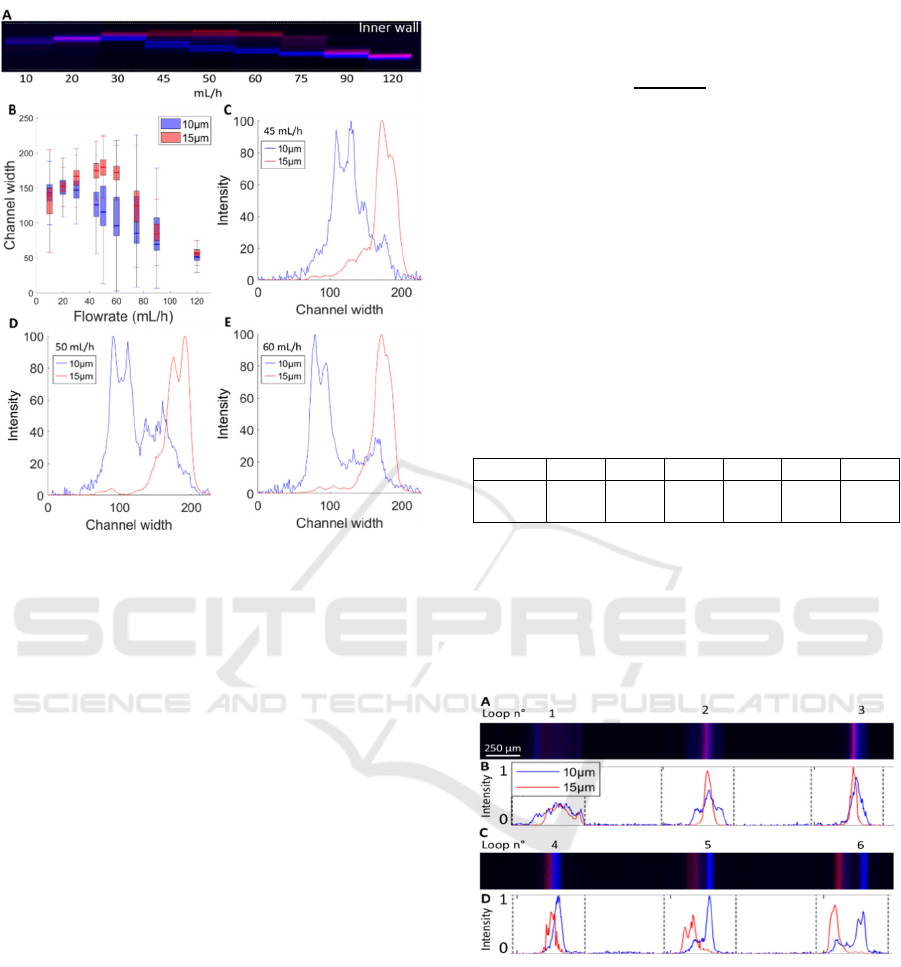
Figure 2: A) Superimposed images of the 10 µm (blue) and
15 µm (red) beads flowing through the last turn of the spiral.
B) Boxplot of the fluorescence intensity repartition in the
channel width, 0 µm being the outer wall and 250 µm the
inner one. C-E) Fluorescence intensity signal of the two
beads populations at the outlet at 45, 50 and 60 mL/h.
Since the transition of bead positions occurs at
different flow rates, we can identify the flow rates at
which the 10µm beads are positioned near the outer
wall, while the 15 µm beads remain near the inner
wall, allowing for separation. The bead streams are
separated at three flow rates: 45 mL/h, 50 mL/h and
60 mL/h. The corresponding florescent signals for
these flow rates are shown in figure 2.C-E. Most
beads in each population concentrate into a single
stream. However, some of them remain slightly
unfocused, and must be considered when determining
the optimal flow rate for separation.
The flow rate of 60 mL/h provides the best
separation, offering the largest gap between the two
populations while minimizing overlap caused by
unfocused beads.
4.1.2 Beads Focusing Along the Spiral
Beside flowrate analysis, the focusing of the beads
has also been investigated in the different turns of the
spiral. In the literature, the number of turns of the
spiral varies from 1 to 12 depending on the spiral
design. Amini et al (Amini, Wonhee, & Di Carlo,
2014) expressed the length 𝐿 required for particles to
reach their equilibrium positions:
𝐿=
𝑓
𝜋𝜇ℎ²
𝜌𝑈
𝑎²
𝑓
(𝑚)
(6
)
where 𝑈
the fluid max velocity in the channel (m/s).
To account for the shorter particle focusing distance
at high De values (typically De>17), the authors
introduces 𝑓, a scaling factor ranged from 0.2 to 1,
depending on the curving channel design, with a
value of 1 applied for lower De. For our design, at 60
mL/h, 𝐷𝑒 = 25. Using 𝑓=0.2 and according to
(6), the minimum distance for the 10 µm and 15 µm
beads to focus is 9 mm and 4 mm respectively.
According to our spiral dimensions, both populations
should be focused after the 2
nd
turn (
Table
1
).
Table 1: Length of the spiral at each turn.
Turn 1 2 3 4 5 6
Length
(mm)
4.3 13.7 26.3 42.0 60.9 82.9
Experimentally, the beads gradually focus into
their equilibrium position as they move through the
turns (Figure 3A). By the second turn, the 15 µm
beads are already tightly focused into a single stream,
whereas the 10 µm beads remain in a larger stream
(Figure 3B).
Figure 3: A-C) Picture of the beads solution flowing
throughout the turns at 60 mL/h. B-D) 10 µm (blue) and 15
µm (red) fluorescence intensity in the spiral turns from the
first one (left) to the 6
th
and last one (right).
As the beads move along the curved
microchannel, the positions of the two populations
progressively move apart, with one (15 µm) focusing
along the inner side of the channel and the other along
the opposite side, reaching maximum separation in
the final turn.
Sorting Circulating Tumor Cells: A Low Flow Microfluidic Pre-Enrichment Function for Improved Separation in Serial Two-Stage Sorting
Device
167
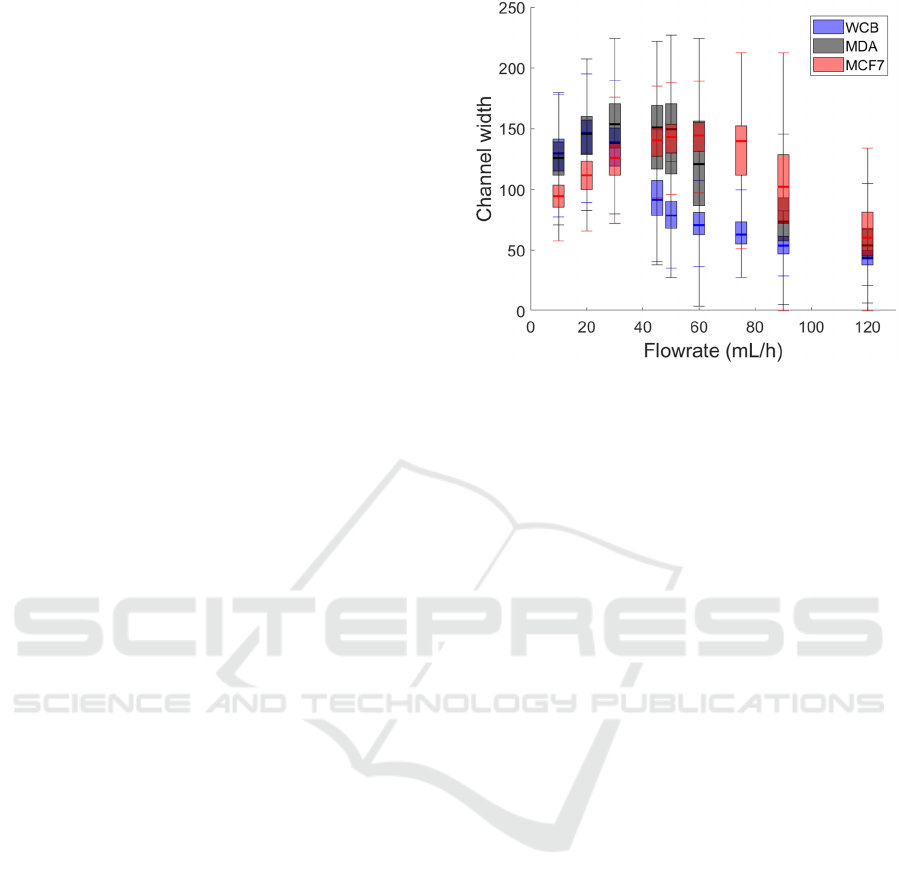
4.2 Device Performances on WBC and
Mimicking CTC
To mimic the behavior of CTCs in a microfluidic
spiral channel and investigate their separation from
WBCs, we characterized the behavior of MDA-MB-
231 cancer cells (average diameter 12-14 µm), MCF7
cancer cells (average diameter 18µm) commonly
used in the literature to mimic CTC (Macaraniag, et
al., 2023). We also circulated WBCs, whose sizes
vary significantly depending on their type, with an
average diameter ranging from 7 to 12 (Hou et al.,
2013), at flow rates ranging from 10 to 120 mL/h.
We first analyzed the lateral focusing and position
of these cells at the outlet, as shown in Figure 4. Even
if cells are deformable and vary in size (i.e., non-
monodisperse), all three cell types focused into
distinct single streams at the channel outlet across all
tested flow rates.
In terms of equilibrium positions within the
channel, all the cell types exhibited a behavior similar
to the one observed with beads. As the flow rate
increased, the cells initially migrated toward an
equilibrium position near the inner wall of the
channel and, at higher flow rates, they gradually
shifted toward the outer wall.
Interestingly, each cell type exhibited this
migration at different flow rates, correlating with
their size. WCBs reached their innermost equilibrium
position at a relatively low flow rate of around 20
mL/h, the slightly larger MDA-MB-231 cells reached
this position at approximately 45 mL/h, and the
largest ones, MCF7, focus near the inner wall at even
higher flow rates, around 60 mL/h. Notably, MDA-
MB-231 cells focused closer to the inner wall than
WBCs, consistent with the bead study findings based
on their size. While size-dependent behavior suggests
MCF7 cells would focus closer to the inner wall than
MDA, their inner position remained farther away,
likely due to the channel's spatial constraints (65 µm
height in this region). Additionally, it was observed
that the MDA cells focused in wider streams than the
other two cell populations.
Our results illustrate a clear size-dependent
behavior: smaller cells migrate toward the inner wall
at lower flow rates compared to larger cells, enabling
effective size-based cell separation. To separate
WBCs and MDA-MB-231 cells, the optimal flow rate
for maximum separation is 50 mL/h. The interquartile
distance between the two focused streams is then
approximately 22,5 µm, which is sufficient to direct
them into separate outlets at the channel exit.
Figure 4: Boxplot of the fluorescence intensity repartition
of 3 cell populations in the channel width.
This separation is even more pronounced at 60
mL/h between WBCs and MCF7 cells, given their
larger size difference. At this flow rate, MCF7 cells
remain at their innermost position, while WBCs have
already migrated outward, maintaining a 50 µm
interquartile distance. Although MCF7 cells are
commonly used to mimic CTCs due to their large
size, it is essential to consider both MCF7 and MDA-
MB-231 populations during sorting to best represent
the size diversity of the CTCs.
This size-dependent equilibrium positioning
enables the collection of different cell types based on
their distinct stream locations, ensuring efficient
separation of larger CTCs from smaller WBCs. This
isolation can be achieved with our spiral between 50
and 75mL/h, at lower flowrates than spirals in the
literature (Zhu, et al., 2024) (Akbarnataj, et al., 2023)
(Al-Halhouli, et al., 2018).
5 CONCLUSIONS
In a context of growing interest for CTC, the
combination, via a serial connection, of two
microfluidic functions (a pre-enrichment and a
sorting one) appears to be an efficient CTC sorting
strategy. This integrated approach necessitates that
the initial microfluidic system operates at low flow
rates (<100 mL/h), enabling it to function coherently
with the other microfluidic function. Our findings
demonstrate the successful development of a Dean
spiral microfluidic device that efficiently separates
particles depending on their size, in particular 10 µm
and 15 µm beads, at low flow rates. It is also effective
in sorting WBCs from mimicking CTCs in a range of
BIODEVICES 2025 - 18th International Conference on Biomedical Electronics and Devices
168

optimum flow rates of 50-75 mL/h. This sorting
function not only demonstrates efficient separation
but also operates at flow rates that are easily
compatible with immunomagnetic sorting. These
promising results suggest that this approach can be
effectively integrated with additional microfluidic
functions, to achieve high-purity, high-recovery CTC
sorting.
ACKNOWLEDGEMENTS
The authors acknowledge support staff from Nano
Lyon and ILM-Tech technological platforms. All the
staff of the CIRCAN team from the Hospices Civils
de Lyon is also gratefully acknowledged for their help
on biological expertise. The authors acknowledge
financial support from INSERM, for the PURECHIP
project, Cancer-PCSI, ITMO Cancer, and from the
doctoral school ED 160 EEA for the thesis grant of
Emma Dupont. This project, recently accredited by
Lyonbiopôle, also benefits from the newly granted
support of Cancéropôle CLARA, the Auvergne-
Rhône-Alpes Region, and Clermont Auvergne
Métropole, as part of the Proof of Concept program.
REFERENCES
Akbarnataj, K., Maleki, S., Rezaeian, M., Haki, M., &
Shamloo, A. (2023). Novel size-based design of spiral
microfluidic devices with elliptic configurations and
trapezoidal cross-section for ultra-fast isolation of
circulating tumor cells. Talenta.
Al-Halhouli, A., Al-Faqheri, W., Alhamarneh, B., Hecht,
L., & Dietzel, A. (2018). Spiral microchannels with
trapezoidal cross section fabricated by femtosecond
laser ablation in glass for the inertial separation of
microparticles. Micromachines, 9(4).
Amini, H., Wonhee, L., & Di Carlo, D. (2014). Inertial
microfluidic physics. Lab on a Chip, 14(15).
Bhagat, A. A., Kuntaegowdanahalli, S. S., & Papautsky, I.
(2008). Continuous particle separation in spiral
microchannels using dean flows and differential
migration. Lab Chip, 8, 1906–1914.
Bhagat, A. A., Kuntaegowdanahalli, S. S., Kaval, N.,
Seliskar, C. J., Papautsky, I., & e. (2010). Inertial
microfluidics for sheath-less high-throughput flow
cytometry. Biomedical Microdevices, 12, 187-195.
Castro-Giner, F., & Aceto, N. (2020). Tracking cancer
progression: from. Genome Medicine, 12(1).
CellSearch Circulating Tumor Cell. (2024, January 10).
Clinical application. (Menarini Silicon Biosystems,
Inc) Retrieved from https://www.cellsearchctc.com/
clinical-applications/mbc-clinical-trials-case-studies
Descamps, L., Le Roy, D., & Deman, A. L. (2022).
Microfluidic-Based Technologies for CTC Isolation: A
Review of 10 Years of Intense Efforts towards Liquid
Biopsy. International Journal of Molecular Sciences.
Descamps, L., Marie-Charlotte, A., Jordyn, H., Samir, M.,
Clément, A., David, B., . . . Deman, A.-L. (2021). Self-
Assembled Permanent Micro-Magnets in a Polymer-
Based. Cells.
Di Carlo, D. (2009). Inertial microfluidics. Lab on a Chip,
9(21).
Di Carlo, D., Irimia, D., Tompkins, R. G., & Toner, M.
(2007). Continuous inertial focusing, ordering, and
separation. PNAS, 104(48), 18892–18897.
Gao, W., Yuan, H., Jing, F., Wu, S., Zhou, H., Mao, H., . .
. Jia, C. (2017). Analysis of circulating tumor cells from
lung cancer patients with multiple biomarkers using
high-performance size-based microfluidic chip.
Oncotarget, 8, 12917-12928.
Guofeng Guan, Lidan Wu, Ali Asgar S. Bhagat, Zirui Li,
Peter C. Y. Chen, Shuzhe Chao, Chong Jin Ong &
Jongyoon Han. (2013). Spiral microchannel with
rectangular and trapezoidal cross-sections for size
based particle separation. Scientific Reports, 3, 1475.
Hou, H. W., Warkiani, M. E., Khoo, B. L., Li, Z. R., A, R.,
Tan, D. S.-W., . . . Lim, C. T. (2013). Isolation and
retrieval of circulating tumor. Scientific Reports, 3.
Joseph M. Martel and Mehmet Toner. (2013). Particle
focusing in curved microfluidic channels. Scientific
Reports, 3.
Krawczyk, N., Meier-Stiegen, F., Banys, M., Neubauer, H.,
Ruckhaeberle, E., & Fehm, T. (2014). Expression of
Stem Cell and Epithelial-Mesenchymal
TransitionMarkers in Circulating Tumor Cells of Breast
Cancer Patients. BioMed Research International
.
Li, Q., Wang, Y., Gao, W., Qian, G., Chen, X., & Liu, Y.
S. (2024). A microfluidic device for enhanced capture
and high activity release of heterogeneous CTCs from
whole blood. Talanta.
Macaraniag, C., Zhou, J., Li, J., Putzbach, W., Hay, N., &
Papautsky, I. (2023). Microfluidic isolation of breast
cancer circulating tumor. Electrophoresis, 1859-1867.
Man Lee, L., Klarmann, G. J., Haithcock, D. W., Wang, Y.,
Bhatt, H., Prabhakarpandian, B., . . . Lai, E. (2023).
Label-free Enrichment of Human Adipose-Derived
Stem Cells using a Continuous Microfluidic Sorting
Cascade. Lab on Chip.
Mazzitelli, C., Santini, D., Gianluca Corradini, A.,
Zamagni, C., Trerè, D., Montanaro, L., & Taffurelli, M.
(2023). Liquid Biopsy in the Management of Breast
Cancer Patients: Where Are We Now and Where Are
We Going. Diagnostics, 13, 1241.
Nian, M., Chen, B., He, M., & Hu, B. (2024). A Cascaded
Phase-Transfer Microfluidic Chip with Magnetic Probe
for High-Activity Sorting, Purification, Release, and
Detection of Circulating Tumor Cells. Analytical
Chemistry.
Nikolas H., S., Fischer, J. C., Niederacher, D., &
Terstappen, L. W. (2016). Challenges for CTC-based
liquid biopsies: Low CTC frequency and diagnostic
Sorting Circulating Tumor Cells: A Low Flow Microfluidic Pre-Enrichment Function for Improved Separation in Serial Two-Stage Sorting
Device
169

leukapheresis as a potential solution. Expert Review of
Molecular Diagnostics, 16(2), 147-164.
Qiao, Z., Xiangyu, T., Anqin, L., & Wenguang, Y. (2024).
Novel Isolating Approaches to Circulating Tumor Cell.
Micromachines.
Wu, L., Guan, G., Hou, H. W., Bhagat, A. A., & Han, J.
(2012). Separation of Leukocytes from Blood Using
Spiral Channel with. American Chemical Society,
9324-9331.
Xiang, N., Wang, J., Li, Q., Han, Y., Huang, D., & Ni, Z.
(2019). Precise Size-Based Cell Separation via the
Coupling of Inertial Microfluidics and Deterministic
Lateral Displacement. Analytical Chemistry, 91,
10328-10334.
Zhu, Z., Ren, H., Wu, D., Ni, Z., & Xiang, N. (2024). High-
throughput and simultaneous inertial separation of
tumor cells and clusters from malignant effusions using
spiral-contraction-expansion channels. Microsystems
and Nanoengineering.
BIODEVICES 2025 - 18th International Conference on Biomedical Electronics and Devices
170
