
A Green Transportation Problem for e-Commerce Deliveries
Th
´
eo Le Brun
1,2
, Marie-Jos
´
e Huguet
2
, Sandra Ulrich Ngueveu
2
and Romulus Grigoras
1
1
OneStock, Toulouse, France
2
LAAS-CNRS, Universit
´
e de Toulouse, CNRS, INP, INSA, Toulouse, France
Keywords:
Order Orchestration, Transportation Problem, e-Commerce, Sustainability.
Abstract:
To get involved in the fight against climate change, e-commerce actors should reduce the environmental impact
of their activities. For retailers, a key challenge to is identify the stock sources for fulfilling online orders. In
this paper, our goal is to orchestrate orders while minimizing the associated environmental impact. We propose
a model of Green Transportation Problem for E-commerce Deliveries (GTP-ED) which can be seen as a general
case of Fixed Charge Transportation Problem. We detail how we obtain the environmental objective function
and how we generate instances based on real world and realistic data and that good quality solutions can be
obtained quickly. Then, we show the relevance of our environmental objective function by comparing the
results with an orchestration based on minimizing the distance traveled by the parcels, which leads to a 30%
increase of environmental cost. Finally, we compare the GTP-ED with an economic approach and outline a
significant tension between our environmental and economic objectives in that context.
1 INTRODUCTION
The development of e-commerce has raised new tech-
nical and operational challenges for retailers. Every-
day, retailers have to prepare, to pack and to ship
orders to satisfy their customers, leading to billions
of deliveries all around the world. The dedicated lo-
gistics generate environmental impacts that should be
mitigated to take part in the fight against the environ-
mental crisis. In 2022, the logistics to ship the billion
of parcels delivered in France was responsible for ap-
proximately 1 MteqCO
2
(CPV Associ
´
es et al., 2023).
In few years, the e-commerce sector has become om-
nichannel, meaning that orders come from various
sales channels (websites, marketplaces, call centers...)
and can be fulfilled using any stock, including stores’
stocks. Thus, the retailers take into account a unified
stock, but this additional flexibility, very efficient to
increase sales and reduce unsold stock, raises opera-
tional issues. Among them are the stock management
and the determination of the stock location to be used
to fulfill orders. To handle these challenges, most
retailers use an Order Management System (OMS).
Based on unified stocks, the OMS informs whether
products are available to be sold online or not. Once
orders are placed through a retailer’s channel, the
OMS orchestrates and monitors the orders. Order
orchestration aims at deciding which stock location
will be chosen to ship each item for each order. Usu-
ally, retailers use dispatching rules to optimise a given
monetary cost based criteria. This paper presents an
optimization model designed to minimise the envi-
ronmental impact of order orchestration. The studied
problem is related to the Transportation Problem, in
which the goal is to minimise the distribution cost of
products from a set of sources to a set of destinations.
The remainder of this paper is organised as fol-
lows: Section 2 proposes a literature review on or-
der orchestration, transportation problems and envi-
ronmental costs over Operational Research field. Sec-
tion 3 introduces the proposed environmental objec-
tive function and formalises the problem.. In Sec-
tion 4, we expose how we obtained realistic datasets
to test our model and detail some results. We analyse
the computational performances and the relevance of
our environmental objective function. Finally, con-
clusion and future works are drawn in Section 5.
2 LITERATURE REVIEW
Order Orchestration for e-Commerce Retailers:
on order orchestration mainly focused on monetary
objective functions. The first optimisation model
for e-commerce retailers was proposed in (Xu et al.,
2009), whose aim is to orchestrate orders over a time
278
Le Brun, T., Huguet, M.-J., Ngueveu, S. U. and Grigoras, R.
A Green Transportation Problem for e-Commerce Deliveries.
DOI: 10.5220/0013162900003893
In Proceedings of the 14th International Conference on Operations Research and Enterprise Systems (ICORES 2025), pages 278-285
ISBN: 978-989-758-732-0; ISSN: 2184-4372
Copyright © 2025 by Paper published under CC license (CC BY-NC-ND 4.0)

horizon while minimizing split orders, i.e. multi-
items orders shipped from multiple stock locations.
They propose to periodically re-evaluate the orches-
tration of orders which have not been fulfilled yet.
A MILP formulation is provided, identified as a net-
work design problem where minimizing the number
of splits is equivalent to minimizing the number of
activated arcs in the network. They perform a de-
composition and a heuristic approach to solve large
scale instances. In (Acimovic and Graves, 2015) or in
(Jasin and Sinha, 2015), the goal is to determine the
optimal order fulfillment policy which minimises the
shipping costs of e-commerce retailers including an
estimate of shipping cost for future orders. They use a
MILP formulation to elaborate demand forecasts and
then propose heuristic methods to determine the op-
timal order fulfillment policy. In (Lei et al., 2018),
the authors address a problem in which retailers must
take about items pricing and orders fulfillment. The
objective is to maximize the total profits equal to
the sales profits minus the expected shipping costs.
The resulting problem is NP-hard. They propose two
heuristics which separate item pricing decisions and
order fulfillment decisions. (Cheref et al., 2018) study
an orchestration problem including fixed and variable
costs, respectively related to shipping costs and prod-
ucts costs. They use a matheuristic and provide some
performance guarantees.
Transportation Problem: The order orchestration
we consider in this paper can be related to a variant
of Transportation Problem with multiple items. We
perform below a short literature review on this prob-
lem, for a more detailed survey, we refer to (Kacher
and Singh, 2021) or (Malack
´
y and Madle
ˇ
n
´
ak, 2023).
In the Transportation Problem (TP), the goal was to
match the supplies of factories in a given product with
the demand of several cities while minimizing the
transportation cost and it was assumed that the total
supply and the total demand were equal (Hitchcock,
1941). The TP could be modeled with the following
linear program: min
∑
i, j
c
i j
x
i j
, s.t.
∑
i
x
i j
= d
j
,
∑
j
x
i j
= q
i
where x
i j
≥ 0 represent the decision
variables (amount of products from factory i to city
j), d
j
the demands, q
i
the stocks and c
i j
the costs.
As shown in (Matsui and Scheifele, 2016), lots of
efficient algorithms exist to solve the TP.
Since then, many variants appeared. (Haley, 1962)
introduces a three-dimensional TP, called Solid
Transportation Problem. For this problem, a third in-
dex is used to model several types of products which
have to be delivered and three capacity constraints
are considered. The Fixed Charge Transportation
Problem (FCTP) has also received a lot of attention.
(Balinski, 1961) introduced the FCTP as a variant
where fixed costs are added to classical variable costs.
Binary decision variables are introduced to take into
account those fixed costs. The FCTP was shown to be
NP-hard (Klose, 2008). To solve large instances in
a reasonable amount of time, (Roberti et al., 2015)
and later (Mingozzi and Roberti, 2018) proposed a
column generation scheme, which allowed them to
significantly improve the size of solved instances.
The Transportation Problem with Packing Con-
straints, is a variant of FCTP, introduced by (Flamand
et al., 2023). It takes into account variable costs
proportional to the amount of products bought at a
given supplier and fixed costs depending on the usage
of the vehicles for each path. In addition to that, they
add packing constraints, ensuring that vehicles used
between a supplier and a customer have a sufficient
capacity to carry all the goods shipped on this way.
Environmental Cost: Over the path of a parcel,
several sources of environmental impacts can be
found: transportation, handling, storage and packag-
ing (CPV Associ
´
es et al., 2023). Transportation is
the most often considered impact and may include
transportation from factories to warehouses, between
warehouses or from warehouses to customers.
In (Colissimo, 2023), the French carrier Colissimo,
describes how to compute the environmental cost of
a parcel traveling through its network. In their work,
the environmental cost corresponds to the amount of
CO
2
emitted. It includes transportation and building
impacts and depends on origin and destination zip
codes, parcel volume and parcel mass. The path of
a parcel is decomposed into several legs, and for each
one a formula is given for evaluating the environmen-
tal impact. Data are based on average data from the
previous year and include vehicle types, motorisation,
load factor etc... Regarding the building impacts, a
unit environmental cost is affected to each parcel de-
pending on previous year data.
In the literature, TP with environmental objective
function are often multi-objective with a second ob-
jective being economic. In (Shojaie and Raoofpanah,
2018), the authors add a fixed environmental cost for
each vehicle having to deliver a certain customer from
a certain supply. This cost corresponds to the vehi-
cle pollution and depends on the type of vehicle and
the pair origin-destination. In their variant of Green
Transportation Problem with Multi Objective, (Midya
et al., 2021) also consider the vehicle emissions as the
environmental cost but adopted a different measuring
strategy as they consider the cost proportional to the
amount of goods to be shipped on the given path.
A Green Transportation Problem for e-Commerce Deliveries
279

3 PROBLEM FORMULATION
In this paper, our goal is to solve the order orches-
tration faced by retailers, with a special care about
environmental impacts. Thus, we aim at providing
every item of every order, while respecting the stocks
and minimising a given environmental cost function.
More precisely, we have two specific locations, the
stock locations associated to sources and, for each or-
der, the customer delivery locations associated to des-
tinations. Our goal is to determine which stock lo-
cations can be associated with each delivery location
as in classical TP. We underline that in the problem
we consider, the routing decisions are not part of the
retailers’ scope. Indeed, in our problem, the trans-
portation from a source to a destination is ensured
by an external carrier and, is associated to a unique
link. Moreover, the orders we consider are placed
by individuals, meaning that the amounts demanded
are quite low and enforce the use of integer decision
variables. Before presenting the Mixed Integer Lin-
ear model of our problem, we focus on the considered
environmental cost function.
The Environmental Cost Function: Along the
shipping of an item, types of environmental impacts
are numerous. The environmental impacts considered
in this paper are evaluated by the amount of green-
house gases emissions, measured in g CO
2
equivalent,
whereas deliveries are also causes of pollution, waste
or resource depletion. Items leaving the Stock Loca-
tion are packed into parcels and may be gathered with
other items having the same origin and destination.
Thus, costs upstream the Stock Location are item re-
lated, while costs downstream the Stock Location, in-
cluding packaging, are parcel related. The environ-
mental impact of a shipped item can be seen as the
sum of the following elements:
• Manufacturing costs (MC
k
) caused by the manu-
facturing of item k.
• Supply costs (SuC
ks
) including all the environ-
mental impacts to store, handle and carry the item
k to the stock location s.
• Storage costs (StC
ks
) due to the functioning of
buildings used for the storage. They are related
to the item k and the stock location s.
• Packaging costs (PC
b
) due to the packaging used
to ship the item. They are proportional to the
amount of packaging required and depends on the
material used. PC
b
are related to the characteris-
tics of the chosen box b.
• Transportation costs (TC
bso
) caused by the trans-
portation of the parcel b from the stock location s
to the customer destination o through one or sev-
eral hubs. We consider K
bso
the set of items sent
from the stock location s to the customer location
for order o in a box b, m
k
the mass of an item k and
M
b
and V
b
the mass and volume of a box b. Then,
we use the formula provided by Colissimo (Col-
issimo, 2023) to compute the transportation costs.
TC
bso
= EV
so
× V
b
+ EM
so
× (M
b
+
∑
k∈K
bso
m
k
),
where EV
so
and EM
so
are two emission factors
proportional to the volume and to the mass respec-
tively. EV
so
and EM
so
are specific to each path
(from stock location to customer) and depend on
the distance covered, the vehicle type and the fuel
used by the carrier.
• Handling costs (HC
bso
) due to sorting and han-
dling along the transportation leg. They are re-
lated to the origin s and destination o and to the
parcels b to be handled.
• Consumer Travel costs (CTC
o
) due to the travel
of customers to pick up their parcel (equals 0 in
case of Home Delivery). They are fixed costs de-
pending on the customer’s distance and mean of
transportation.
Order orchestration is only about assigning items to
stock location. Thus, for the remaining of the pa-
per, Manufacturing and Consumer Travel costs are
not taken into account in the objective function. In-
deed, they can be considered as non-decisionary fixed
costs as the same amount has to be added no matter
the decisions taken. Moreover, the measure of the en-
vironmental cost requires information about parcels
to be shipped. In particular, the Transportation costs
formula to compute TC
bso
requires the volume and
the mass of the parcel. We chose this formula as it
is used by a major carrier. Among the drawbacks we
identified, the requirement for the parcel volume was
the most detrimental. Indeed, it implies to determine
the volume of the parcel depending on the items to
be shipped. This problem is close to the well-know
NP-hard 3D-Bin Packing Problem (Martello et al.,
2000). We chose to simplify the computation of the
parcels volume by simply requiring the total volume
of parcels shipped to be higher than the total volume
of items to be shipped. This method can be used for
a retailer sending clothes for example. However, to
avoid products jamming, a small margin on the vol-
ume of the parcel is considered.
Resulting MILP - Green Transportation Problem
for e-Commerce Deliveries (GTP-ED): Our Green
Transportation Problem for E-commerce Deliveries,
denoted by GTP-ED, can be seen as a variant of a
Fixed-Charge Transportation Problem (FCTP) that
ICORES 2025 - 14th International Conference on Operations Research and Enterprise Systems
280

includes an environmental cost function. The stock
locations of items correspond to sources of the TP.
Also, a unique delivery location is associated to each
customer order. Thus the orders correspond to their
respective delivery point, that are the destinations of
the TP. Let us consider O the set of orders, K the
set of items, S the set of stock locations and B the
set of boxes. We denote by d
ko
the demand in item
k for order o and by q
ks
the stock for item k in stock
location s. Let v
k
be the volume of an item k and
V
b
the volume of a box b. The model of the GTP-ED is:
(GTP-ED) min F
G
=
∑
s∈S
∑
o∈O
(
∑
k∈K
I
kso
x
kso
+
∑
b∈B
P
bso
y
bso
) (1)
∑
s∈S
x
kso
= d
ko
∀k ∈ K , ∀o ∈ O (2)
∑
o∈O
x
kso
≤ q
ks
∀k ∈ K , ∀s ∈ S (3)
∑
b∈B
y
bso
V
b
− α
∑
k∈K
x
kso
v
k
≥ 0 ∀s ∈ S , ∀o ∈ O (4)
x
kso
∈ N ∀k ∈ K , ∀s ∈ S, ∀o ∈ O (5)
y
bso
∈ N ∀b ∈ B, ∀s ∈ S, ∀o ∈ O (6)
where x
kso
is an integer variable (Constraints (5)) ac-
counting for the number of items k used from the
stock location s to fulfill the order o and y
bso
is an inte-
ger variable (Constraints (6)) representing the number
of boxes b sent from the stock location s to the des-
tination of order o. Let us notice that decision vari-
ables are chosen as integers and unbounded but sim-
ple upper bounds can be found. Indeed, the number
of items k to be sent from a stock location s can nei-
ther be higher than the stocks q
ks
of item k in location
s nor than the demand d
ko
of order o for item k, i.e.,
∀k ∈ K , s ∈ S, o ∈ O, x
kso
≤ min(d
ko
, q
ks
). Then, for
each order o, the maximum number of boxes of type
b is lower than the number of boxes b required to get
more space than the total volume required for the or-
der o, i.e., ∀b ∈ B, s ∈ S, o ∈ O, y
bso
≤ ⌈
α
∑
k∈K
d
ko
v
k
V
b
⌉.
Constraints (2) ensure that demands are fulfilled,
Constraints (3) ensure that stocks are not exceeded
and Constraints (4) ensure that the total volume of
parcels shipped from a stock location s to the desti-
nation of order o is higher than the total volume of
items to be shipped on this path with a margin coeffi-
cient α ≥ 1.
The Objective (1) of the GTP-ED is to minimise the
environmental cost, denoted F
G
and expressed in
geqCO
2
, which can be decomposed into item related
costs and parcel related costs. Item related costs I
kso
correspond to the cost of sending one item k from the
stock location s to the destination of order o and are
equal to I
kso
= SuC
ks
+ StC
ks
+ EM
so
m
k
with SuC
ks
the cost caused by the supply of an item k to the
stock location s, StC
ks
the cost of storing one item
k in the stock location s, EM
so
the mass transporta-
tion cost over the path (so) and m
k
the mass of an
item k. Parcel related costs P
bso
correspond to the
cost of sending one box of size b from the stock lo-
cation s to the destination of order o and are equal to
P
bso
= PC
b
+HC
bso
+EV
so
V
b
+EM
so
M
b
with PC
b
the
cost due to packaging of a box of size b, HC
bso
the
cost for handling a box of size b over the path (so),
EV
so
the volumetric transportation cost over the path
(so), EM
so
the mass transportation cost over the path
(so) and M
b
the mass of a box b.
This resulting model can be proven to be NP-hard. In-
deed, under the hypothesis H
1
: |B| = 1, H
2
: |K | = 1
and H
3
:
V
b
αv
k
≥ max
o∈O
d
ko
, the GTP-ED becomes an
integer version of the FCTP, known as NP-hard.
To scale-up when solving the GTP-ED, the initial set
of orders can be decomposed into subsets of orders
which can be solved independently. Let us consider
a multi-graph G = (V , E). The set of nodes corre-
sponds to the set of orders i.e. V = O. For each
pair of node (o, o
′
), an edge is drawn between o
and o
′
for each item k demanded in both orders, i.e.
d
ko
≥ 1 and d
ko
′
≥ 1. Each connected component of
graph G corresponds to a subset of independent or-
ders on which GTP-ED can be solved independently
without loss of optimality. Such decomposition was
also considered in (Xu et al., 2009) through a graph
based on items instead of graph based on orders.
4 EXPERIMENTS
In this section, we start by describing the datasets
used and the experimental setup. Then we detail the
results obtained and provide an analysis to identify
trends and future work.
4.1 Datasets
Based on the literature review, we did not find pub-
lic datasets related to our problem. So, we create our
own datasets to evaluate our contribution. The first
dataset is based on a real retailer anonymised oper-
ating in France, while the second dataset
1
was ran-
domly generated using realistic hypothesis.
1
data2 is publicly available on https://gitlab.laas.
fr/chaire-retail-responsable/gtped
A Green Transportation Problem for e-Commerce Deliveries
281

Dataset Based on Real Data. This dataset (data1)
is based on average characteristics of a fashion omni-
chanel retailer operating in France. We consider
100 orders that were randomly selected from past
anonymised orders (we fixed |O| = 100 based on
preliminary experiments on the limit of the MILP
solver). With the selected orders, we then have a
number of associated items (|K | = 244) and a num-
ber of stock locations (|S| = 135) where these items
are available. The demand in items for each order and
the stock level for each item in every stock location is
based on average real data.
Dataset Based on Realistic Randomized Genera-
tion. This generated dataset (data2) is similar to
data1 based on real data. First, we consider the same
value for the set of orders, items and stock locations:
|O| = 100, |K | = 244 and |S| = 135. The geographi-
cal coordinates of stock locations and destinations of
orders are randomly generated following a uniform
law U(−4, 8) for the longitude and a U(42, 51) for
the latitude. To generate demands and stocks, we re-
spected the orders of magnitude observed in the real
data. For each order o, we first generate a number
n
o
of items such that n
o
= max(1, ⌊N (2, 4)⌋) (where
N stands for the normal law). Then, we perform n
o
draws with replacement to determine the items which
have been ordered. For each item and stock loca-
tion, the stock level is generated using a uniform law:
∀k, s q
ks
∼ U({0, 1, 2, 3, 4, 5}). Whereas it is theoreti-
cally possible to get an unfeasible problem due to lack
of stocks, it never occurred in our experiments.
Additional Data. For each dataset, we have to gen-
erate some additional data for parcels and for cost
parameters. Based on French carrier data (available
on public web site), we fixed the number of boxes
(B = 6) and obtained their characteristics (size, mass
and volume). All the cost values were obtained from
different sources. Items volume and mass were ran-
domly generated but in a way to obtain realistic values
for the fashion industry. Storage Costs, Supply Costs
and Handling Costs, relies on a report about environ-
mental impacts of e-commerce (CPV Associ
´
es et al.,
2023). The values are randomly generated so as to re-
spect the orders of magnitude provided in the report.
All details about the generation of these parameters
are publicly available (see footnote 1).
4.2 Experimental Setup
For each dataset, made of 100 orders, we build several
subsets from 10 to 100 orders with their respective
numbers of items and stock locations. To do that, we
successively consider the orders of the initial dataset
(the 10-order instance corresponds to the first 10 or-
ders in the initial dataset, and so on). For each sub-
set of data (from 10 to 100 orders), we first generate
values for stocks, demands and boxes. Then, we ran-
domly generate 10 instances by changing the values
for items masses, items volumes and costs. We used
Julia 1.10 and CPLEX 20.1 (in single thread mode)
for the implementation of the mathematical model of
all MILP models. The experiments ran on a server
with a Intel E5-2695 v4 2.1G processor. Finally,
16GB of RAM and 1h of solving time were allocated
to each instance.
4.3 Computational Results and Analysis
We present the results of the experiments which have
been performed to test and analyse the GTP-ED. We
first detail the computational performances of the
model and then analyse the relevance of the envi-
ronmental objective comparatively to other objective
functions. In this paper, we only present the results
for data1, however more complete results are publicly
available (see footnote 1).
Performances Analysis. Firstly, we looked at the
performances of our MILP model for the GTP-ED. Ta-
ble 1 presents the computation time (CPU), the gap at
root node (RG), the final gap (FG) and the number of
instances optimally solved for data1. For each size of
instance, we provide the mean, denoted as µ, and the
standard deviation, denoted as σ, observed over the
10 instances of the set for CPU, RG and FG.
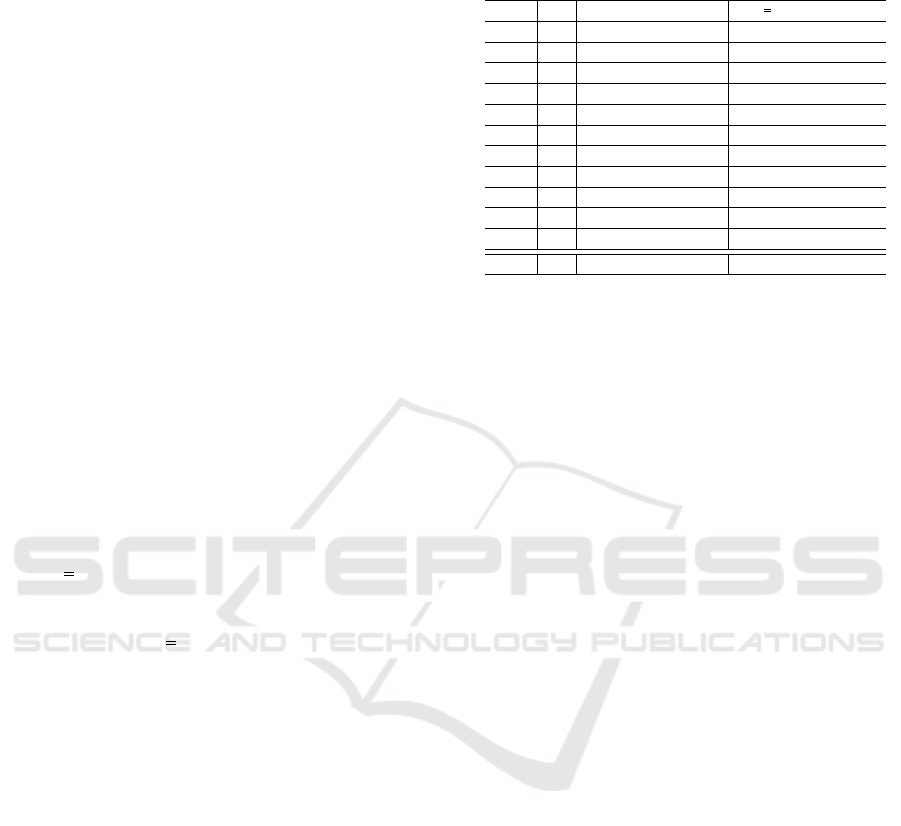
Table 1: Performance computational results - data1.
data1
CPU(s) RG(%) FG(%) #Opt
/ 10
|O| µ σ µ σ µ σ
10 2.5 0.8 4.9 1.5 0.0 0.0 10
20 6.3 1.2 4.8 1.8 0.0 0.0 10
30 10.3 1.4 3.0 1.7 0.0 0.0 10
40 25.0 6.9 3.1 2.3 0.0 0.0 10
50 406.6 1069.6 2.8 0.6 0.1 0.1 9
60 413.2 1068.2 2.3 0.5 0.0 0.1 9
70 2784.5 1383.3 2.6 0.5 0.1 0.2 4
80 2695.1 1467.7 2.7 0.4 0.3 0.3 3
90 2116.7 1579.5 2.4 0.3 0.3 0.3 5
100 3395.8 738.9 2.5 0.4 0.3 0.2 1
In terms of computing time, solving small size
instances is quite fast as the mean solving time is
less than 30 seconds for instances up to 40 orders for
data1 and up to 20 for data2. Larger instances require
much more computing time and lots of them reach the
ICORES 2025 - 14th International Conference on Operations Research and Enterprise Systems
282

one hour time limit. Indeed, for both datasets, solv-
ing to optimality large instances is difficult. Less than
half instances above 70 orders are optimally solved
for data1 and no instance above 50 orders are opti-
mally solved for data2. Those results tend to confirm
that the GTP-ED is hard to solve. However, we still
notice that good quality solutions are obtained as the
mean FG is always lower than 2% with low standard
deviation. The RG confirms the ability to quickly get
good quality solutions as for large instances the mean
is most often lower than 5% with a low standard devi-
ation. We notice two exceptions for instances of size
30 and 70 for data2, where one instance is observed to
have a huge RG. Besides, we observe significant dif-
ferences in terms of performance between data1 and
data2. The generation of stocks data may be part of
the explanation. Indeed, we chose a uniform law to
generate stocks for data2, while in data1, averaged
on real data, empty stocks seem to appear more often.
From an operational point of view, retailers could
prefer good quality solutions quickly obtained to or-
chestrate orders during working days to prevent from
stock changes due to physical store sales. Neverthe-
less, retailers may appreciate optimal solutions to or-
chestrate orders placed during nights and week-ends
when time is less constraining.
To improve the scalability of our problem, we used
the decomposition presented at the end of the section
3. It actually helps to improve the resolution as about
10% more instances are solved to optimality after one
hour. Besides, for instances solved to optimality, the
savings in terms of CPU are significant, about two
times faster in average for both datasets.
Objectives Analysis. In the GTP-ED, we consider a
new objective function which requires lots of param-
eters and data. Such complexity was justified to mea-
sure an overall environmental cost. However, we still
need to justify the relevance of this objective function
in the optimisation process. To do so, we compare the
results obtained on GTP-ED with two other optimisa-
tion problems.
The first problem is the Distance Transportation Prob-
lem for E-commerce Deliveries (DTP-ED). In this
problem, we want to minimise the total distance trav-
eled by the parcels subject to the same constraints as
for the GTP-ED. This problem can be seen as a simple
way to reduce the overall environmental cost by re-
ducing the number of kilometers traveled. The model
is given hereafter with D
so
representing the Haversine
distance (in km) between the stock location s and the
destination of the order o :
(DTP-ED) min F
D
=
∑
s∈S
∑
o∈O
D
so
∑
b∈B
y
bso
(7)
s.t. (2) − (6)
To compare the solutions of GTP-ED and DTP-ED, we
solve both problems and collect the results for the in-
stances solved to optimality after one hour, respec-
tively F
∗
G
, (x
∗
G
, y
∗
G
) and F
∗
D
, (x
∗
D
, y
∗
D
). After solving
DTP-ED we perform a post processing on y
∗
D
variables.
Indeed, the solver tends to select the largest boxes
even if smaller ones are sufficient. Thus, for each
pair (so) we keep the number of boxes assigned by
the solvers but perform an optimisation to select the
best ones.
Then, we compute:
• ∆G(DTP-ED) = F
G
(x
∗
D
, y
∗
D
) − F
∗
G
, the surplus of
environmental cost obtained with the optimal so-
lutions of DTP-ED
• ∆D(GTP-ED) = F
D
(x
∗
G
, y
∗
G
) − F
∗
D
, the additional
distance obtained with the optimal solutions of
GTP-ED
Table 2 compares the results obtained on the prob-
lems GTP-ED and DTP-ED for optimally solved in-
stances of data1. The first column (|O|) indicates the
size of the instance and the second column (#) the
number of instances optimally solved for both prob-
lems. The third column F
∗
G
shows the optimal envi-
ronmental cost when solving GTP-ED. The fourth col-
umn ∆G(DTP-ED) shows the surplus of environmental
cost for solutions of DTP-ED. Similarly, the fifth col-
umn, F
∗
D
, shows the optimal distance obtained while
solving DTP-ED and the sixth column, ∆D(GTP-ED),
indicates the surplus of distance induced by GTP-ED.
Table 2: Objective comparison between GTP-ED and
DTP-ED - data1.
F
G
(kg eqCO2) F
D
(1000km)
|O| # F
∗
G
∆G(DTP-ED) F
∗
D
∆D(GTP-ED)
10 10 27.3 +8.9 8.7 +9.7
20 10 46.9 +14.9 18.0 +25.1
30 10 67.9 +21.4 27.6 +36.0
40 10 99.5 +31.9 41.4 +39.1
50 9 110.2 +36.0 47.6 +50.1
60 10 136.6 +44.4 67.0 +69.6
70 8 122.9 +41.0 63.0 +61.6
80 6 101.6 +33.1 50.5 +49.4
90 6 108.1 +35.6 58.2 +53.7
100 4 80.9 +25.4 42.9 +42.7
Total 83 902.0 +292.6 436.9 +424.8
From this table, we can observe that using DTP-ED
to solve the 83 instances of data1 increases the en-
vironmental cost by 32% compared to using the
A Green Transportation Problem for e-Commerce Deliveries
283
GTP-ED. In the same way, this rise is about 28% for
data2. Consequently, the savings offered by GTP-ED
compared to a more basic model are significant and
highlight its relevance from an environmental point
of view. However, the environmental gains of the
GTP-ED are accompanied by a significant increase in
terms of logistics flows and kilometers traveled. In-
deed, the solutions of GTP-ED almost double the total
distance compared to the solutions of DTP-ED. This
can be explained by the measurement of the environ-
mental cost that does not only rely on transportation
costs, which themselves do not only depend on dis-
tance traveled but are driven by the volume of parcels
carried. Thus, our objective function proposed in the
GTP-ED seems to be relevant from an environmental
point of view.
Furthermore, the objective functions used opera-
tionally are most of the time monetary related. Thus,
our objective function should be evaluated from an
economic point of view. For this purpose, we intro-
duce a third optimisation problem called Economic
Transportation Problem for E-commerce Deliveries
(ETP-ED) whose aim is to minimise the economic
costs. As many carriers charge a fixed price per parcel
collected, the economic cost we consider is propor-
tional to the number of parcels shipped. In our case,
we assume that the collection price of each parcel is
set at 1C. The model of the ETP-ED is given here-
after, with M
so
= 0 if o is a Click and Collect order
whose pick-up location is s (no parcel collected from
the carrier), M
so
= 1 C otherwise:
(ETP-ED) min F
E
=
∑
s∈S
∑
o∈O
M
so
∑
b∈B
y
bso
(8)
s.t. (2) − (6)
As done previously, we solve GTP-ED and ETP-ED
to collect F
∗
G
, (x
∗
G
, y
∗
G
) and F
∗
E
, (x
∗
E
, y
∗
E
) Then, we per-
form the same post-processing on y
∗
E
as the one ex-
posed for y
∗
D
and then compute :
• ∆G(ETP-ED) = F
G
(x
∗
E
, y
∗
E
) − F
∗
G
, the surplus of
environmental cost obtained with the optimal so-
lutions of ETP-ED
• ∆E(GTP-ED) = F
E
(x
∗
G
, y
∗
G
) − F
∗
E
, the surplus of
economic cost obtained with the optimal solutions
of DTP-ED
The objective comparison between GTP-ED and
ETP-ED are given in Table 3 for data1. The first, sec-
ond and third columns are same as the ones of Ta-
ble 2. The fourth column shows, ∆G(ETP-ED), the
surplus of environmental cost obtained while solv-
ing the ETP-ED. The fifth column shows F
∗
E
the opti-
mal economic cost and the sixth column, ∆E(GTP-ED)
indicates the surplus of economic cost induced by
GTP-ED.
Table 3: Objective comparison between GTP-ED and
ETP-ED - data1.
F
G
(kgeqCO2) F
E
(C)
|O| # F
∗
G
∆G(ETP-ED) F
∗
E
∆E(GTP-ED)
10 10 27.3 +18.7 90.0 +126.0
20 10 46.9 +32.9 182.0 +213.0
30 10 67.9 +47.1 270.0 +315.0
40 10 99.5 +64.6 343.0 +428.0
50 9 110.2 +75.3 391.0 +487.0
60 10 136.6 +91.4 491.0 +619.0
70 8 122.9 +79.0 468.0 +544.0
80 6 101.6 +64.5 383.0 +444.0
90 6 108.1 +68.5 429.0 +438.0
100 4 80.9 +48.2 313.0 +353.0
Total 83 902.0 +590.3 3360.0 +3967.0
From the table, we can see that ETP-ED induces
a 65% surplus of environmental cost over the 83 in-
stances of data1. This surplus rises to 70% over the
43 instances of data2. Once again, the GTP-ED proves
its relevance from an environmental point of view. In
parallel, GTP-ED causes a significant economic cost
rise. We observe a 118% increase for data1 and a
68% increase for data2. As it could have been ex-
pected, our environmental and economic objectives
seem to be in opposition. If retailers want to operate
an eco-friendly order orchestration with the GTP-ED,
they would have to pay additional fees. Besides, by
favouring economic costs in a context where the pric-
ing depends only on the number of parcels shipped,
they renounce to reduce their environmental footprint.
However, the considered economic function F
E
is
only based on the number of collected parcels. By
integrating other parameters, such as fuel expenses or
volume to be carried, it may lead to different trade-
offs.
5 CONCLUSION
In this paper, we introduce the Green Transportation
Problem for E-commerce Deliveries which aims at
minimizing the environmental footprint of order or-
chestration. The resulting model is a general case of
the well-known Fixed Charge Transportation Problem
with an environmental objective function. We per-
form a few experiments to test the performances of
the GTP-ED and the relevance of its objective function.
We see that the solver struggles to solve to optimal-
ity instances above 60 orders in a reasonable amount
of time, whereas good quality solutions are provided
quickly. We highlight that the performances are im-
proved by decomposing the model into subsets of in-
dependent orders. Then, we show that our GTP-ED
is relevant from an environmental point of view com-
ICORES 2025 - 14th International Conference on Operations Research and Enterprise Systems
284

pared to a simpler orchestration strategy based on dis-
tance minimisation. However, in a context where
the pricing depends only on the number of parcels
shipped, the GTP-ED causes an increase of economic
costs that enforces retailers to favour either environ-
mental matters or economic ones.
Future works include additional experiments to
deeper analyse parameters influence. First, we expect
the stocks level and the number and types of boxes
to impact the performances and results. Secondly, the
GTP-ED uses a complex objective function with dif-
ferent terms and we will explore their interactions.
Lastly, it would be interesting to compare the results
of the GTP-ED with real world orchestration rules used
by retailers. It can highlight the environmental rel-
evance of our model but also reveal its deficiencies
from an operational point of view.
Finally, our model can be improved to gain in rel-
evance and scalability. To solve larger instances to
optimality, we aim to develop decomposition meth-
ods such as column generation. Moreover, as re-
tailers would probably prefer quick good solutions
rather than slow but optimal ones, using heuristics or
Lagrangian decomposition may be relevant. Lastly,
rather than opposing environment and economy, a
multi-objective optimisation should be performed to
provide a tool to retailers to make the best trade-off
between environmental and economic issues.
ACKNOWLEDGEMENTS
This work has been supported by OneStock and the
Responsible Retail Chair (Chaire, 2024).
REFERENCES
Acimovic, J. and Graves, S. C. (2015). Making better ful-
fillment decisions on the fly in an online retail envi-
ronment. Manufacturing & Service Operations Man-
agement, 17(1):34–51.
Balinski, M. L. (1961). Fixed-cost transportation problems.
Naval Research Logistics Quarterly, 8(1):41–54.
Chaire (2024). Chaire de formation et de recherche
retail responsable. https://sites.laas.fr/projects/
ChaireRetailResp/ [Accessed : 16-12-2024].
Cheref, A., Artigues, C., H
´
ebrard, E., Lopez, P., Charvillat,
V., R
´
egent, Y., and Ngueveu, S. U. (2018). Algorithme
d’approximation pour un probl
`
eme d’affectation
d’une commande multiproduit multifournisseur. In
12
`
eme Conf
´
erence Internationale de MOd
´
elisation,
Optimisation et SIMulation (MOSIM 2018), page 7p.
Colissimo (2023). Colissimo box – CO2 calculator.
CPV Associ
´
es, GSV Communication, and RDC Environ-
ment (2023). Commerce en ligne - impacts envi-
ronnmentaux de la logistique, des transports et des
d
´
eplacements :
´
etat des lieux, outil d’
´
evaluation et
pistes de progr
`
es. Report.
Flamand, T., Iori, M., and Haouari, M. (2023). The trans-
portation problem with packing constraints. Comput-
ers & Operations Research, 157:106278.
Haley, K. (1962). New methods in mathematical program-
ming—the solid transportation problem. Operations
research, 10(4):448–463.
Hitchcock, F. L. (1941). The distribution of a product from
several sources to numerous localities. Journal of
mathematics and physics, 20(1-4):224–230.
Jasin, S. and Sinha, A. (2015). An lp-based correlated
rounding scheme for multi-item ecommerce order ful-
fillment. Operations Research, 63(6):1336–1351.
Kacher, Y. and Singh, P. (2021). A comprehensive litera-
ture review on transportation problems. International
Journal of Applied and Computational Mathematics,
7:1–49.
Klose, A. (2008). Algorithms for solving the single-sink
fixed-charge transportation problem. Computers &
Operations Research, 35(6):2079–2092.
Lei, Y., Jasin, S., and Sinha, A. (2018). Joint dynamic
pricing and order fulfillment for e-commerce retail-
ers. Manufacturing & Service Operations Manage-
ment, 20(2):269–284.
Malack
´
y, P. and Madle
ˇ
n
´
ak, R. (2023). Transporta-
tion problems and their solutions: literature re-
view. Transportation Research Procedia, 74:323–
329. TRANSCOM 2023: 15th International Scientific
Conf. on Sustainable, Modern and Safe Transport.
Martello, S., Pisinger, D., and Vigo, D. (2000). The three-
dimensional bin packing problem. Operations re-
search, 48(2):256–267.
Matsui, T. and Scheifele, R. (2016). A linear time algorithm
for the unbalanced hitchcock transportation problem.
Networks, 67(2):170–182.
Midya, S., Roy, S. K., and Yu, V. F. (2021). Intuitionistic
fuzzy multi-stage multi-objective fixed-charge solid
transportation problem in a green supply chain. In-
ternational Journal of Machine Learning and Cyber-
netics, 12:699–717.
Mingozzi, A. and Roberti, R. (2018). An exact algorithm
for the fixed charge transportation problem based on
matching source and sink patterns. Transportation
Science, 52(2):229–238.
Roberti, R., Bartolini, E., and Mingozzi, A. (2015). The
fixed charge transportation problem: An exact algo-
rithm based on a new integer programming formula-
tion. Management Science, 61(6):1275–1291.
Shojaie, A. A. and Raoofpanah, H. (2018). Solving a two-
objective green transportation problem by using meta-
heuristic methods under uncertain fuzzy approach.
Journal of Intelligent & Fuzzy Systems, 34(1):1–10.
Xu, P. J., Allgor, R., and Graves, S. C. (2009). Benefits
of reevaluating real-time order fulfillment decisions.
Manufacturing & Service Operations Management,
11(2):340–355.
A Green Transportation Problem for e-Commerce Deliveries
285
