
Synthesizing Annotated Cell Microscopy Images with Generative
Adversarial Networks
Duway Nicolas Lesmes-Leon
1,2 a
, Miro Miranda
1,2 b
, Maria Caroprese
3 c
, Gillian Lovell
3 d
,
Andreas Dengel
1,2 e
and Sheraz Ahmed
2 f
1
Department of Computer Science, University of Kaiserslautern-Landau (RPTU), Kaiserslautern, Germany
2
German Research Center for Artificial Intelligence (DFKI), Kaiserslautern, Germany
3
Sartorius, Royston, U.K.
Keywords:
Cell Microscopy, GAN, Generative AI, Instance Segmentation.
Abstract:
Data scarcity and annotation limit the quantitation of cell microscopy images. Data acquisition, preparation,
and annotation are costly and time-consuming. Additionally, cell annotation is an error-prone task that re-
quires personnel with specialized knowledge. Generative artificial intelligence is an alternative to alleviate
these limitations by generating realistic images from an unknown data probabilistic distribution. Still, extra
effort is needed since data annotation remains an independent task of the generative process. In this work, we
assess whether generative models learn meaningful instance segmentation-related features, and their potential
to produce realistic annotated images. We present a single-channel grayscale segmentation mask pipeline that
differentiates overlapping objects while minimizing the number of labels. Additionally, we propose a modified
version of the established StyleGAN2 generator that synthesizes images and segmentation masks simultane-
ously without additional components. We tested our generative pipeline with LIVECell and TissueNet, two
benchmark cell segmentation datasets. Furthermore, we augmented a segmentation deep learning network
with synthetic samples and illustrated improved or on-par performance compared to its non-augmented ver-
sion. Our results support that the features learned by generative models are relevant in the annotation context.
With adequate data preparation and regularization, generative models are capable of producing realistic anno-
tated samples cost-effectively.
1 INTRODUCTION
Cell microscopy enables researchers to observe cells
that are invisible to the naked eye, advancing biology
and medicine by improving the understanding of cel-
lular mechanisms essential for diagnosing and treat-
ing diseases. Various microscopy techniques high-
light specific cellular features, allowing for comple-
mentary studies.
Despite their utility, cell microscopy faces two
major challenges: data acquisition and processing.
Data acquisition is complicated by the need to main-
tain specific environmental conditions for cell sur-
vival, leading to higher preservation costs. Rare or
difficult-to-produce cell types and labeling methods
a
https://orcid.org/0009-0007-4677-7105
b
https://orcid.org/0009-0002-8195-9776
c
https://orcid.org/0009-0009-2170-1459
d
https://orcid.org/0009-0004-5180-9704
e
https://orcid.org/0000-0002-6100-8255
f
https://orcid.org/0000-0002-4239-6520
like fluorescence can risk sample perturbation. Prepa-
ration techniques, such as staining, often require fixa-
tion and permeabilization, which limits further analy-
sis.
Deep learning (DL) provides potential solutions
to these challenges. Generative AI (GenAI), a sub-
set of AI focused on producing synthetic data, lever-
ages models such as variational autoencoders (VAEs)
(Kingma and Welling, 2014), generative adversarial
networks (GANs) (Goodfellow et al., 2014), and dif-
fusion models (Nichol and Dhariwal, 2021) to learn
data distributions and create realistic synthetic data.
Research has demonstrated GenAI’s potential in gen-
erating synthetic microscopy images, although much
of it focuses on unannotated data.
Annotating synthetic is a resource-intensive, time-
consuming and error-prone process, even with manual
curation from experts. DL-based alternatives now fa-
cilitate annotation tasks, with instance segmentation
being the most common approach, assigning a label to
each pixel to differentiate individual objects (Sharma
et al., 2022).
592
Lesmes-Leon, D. N., Miranda, M., Caroprese, M., Lovell, G., Dengel, A. and Ahmed, S.
Synthesizing Annotated Cell Microscopy Images with Generative Adversarial Networks.
DOI: 10.5220/0013163200003890
In Proceedings of the 17th International Conference on Agents and Artificial Intelligence (ICAART 2025) - Volume 3, pages 592-599
ISBN: 978-989-758-737-5; ISSN: 2184-433X
Copyright © 2025 by Paper published under CC license (CC BY-NC-ND 4.0)

Typical data generation pipelines involve two
models: one to generate images and another to pro-
duce annotations. Some methods reverse this order,
generating annotations first (Han et al., 2018). How-
ever, both approaches increase training complexity.
Recent studies suggest that generating realistic im-
ages can inherently teach features necessary for ac-
curate annotations, as object size, shape, and distri-
bution are shared requirements for both (Abdal et al.,
2021).
Several models address these challenges. ISING-
GAN (Dimitrakopoulos et al., 2020) generates cell
microscopy images alongside binary masks, while
Devan et al. (Shaga Devan et al., 2021) trained a
GAN to produce labeled herpesvirus images. Out-
side cell microscopy, methods like Labels4Free (Ab-
dal et al., 2021) and SatSynth (Toker et al., 2024) pro-
duce images and segmentation masks without addi-
tional training. However, to the best of our knowl-
edge, there is not a method to generate both images
and instance segmentation masks simultaneously for
cell microscopy data.
Cell microscopy often involves densely packed,
repetitive objects, where binary and semantic seg-
mentation fail due to object overlap. This study
investigates whether GenAI can produce instance-
segmented images without relying on additional net-
works or regularization methods. Using StyleGAN2
(Karras et al., 2020b), a well-established GAN archi-
tecture with benchmarks on cell microscopy datasets
(Dee et al., 2023) (Mascolini et al., 2022), our results
demonstrate that generative models can create anno-
tated data with minimal additional effort.
2 MATERIALS AND METHODS
2.1 Datasets
2.1.1 LIVECell
The LIVECell (LCell) dataset (Edlund et al., 2021)
is a monoculture phase-contrast microscopy dataset
consisting of high-resolution images from eight cell
types (A172, BT-474. BV-2, Huh7, MCF7, SH-
SY5Y, SkBr3, and SK-OV-3) designed to train deep
learning instance segmentation models. It contains
1,310 images of 1, 408 × 1, 040 resolution, resulting
in more than 1.6 million annotated cells. Experienced
biologists oversaw both segmentation and assessment
to ensure high-quality, fully annotated images. More-
over, LCell images were taken every four hours from
the samples to capture the cell morphology and pop-
ulation density variability through time.
2.1.2 TissueNet
The TissueNet dataset (Greenwald et al., 2022) is
a monoculture, fluorescence microscopy dataset cre-
ated to train robust, general-purpose segmentation
networks. The authors gathered the data from dif-
ferent sources, such as published and unpublished
datasets from different institutions, comprising six
platforms, three species, and both healthy and dis-
eased tissues. In contrast to the LCell experiments,
we used tiles of size 256 × 256 and nuclei annota-
tions for all experiments with the TissueNet dataset,
to train on images without any black regions. Our
training split is composed of images from the breast,
colon, esophagus, lymph node metastasis, pancreas,
and tonsil tissues. Each image must have at least 256
pixels in width and height to ensure an effective tiling
during training, comprising a total of 2,376 training
images.
2.2 Data Preparation
Representing imaging information is more complex
than textual data. The LCell dataset uses COCO
format (Lin et al., 2014) for segmentation annota-
tions, a text-based representation incompatible with
traditional GANs designed for image generation.
Conversely, TissueNet employs single-object binary
masks, resulting in variable-channel output when gen-
erating a binary mask for each object. Furthermore,
densely populated cell microscopy samples introduce
significant object overlap, complicating the use of sin-
gle binary masks to annotate all objects in an image.
Due to these limitations, we opted to implement a
grayscale mask representation.
2.2.1 Grayscale Segmentation Mask
By leveraging the full pixel value range, a single-
channel multi-object grayscale mask can efficiently
represent overlapping objects with low memory and
computational cost. The mask assigns distinct gray
tones (labels) to overlapping objects, ensuring clear
margins while minimizing the total number of labels.
Fewer labels enhance contrast between gray tones,
improving the GAN’s learning process.
Ideally, non-overlapping objects require only a
single label, resembling a binary mask. The num-
ber of labels depends on object overlap, and under-
standing their distribution is key to reducing them.
We model objects in an image as a directed, weighted
graph, where nodes represent objects and edges in-
dicate overlap. The edge weight from node u to
node v is the fraction of u’s area covered by v.
This graph structure enables refinement by removing
Synthesizing Annotated Cell Microscopy Images with Generative Adversarial Networks
593

highly overlapping objects, reducing label require-
ments.
Subgraphs represent clusters of overlapping ob-
jects, with the most complex subgraph determin-
ing the maximum labels needed. Using a modified
breadth-first search (BFS) within the Flood Fill al-
gorithm, we assign the smallest available label to
connected nodes, minimizing the label count. For
monoculture datasets, a single grayscale mask suf-
fices, while co-culture datasets may require separate
masks per class. Pseudocode for this graph-based ap-
proach is detailed in Algorithm 1.
Data: COCO, threshold, label-cap
initialization;
Graph G ← ∅;
for each Cell u ∈ COCO do
for each Cell v ∈ COCO − {u} do
w ←
u ∩ v
u
;
if w > 0 then
AddEdge(G, u,v, w);
end
end
end
for each Node n ∈ G do
if max(n.out edges) > threshold then
DeleteNode(G, n);
end
end
FloodFill(G, label-cap) ; // mod. BFS
Algorithm 1: Grayscale Mask generation.
2.3 Network Architecture
Our baseline approach is ReACGAN (Kang et al.,
2021), an architecture based on StyleGAN2 that ap-
plies the principles of ACGAN (Odena et al., 2017) to
perform conditional generation. The benefit of ReAC-
GAN over ACGAN is the addition of the Data-to-
Data Cross-Entropy loss (D2D-CE), which focuses on
the classification of strong positive or negative sam-
ples during training, avoiding instability in the early
training stages.
Similarly to the StyleGAN2 original input/output
skip configuration, we used the main generator branch
as a feature extractor to generate the images. How-
ever, we used modulated convolutions in the skip
connections to extract a fraction of the features of
each block and then merge them with the next block
through concatenation and a convolutional layer. The
feature channels decrease, while the resolution in-
creases through the network until the desired dimen-
sions are reached. Figure 1 depicts the architecture
c
1
Style block
Synthesis block
Synthesis block
...
...
Style block
Synthesis block
Mod. 2D Conv
2D Conv
A
Mod. 2D Conv
A
c
1
512
512
256
128512
384
256
A
A
B
B
... ...
Synthesis block
Up
tRGB
Up
tRGB
Up
tRGB
Figure 1: Modifications applied to StyleGAN2 generator.
On the left, original input/output skips configuration, and
on the right a detailed description of our implementation.
Style, synthesis blocks and modulated convolutions follow
the same implementation as in StyleGAN2 original publi-
cation. The notation presented here follows the StyleGAN2
original publication.
of the first two blocks of the generator. Unlike the
original implementation, we seek in our modifica-
tions to provide enough information to the generator
through meaningful features for both image and anno-
tation generation in each resolution level, facilitating
the data production.
2.4 Evaluation
For quantitative image evaluation, we used the
Fr
´
echet Inception Distance (FID) (Heusel et al., 2017)
and the Kernel Inception Distance (KID) (Binkowski
et al., 2018) to measure image quality. Both metrics
estimate the probability distribution of real and gen-
erated images using intermediate features of the In-
ception v3 (Szegedy et al., 2016) network. The dif-
ference lies in their assumptions about the data distri-
bution. A lower score in both FID and KID indicates
a higher image quality. FID is widely used to assess
the quality of generative models, as it correlates well
with human judgment (Borji, 2019), while KID is an
unbiased metric regarding the size of the data sample.
Evaluating the quality of the generated segmen-
tation masks directly is more challenging, so we as-
sessed them indirectly by training a segmentation net-
work on the LCell dataset (Edlund et al., 2021) using
real and generated data. We focused on LCell as it
offers higher complexity and more data for segmenta-
tion training.
In our first experiment, we progressively added
varying amounts of generated data to the full real
dataset. Based on these results, we fixed 3,200 gener-
ated images and progressively increased the amount
of real data, training four models with 25%, 50%,
75%, and 100% of the real dataset. Each split has the
ICAART 2025 - 17th International Conference on Agents and Artificial Intelligence
594
same class balance as the full dataset. We measured
segmentation performance using the overall Average
Precision (AP) IoU score on the test dataset. Both the
baseline and augmented models were trained under
the same conditions for reproducibility.
Finally, we subdivided the test dataset into early,
mid, and late categories, based on the time each
sample was taken. This division reflects the im-
pact of time on cell morphology and population den-
sity, which varies significantly across cell types in the
LCell dataset.
2.5 Implementation Details
We modified the ReACGAN implementation trained
for ImageNet of StudioGAN (Kang et al., 2023), a
GANs benchmark that stores several architectures and
configurations for different benchmark datasets. In
our implementation, a training sample is composed of
three elements: image (I), mask (m), and class label
(C), they are fed into the model similarly to ReAC-
GAN with the difference that m and I are first con-
catenated and then fed into the discriminator. For data
augmentation, we applied Differentiable Augmenta-
tion (Zhao et al., 2020), Adaptive Discriminator Aug-
mentation (ADA) (Karras et al., 2020a), and Adaptive
Pseudo Augmentation (APA) (Jiang et al., 2021) to
both models.
LCell GAN model used a two-block mapping net-
work and random 512 × 512 grayscale tiles for train-
ing, while TissueNet used a four-block mapping net-
work, random 256 × 256 RGB training tiles, and a
smaller learning rate (0.0005). Both models were
trained with a batch size of 16 for 60,000 iterations,
with an evaluation every 500 iterations to select the
model checkpoint based on the best FID score.
3 RESULTS AND DISCUSSION
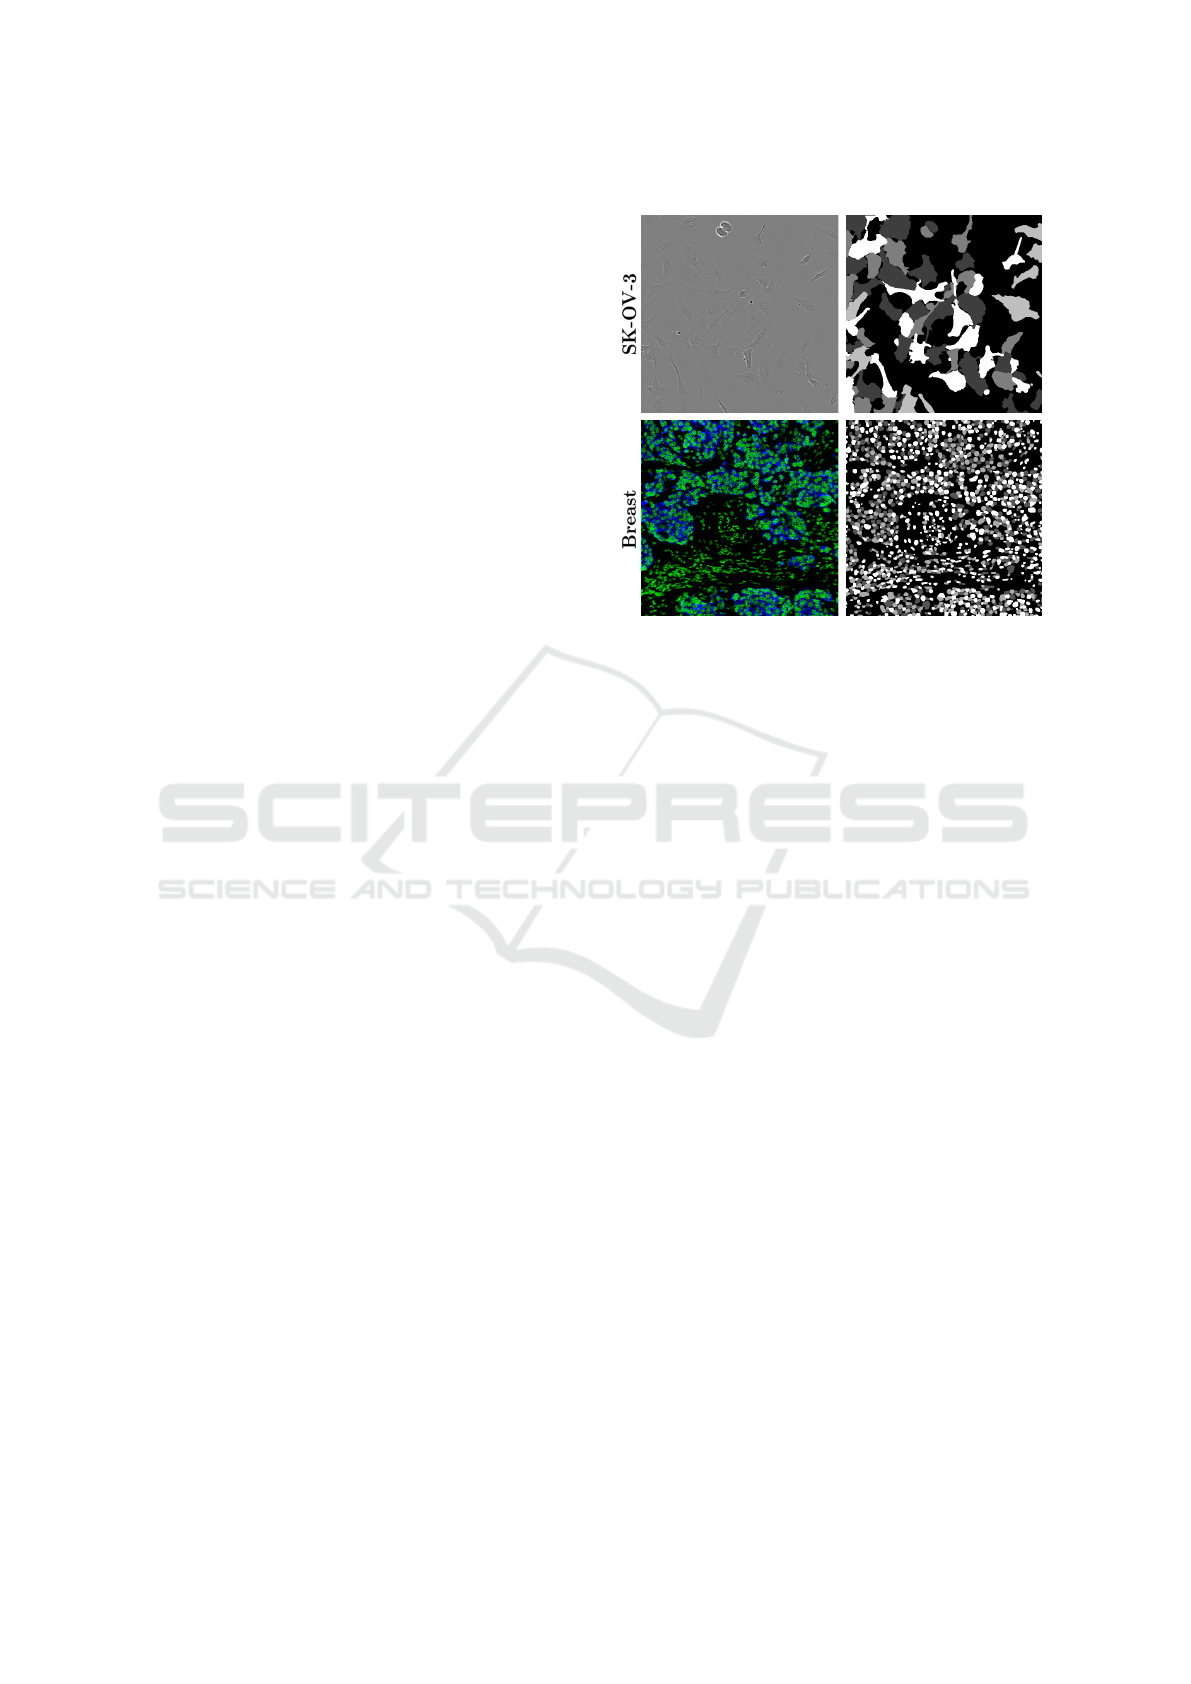
3.1 Grayscale Mask Generation
Figure 2 illustrates grayscale masks generated for
each dataset. As outlined in Section 2.2.1, the imple-
mentation aimed to maximize contrast between over-
lapping objects while minimizing the number of la-
bels, adhering to the 256-level grayscale limit. To
achieve this, we capped the number of labels per im-
age to ensure high object contrast.
To simplify the graph complexity, cells covered
by more than 70% of their area were excluded. This
reduced the labels from 11 to 7 and annotated cells
from 1,014,369 to 994,830. Lowering the label cap
to four further reduced the annotated cells to 984,963
Grayscale MaskReal Image
Figure 2: Grayscale segmentation mask. The grayscale
masks store effectively the instance segmentation annota-
tions. The first row presents a LCell image with its respec-
tive mask, while the second row a TissueNet sample.
(97% of the original dataset) while preserving con-
trast. For TissueNet, a label cap of three was suffi-
cient due to lower nucleus overlap, yielding 802,941
annotated nuclei (99% of the original dataset).
Before mask generation, the grayscale spectrum
was divided by the maximum number of labels and
values were shuffled per image, ensuring balanced
pixel representation and minimizing potential bias.
3.2 Image Generation
We begin with a qualitative evaluation by compar-
ing real and generated samples, as shown in Fig-
ure 3, which includes paired images and correspond-
ing masks from both datasets.
Differences in cell morphology between classes
are evident. In the LCell dataset, simpler shapes
like circular SkBr3 cells contrast with more complex
structures in the A172 class. TissueNet exhibits more
uniform shapes across classes, with frequent overlaps
in annotations. The generated images closely resem-
ble real samples, and the synthetic masks accurately
capture most annotated regions. However, some cell
types, such as BT-474, display overpopulated areas
where individual cells are indistinguishable, similar to
the ground truth annotations. Despite this, the GAN
often successfully segments overlapping objects inde-
pendently.
Quantitative results are summarized in Table 1,
which reports FID and KID scores for the proposed
model compared to baselines. These metrics, aver-
Synthesizing Annotated Cell Microscopy Images with Generative Adversarial Networks
595
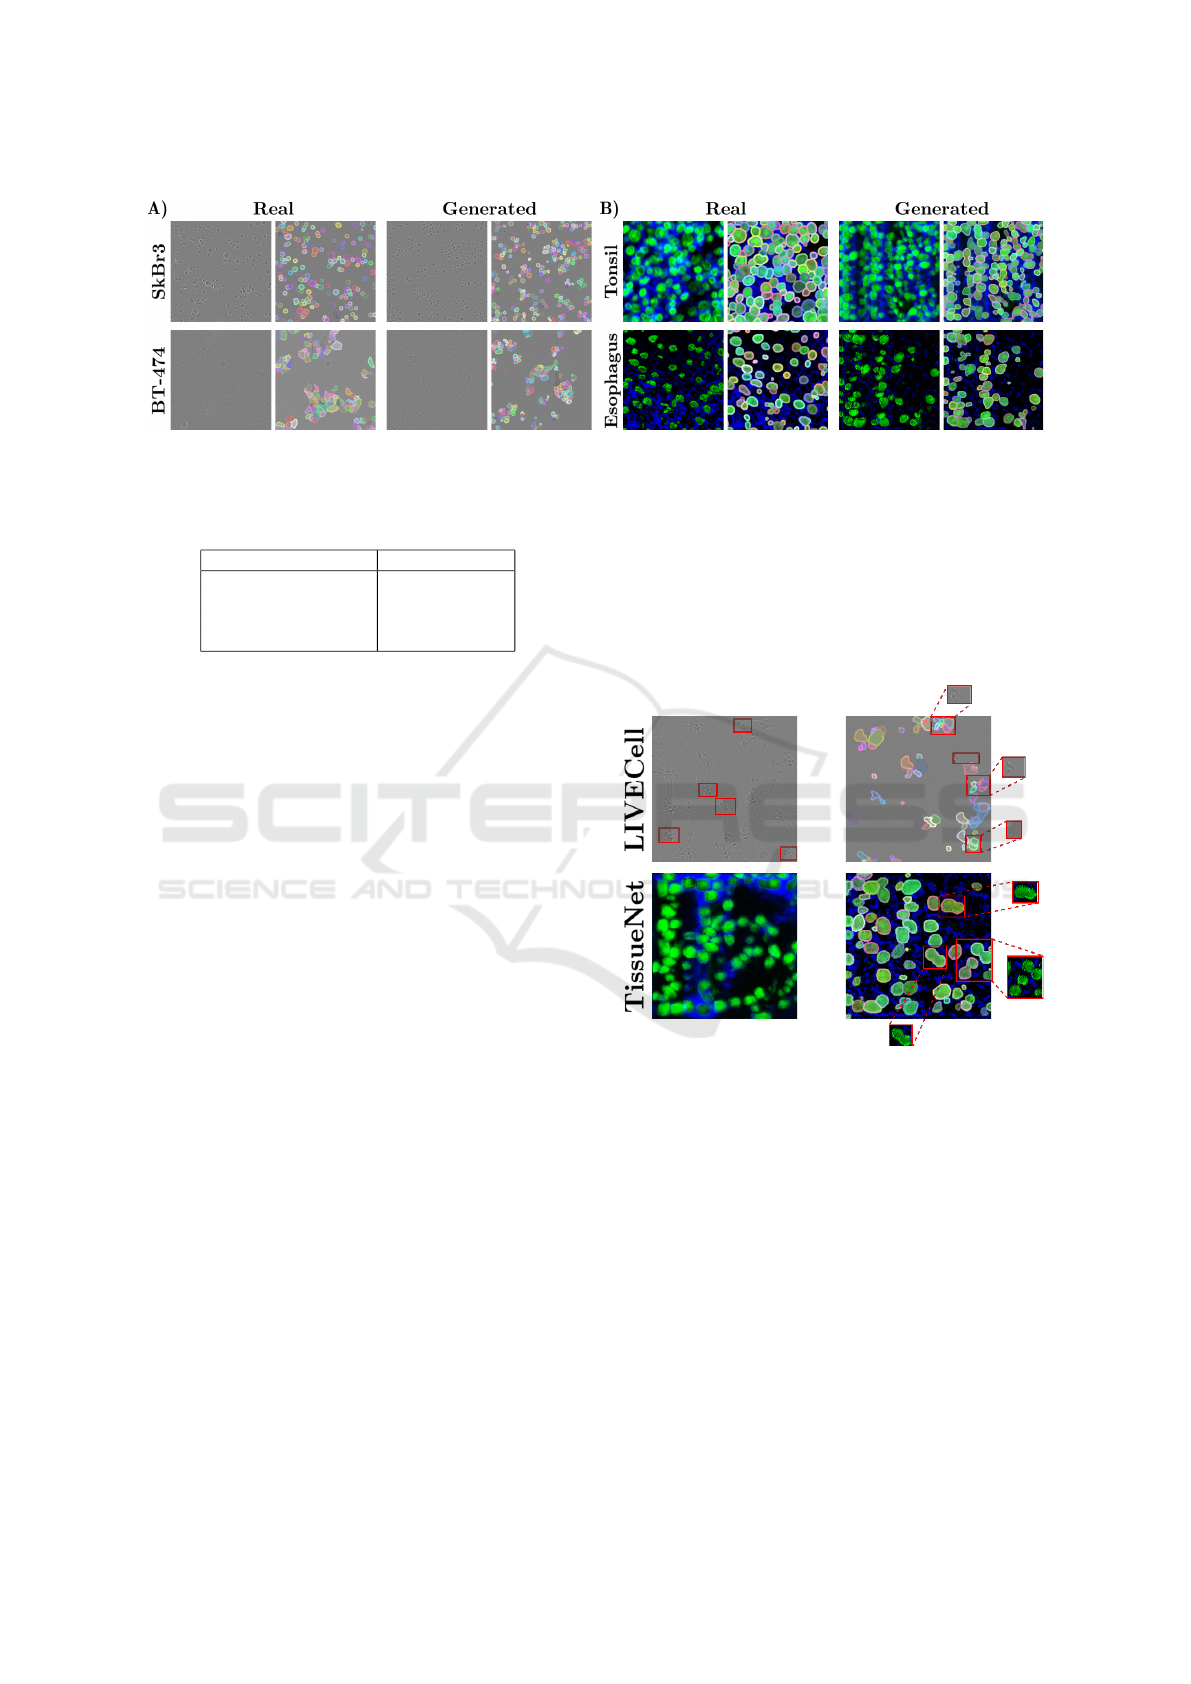
Figure 3: Real and generated images with their respective segmentation masks after post-processing. A) LCell dataset samples
from SkBr3 and BT-474 cell types. B) TissueNet dataset samples from tonsil and esophagus tissues.
Table 1: Image generation FID scores with our implemen-
tation.
Model FID KID
LCell Vanilla 25.83 0.023
LCell with Mask 37.96 0.034
TIssueNet Vanilla 87.83 0.049
TissueNet with Mask 153.15 0.173
aged across all classes, evaluate image quality. KID
score, more robust for smaller datasets, were included
for additional insight. However, scores are not di-
rectly comparable across datasets and should be in-
terpreted with care.
The LCell and TissueNet datasets are not widely
used for generative tasks, limiting the ability to
benchmark these metrics. While these datasets are
rich in object annotations, they are smaller in im-
age count compared to standard generative bench-
marks. Moreover, existing generative studies in cell
microscopy report high variability in FID and KID
scores, highlighting the lack of standardization in the
field (Lesmes-Leon et al., 2023).
To evaluate the impact of our modifications, we
trained unmodified StyleGAN2 models as baselines.
Both datasets showed a decrease in image quality
when generating segmentation masks, emphasizing
the trade-off between image quality and annotated
features. While baseline models produced higher-
quality unannotated images, the modified versions in-
tegrated mask generation, optimizing resources at the
cost of slight quality reduction.
A notable observation is the score disparity be-
tween datasets. LCell achieved lower FID and KID
scores compared to TissueNet across all models. This
can be attributed to the simpler grayscale phase-
contrast images in LCell versus the more complex
RGB fluorescence microscopy in TissueNet. How-
ever, TissueNet’s smaller size and lower quality, in-
cluding significant background noise in training tiles,
also contributed to the poorer performance. For in-
stance, in the StyleGAN2 Vanilla experiment, the
model struggled with lymph node metastasis cell
types due to overfitting.
Given the absence of comparable studies using
segmentation datasets for generative tasks, we ana-
lyzed generated samples to identify potential sources
of quality degradation. Figure 4A illustrates common
artifacts observed in the generated images.
B) Segmentation
A) Image quality
Figure 4: GAN generator artifacts. A) LCell images com-
prise repetitive patterns and blurred edges, while TissueNet
presents an uncommon distribution of the blue channel.
B) Segmentation masks artifacts include cell segmentation
fragmentation in LCell and object merging in TissueNet.
The intra-class variability is a defining feature of
the datasets. LCell has time dependency, while Tis-
sueNet gathers samples from different experiments
and institutions. In LCell, the generator artifacts vary
by cell type. For instance, in SH-SY5Y, which has
high morphological variability, the generator often
produces repetitive patterns like cell clusters from a
specific morphological state seen across time steps.
For fast-growing cells like SK-OV-3, the generator
struggles to create early-stage images, instead produc-
ing overpopulated images with large overlaps and am-
ICAART 2025 - 17th International Conference on Agents and Artificial Intelligence
596
Table 2: Segmentation AP scores of whole LCell dataset
and different number of generated images.
Model LCell LCell+1,600 LCell+3,200 LCell+6,400
AP 47.69 47.26 47.11 46.79
biguous cell shapes. In TissueNet, we observed irreg-
ular blue channel distributions, with some cell types
(e.g., breast and lymph nodes) displaying vertical blue
bands on the left side of the image.
This intra-class variability also significantly im-
pacts FID and KID scores. While the generated LCell
images capture realistic cell morphology, they fail to
represent the full morphological spectrum. For ex-
ample, BT-474 cells exhibit diverse shapes and sizes,
SH-SY5Y ranges from round to neuron-like cells,
and BV-2 has consistent morphology but high pop-
ulation variability. In all cases, the generator captures
specific modes, underrepresenting intra-class distri-
butions. This limitation is expected, as the GAN ar-
chitecture conditions only on cell type and ignores
time constraints during training.
TissueNet performed worse due to its smaller size
and complexity. As a collaborative dataset from mul-
tiple institutions, its samples vary in cell preparation,
image acquisition, and post-processing, even within
the same class. Improved pre-processing and data
quality evaluation could enhance generative perfor-
mance.
3.3 Instance Segmentation
To evaluate the utility of the generated data samples,
we train a segmentation network with augmented
training data with different data schemes.
The first experiment consisted on training a seg-
mentation model with the whole LCell dataset and in-
creasing progressively the number of generated sam-
ples for augmentation. The goal of this experiment
was to see the impact of generated data during train-
ing. The results are presented in Table 2.
Segmentation AP slightly decreased when incor-
porating generated data, with the level of degradation
being proportional to the number of generated sam-
ples used. Previous research suggests that overrep-
resenting generated data can negatively affect model
performance (Anaam et al., 2021). Notably, there was
no significant difference between augmenting with
1,600 and 3,200 generated samples. Consequently,
we proceeded with 3,200 generated samples in sub-
sequent experiments to evaluate the extent to which
real data could be substituted by generated data while
maintaining or improving segmentation performance.
Table 3 compiles the AP scores from the segmen-
tation model experiments. The results presented cor-
respond to the baseline (no augmentation) scores and
Table 3: Segmentation AP scores of non-augmented base-
line with its difference against its augmented counterpart.
Test data
Real Data Percentage
25% 50% 75% 100%
Full 45.36 (-0.89) 46.59 (-0.89) 47.59 (-0.77) 47.69 (-0.48)
A172 38.58 (-0.78) 38.77 (-0.82) 39.17 (+0.25) 39.97 (-0.49)
BT-474 40.86 (-1.56) 43.18 (-1.83) 44.41 (-1.28) 44.45 (-0.48)
BV-2 52.69 (-0.86) 53.93 (-0.91) 54.92 (-0.95) 54.69 (+0.02)
Huh7 52.12 (-1.26) 53.22 (-1.57) 53.06 (-0.81) 54.10 (-0.58)
MCF7 36.11 (-1.30) 37.84 (-1.07) 39.45 (-1.40) 39.35 (-0.75)
SH-SY5Y 23.92 (-1.18) 26.40 (-2.24) 26.70 (-1.40) 26.99 (-1.08)
SkBr3 66.13 (-0.12) 65.66 (+0.73) 66.44 (+0.60) 66.93 (-0.01)
SK-OV-3 53.40 (-0.92) 54.07 (-0.65) 54.57 (-0.05) 54.92 (-0.53)
their difference w.r.t. the GAN-augmented training
in parentheses. Positive numbers reflect segmentation
improvement with GAN-augmentation over the base-
line.
From the baseline results, two important patterns
emerged. First, the average AP improvement de-
creased as the training dataset size increased, with
improvements of 1.17, 0.74, and 0.37 for smaller to
larger datasets. These findings highlight the archi-
tecture’s scalability and the diminishing impact of
GAN-augmentation as more real data becomes avail-
able. Second, segmentation performance varied sig-
nificantly by cell type, with BV-2 and SkBr3 being
the easiest to segment, while SH-SY5Y remained the
most challenging.
Regarding GAN-augmentation, most cases
showed a slight decrease in AP scores. The largest
reduction was observed in SH-SY5Y (over 1.08 for
each training scheme). However, BV-2 and SkBr3
benefited the most from the generated data, with
SkBr3 achieving improvements of +0.73 and +0.60
in the 50% and 75% training schemes, respectively.
While some alignment exists between baseline and
GAN-augmentation results, these findings do not
fully explain the impairments observed with data aug-
mentation. Two potential sources of impairment were
identified: GAN generalization and segmentation
mask fidelity.
GANs, despite their potential, are prone to insta-
bility during training and issues like mode collapse
(Wiatrak et al., 2020), where models produce low-
variability samples. In our experiments, conditioning
solely on cell type overlooked critical intra-class vari-
ability caused by time and source dependencies in the
LCell and TissueNet datasets. This limited general-
ization and contributed to inconsistent segmentation
performance.
Mask fidelity also played a role. As shown
in Figure 4B, segmentation masks produced arti-
facts, including fragmented single-cell annotations
and the omission of small objects in LCell images.
These issues stem from the grayscale mask genera-
tion pipeline, which does not highlight overlapping
regions, preventing the generator from learning their
features. To mitigate this, we filtered generated con-
Synthesizing Annotated Cell Microscopy Images with Generative Adversarial Networks
597

Table 4: LCell time data split AP segmentation scores of non-augmented baseline with its difference against its augmented
counterpart.
Real Data
Percentage
25% 50% 75% 100%
Test data Early Mid Late Early Mid Late Early Mid Late Early Mid Late
Full 55.31 (-0.43) 43.60 (-0.73) 37.00 (-1.51) 56.35 (-0.61) 44.91 (-0.83) 38.42 (-1.32) 57.03 (-0.33) 46.00 (-0.78) 39.44 (-1.12) 57.31 (-0.26) 46.00 (-0.64) 39.66 (-0.68)
A172 54.07 (-0.19) 43.12 (-1.06) 31.29 (-0.55) 56.49 (-2.25) 44.90 (-2.05) 29.82 (+0.61) 55.46 (-0.36) 44.69 (+0.08) 31.24 (+0.37) 55.89 (+0.13) 45.30 (-0.73) 32.19 (-0.54)
BT-474 52.66 (-0.46) 37.71 (-1.87) 35.47 (-1.75) 55.42 (-1.57) 40.27 (-1.97) 37.56 (-1.89) 55.64 (-0.44) 41.83 (-1.79) 39.34 (-1.76) 55.75 (+0.04) 41.69 (-0.80) 39.15 (-0.45)
BV-2 66.26 (+1.01) 59.31 (-0.30) 48.80 (-1.15) 68.86 (-2.44) 59.34 (+0.27) 50.34 (-1.03) 68.73 (-0.80) 60.99 (-0.26) 51.08 (-1.17) 67.71 (+0.00) 60.72 (+0.47) 51.06 (-0.26)
Huh7 56.57 (-0.95) 52.34 (-1.43) 47.33 (-1.49) 58.23 (-2.17) 53.21 (-1.03) 48.15 (-1.56) 58.68 (-1.31) 52.46 (-0.86) 48.41 (-0.51) 58.32 (+0.16) 54.13 (-0.97) 49.87 (-0.59)
MCF7 52.50 (+0.13) 39.60 (-0.40) 30.90 (-1.69) 54.29 (+0.35) 42.56 (-1.69) 32.09 (-0.90) 55.58 (-0.31) 43.87 (-1.67) 33.97 (-1.59) 56.43 (-0.97) 43.33 (-0.52) 33.88 (-0.76)
SH-SY5Y 33.35 (-1.52) 22.41 (-1.19) 22.86 (-0.47) 36.15 (-2.65) 25.10 (-2.20) 25.66 (-2.20) 36.41 (-2.68) 25.80 (-1.91) 25.90 (-0.76) 36.33 (-0.37) 25.98 (-1.59) 26.13 (-1.08)
SkBr3 74.05 (+0.48) 68.68 (-1.23) 61.77 (+0.38) 73.23 (+1.64) 65.69 (+2.14) 63.61 (-1.05) 74.56 (+1.20) 67.48 (+0.76) 63.30 (-0.21) 75.49 (-0.57) 68.17 (+0.41) 63.33 (-0.52)
SK-OV-3 60.83 (-0.98) 56.00 (-0.88) 49.76 (-0.56) 62.04 (-1.39) 57.13 (-1.13) 49.98 (+0.04) 61.59 (+0.32) 57.55 (-0.38) 50.82 (+0.14) 62.42 (+0.11) 57.85 (-0.67) 51.23 (-0.40)
tours falling outside the real data area distribution, re-
moving small or overly synthetic segmented regions.
Different from the LCell dataset, the TissueNet
generated masks display object annotation merging.
Although the cause is unknown, we attribute this be-
havior to image style variability, considering that im-
ages from different devices and sampling protocols
could lead to fluctuations in contrast, brightness, in-
tensity, and sharpness.
To further analyze the influence of generated sam-
ples on segmentation training, we propose dividing
the test data based on time stages. Specifically, we
will explore the distribution of samples for each cell
type in LCell and categorize them into three time
stages; early, mid, and late cell development. This
partitioning should provide insights into how well
both the GAN and segmentation models generalize
across the entire dataset. Table 4 contains the results
of this experiment.
The experiment confirms the high inter-class vari-
ability of the data, with significant AP fluctuations
across time stages in each training scheme. Baseline
scores are generally higher in the early stage and de-
crease later, with impairments over 10 points for some
cell types. This variability is attributed to differences
in cell morphology and density. Notably, cell types
like A172 and MCF7 exhibit stable variability, while
BT-474 and SH-SY5Y show higher fluctuations early
on, suggesting kinetics as a contributing factor. How-
ever, it remains unclear whether this is driven by mor-
phology changes or cell density.
The GAN-augmentation approach boosted perfor-
mance in 22 cases, predominantly in the early and
mid-stages, highlighting GANs’ ability to learn dis-
tributions from earlier time stages. SkBr3 particu-
larly benefited, showing improvements in seven of
nine splits, with a maximum boost of +2.14 in the
mid-stage of the 50% training scheme.
The Table 4 results suggest that the proposed
GAN architecture can generate useful segmentation
masks but struggles to generalize across variable
data. Stable improvements were observed for time-
independent cell types like SkBr3, while others high-
lighted the impact of inter-class variability. Genera-
tive models, particularly with enhanced conditioning,
could overcome these limitations, as shown by better
performance with more stable cell types (e.g., SkBr3,
BV-2).
4 CONCLUSION
In this work, we showcased the potential of genera-
tive models to produce synthetic data with their re-
spective instance segmentation annotations with low
effort. Our approach showed how generative models
learn meaningful segmentation-related features dur-
ing training, without additional constraints. We be-
lieve that further exploring this field through more
powerful generative models, such as Diffusion mod-
els or regularization techniques, will increase the pos-
sibilities to produce higher quality annotated data.
ACKNOWLEDGEMENTS
This work is partially funded by SAIL (Sartorius AI
Lab), a collaboration between the German Research
Center for Artificial Intelligence (DFKI) and Sarto-
rius AG.
REFERENCES
Abdal, R., Zhu, P., Mitra, N. J., and Wonka, P. (2021). La-
bels4Free: Unsupervised Segmentation Using Style-
GAN. In Proceedings of the IEEE/CVF International
Conference on Computer Vision, pages 13970–13979.
Anaam, A., Bu-Omer, H. M., and Gofuku, A. (2021).
Studying the Applicability of Generative Adversarial
Networks on HEp-2 Cell Image Augmentation. IEEE
Access, 9:98048–98059.
Binkowski, M., Sutherland, D. J., Arbel, M., and Gretton,
A. (2018). Demystifying MMD gans. In 6th Interna-
tional Conference on Learning Representations, ICLR
2018, Vancouver, BC, Canada, April 30 - May 3, 2018,
Conference Track Proceedings. OpenReview.net.
Borji, A. (2019). Pros and cons of GAN evaluation mea-
sures. Computer Vision and Image Understanding,
179:41–65.
ICAART 2025 - 17th International Conference on Agents and Artificial Intelligence
598

Dee, W., Ibrahim, R. A., and Marouli, E. (2023).
Histopathological Domain Adaptation with Genera-
tive Adversarial Networks Bridging the Domain Gap
Between Thyroid Cancer Histopathology Datasets.
Dimitrakopoulos, P., Sfikas, G., and Nikou, C. (2020).
ISING-GAN: Annotated Data Augmentation with a
Spatially Constrained Generative Adversarial Net-
work. In 2020 IEEE 17th International Symposium
on Biomedical Imaging (ISBI), pages 1600–1603.
Edlund, C., Jackson, T. R., Khalid, N., Bevan, N., Dale,
T., Dengel, A., Ahmed, S., Trygg, J., and Sj
¨
ogren,
R. (2021). LIVECell—A large-scale dataset for
label-free live cell segmentation. Nature Methods,
18(9):1038–1045.
Goodfellow, I., Pouget-Abadie, J., Mirza, M., Xu, B.,
Warde-Farley, D., Ozair, S., Courville, A., and Ben-
gio, Y. (2014). Generative Adversarial Nets. In
Ghahramani, Z., Welling, M., Cortes, C., Lawrence,
N., and Weinberger, K. Q., editors, Advances in Neu-
ral Information Processing Systems, volume 27. Cur-
ran Associates, Inc.
Greenwald, N. F., Miller, G., Moen, E., Kong, A., Kagel,
A., Dougherty, T., Fullaway, C. C., McIntosh, B. J.,
Leow, K. X., Schwartz, M. S., Pavelchek, C., Cui,
S., Camplisson, I., Bar-Tal, O., Singh, J., Fong, M.,
Chaudhry, G., Abraham, Z., Moseley, J., Warshawsky,
S., Soon, E., Greenbaum, S., Risom, T., Hollmann,
T., Bendall, S. C., Keren, L., Graf, W., Angelo, M.,
and Van Valen, D. (2022). Whole-cell segmentation
of tissue images with human-level performance using
large-scale data annotation and deep learning. Nature
Biotechnology, 40(4):555–565.
Han, L., Murphy, R. F., and Ramanan, D. (2018). Learn-
ing Generative Models of Tissue Organization with
Supervised GANs. In IEEE Winter Conference on
Applications of Computer Vision. IEEE Winter Con-
ference on Applications of Computer Vision, volume
2018, pages 682–690.
Heusel, M., Ramsauer, H., Unterthiner, T., Nessler, B., and
Hochreiter, S. (2017). GANs Trained by a Two Time-
Scale Update Rule Converge to a Local Nash Equilib-
rium. In Advances in Neural Information Processing
Systems, volume 30. Curran Associates, Inc.
Jiang, L., Dai, B., Wu, W., and Loy, C. C. (2021). Deceive
D: Adaptive Pseudo Augmentation for GAN Training
with Limited Data. In Advances in Neural Information
Processing Systems, volume 34, pages 21655–21667.
Curran Associates, Inc.
Kang, M., Shim, W., Cho, M., and Park, J. (2021). Reboot-
ing ACGAN: Auxiliary Classifier GANs with Stable
Training. In Advances in Neural Information Process-
ing Systems, volume 34, pages 23505–23518. Curran
Associates, Inc.
Kang, M., Shin, J., and Park, J. (2023). StudioGAN: A Tax-
onomy and Benchmark of GANs for Image Synthesis.
IEEE Transactions on Pattern Analysis and Machine
Intelligence, 45(12):15725–15742.
Karras, T., Aittala, M., Hellsten, J., Laine, S., Lehtinen, J.,
and Aila, T. (2020a). Training Generative Adversar-
ial Networks with Limited Data. In Advances in Neu-
ral Information Processing Systems, volume 33, pages
12104–12114. Curran Associates, Inc.
Karras, T., Laine, S., Aittala, M., Hellsten, J., Lehtinen,
J., and Aila, T. (2020b). Analyzing and improving
the image quality of stylegan. In Proceedings of the
IEEE/CVF Conference on Computer Vision and Pat-
tern Recognition, pages 8110–8119. IEEE Computer
Society.
Kingma, D. P. and Welling, M. (2014). Auto-encoding vari-
ational bayes. In Bengio, Y. and LeCun, Y., editors,
2nd International Conference on Learning Represen-
tations, ICLR 2014, Banff, AB, Canada, April 14-16,
2014, Conference Track Proceedings.
Lesmes-Leon, D. N., Dengel, A., and Ahmed, S. (2023).
Generative adversarial networks in cell microscopy
for image augmentation. A systematic review.
Lin, T., Maire, M., Belongie, S. J., Bourdev, L. D., Girshick,
R. B., Hays, J., Perona, P., Ramanan, D., Doll’a r, P.,
and Zitnick, C. L. (2014). Microsoft COCO: common
objects in context. CoRR, abs/1405.0312.
Mascolini, A., Cardamone, D., Ponzio, F., Di Cataldo, S.,
and Ficarra, E. (2022). Exploiting generative self-
supervised learning for the assessment of biological
images with lack of annotations. BMC Bioinformat-
ics, 23(1):295.
Nichol, A. Q. and Dhariwal, P. (2021). Improved Denoising
Diffusion Probabilistic Models. In Proceedings of the
38th International Conference on Machine Learning,
pages 8162–8171. PMLR.
Odena, A., Olah, C., and Shlens, J. (2017). Conditional
Image Synthesis with Auxiliary Classifier GANs. In
Proceedings of the 34th International Conference on
Machine Learning, pages 2642–2651. PMLR.
Shaga Devan, K., Walther, P., von Einem, J., Ropinski, T.,
A. Kestler, H., and Read, C. (2021). Improved auto-
matic detection of herpesvirus secondary envelopment
stages in electron microscopy by augmenting train-
ing data with synthetic labelled images generated by
a generative adversarial network. Cellular Microbiol-
ogy, 23(2):e13280.
Sharma, R., Saqib, M., Lin, C. T., and Blumenstein, M.
(2022). A Survey on Object Instance Segmentation.
SN Computer Science, 3(6):499.
Szegedy, C., Vanhoucke, V., Ioffe, S., Shlens, J., and Wojna,
Z. (2016). Rethinking the Inception Architecture for
Computer Vision. In 2016 IEEE Conference on Com-
puter Vision and Pattern Recognition (CVPR), pages
2818–2826.
Toker, A., Eisenberger, M., Cremers, D., and Leal-Taix
´
e,
L. (2024). SatSynth: Augmenting Image-Mask Pairs
through Diffusion Models for Aerial Semantic Seg-
mentation.
Wiatrak, M., Albrecht, S. V., and Nystrom, A. (2020). Sta-
bilizing Generative Adversarial Networks: A Survey.
Zhao, S., Liu, Z., Lin, J., Zhu, J.-Y., and Han, S. (2020).
Differentiable Augmentation for Data-Efficient GAN
Training. In Advances in Neural Information Pro-
cessing Systems, volume 33, pages 7559–7570. Cur-
ran Associates, Inc.
Synthesizing Annotated Cell Microscopy Images with Generative Adversarial Networks
599
