
Uniting Mcdonald’s Beta and Liouville Distributions to Empower
Anomaly Detection
Oussama Sghaier
a
, Manar Amayri
b
and Nizar Bouguila
c
Concordia Institute for Information Systems Engineering (CIISE), Concordia University,
1455 Blvd. De Maisonneuve Ouest, Montreal, H3G 1T7, QC, Canada
Keywords:
Mcdonald’s Beta-Liouville, Normality Scores, Support Vector Machine, Anomaly Detection.
Abstract:
In this paper, we examine the McDonald’s Beta-Liouville distribution, a new distribution that combines the
key features of the Liouville and McDonald’s Beta distributions, in order to address the issue of anomaly iden-
tification in proportional data. Its primary advantages over the standard distributions for proportional data,
including the Dirichlet and Beta-Liouville, are its flexibility and capacity for explanation when working with
this type of data, thanks to its variety of presented parameters. We provide two discriminative methods: a fea-
ture mapping approach to improve Support Vector Machine (SVM) and normality scores based on choosing a
specific distribution to approximate the softmax output vector of a deep classifier. We illustrate the advantages
of the proposed methods with several tests on image and non-image data sets. The findings show that the
suggested anomaly detectors, which are based on the McDonald’s Beta-Liouville distribution, perform better
than baseline methods and classical distributions.
1 INTRODUCTION
The identification of uncommon occurrences that de-
viate from typical behavior, or anomaly detection
(Chandola et al., 2009; Fan et al., 2011), has expe-
rienced continuous innovation to increase accuracy
and efficacy. It is now a popular topic in many ap-
plications and is very important in many domains, in-
cluding computer vision, medical, network security,
and animal behavior (Topham et al., 2022; Epaillard
and Bouguila, 2019). This task remains difficult since
anomalies have few occurrences, making it difficult to
obtain aberrant samples. Robust techniques are des-
perately needed to model anomalies. Within the field
of anomaly detection, where one looks for abnormal
patterns in the data, discriminative methods are com-
monly used to distinguish between normal and abnor-
mal data points. Support vector machines (SVMs)
and the isolation forest (IF) (Liu et al., 2008) are some
of the techniques that have been found to be useful
in this area, despite their challenges. However, it is
important to note that such approaches may be sensi-
tive towards certain settings called hyperparameters,
or they might fail on some data types altogether. Re-
a
https://orcid.org/0009-0002-0077-5300
b
https://orcid.org/0000-0002-5610-8833
c
https://orcid.org/0000-0001-7224-7940
searchers have investigated several strategies to ad-
dress these issues. Some have looked at distribution-
based approaches to gain a deeper understanding of
the data structure (Scholkopf and Smola, 2002), while
others have created algorithms that, without relying
largely on hyperparameters, offer a score to each data
point reflecting its degree of normality (Golan and El-
Yaniv, 2018).
This work aims to demonstrate how discrimina-
tive techniques (SVM with feature mapping and Nor-
mality Scores) can be used to get excellent results
in anomaly detection tasks. Our objective with the
normality score technique is to develop a novel sys-
tem that, in the testing phase, assigns a normal-
ity score to each sample after it has been trained
using a transformed set of normal samples during
the training phase. Lastly, the reason for choosing
SVM specifically among traditional discriminative al-
gorithms is that they have become a common learning
tool that yields benchmark results due to their compu-
tational efficacy, especially in high-dimensional fea-
ture spaces. The challenge encountered in develop-
ing the two approaches lies in effectively modeling
proportional data, which imposes the constraints of
non-negativity and unit sum. Traditionally, data mod-
eling has relied heavily on the Gaussian distribution,
but its rigidity proves inadequate for handling propor-
Sghaier, O., Amayri, M. and Bouguila, N.
Uniting Mcdonald’s Beta and Liouville Distributions to Empower Anomaly Detection.
DOI: 10.5220/0013164100003929
In Proceedings of the 27th International Conference on Enterprise Information Systems (ICEIS 2025) - Volume 1, pages 181-190
ISBN: 978-989-758-749-8; ISSN: 2184-4992
Copyright © 2025 by Paper published under CC license (CC BY-NC-ND 4.0)
181

tional data. Recognizing this limitation, researchers
have turned to the Dirichlet family of distributions as
a more flexible and precise alternative (Golan and El-
Yaniv, 2018; Sghaier et al., 2023; Bouguila and Ziou,
2006; Sefidpour and Bouguila, 2012; Bouguila and
Ziou, 2005c; Bouguila and Ziou, 2005b; Bouguila
and Ziou, 2005a; Amirkhani et al., 2021). This shift
underscores a departure from the constraints inherent
in the Gaussian distribution, offering a more adapt-
able framework for accurately representing propor-
tional data. Studies by authors in (Golan and El-
Yaniv, 2018) and (Sghaier et al., 2023) have explored
the use of Dirichlet and Multivariate Beta distribu-
tions, respectively, to approximate output vectors of
deep classifiers. Furthermore, Dirichlet and its gen-
eralized counterpart have found application in mod-
eling feature mapping functions within SVM (Rah-
man and Bouguila, 2021). In real applications, how-
ever, the Dirichlet distribution is less dependable due
to the considerable interdependencies among the ran-
dom variables (Wong, 1998; Fan et al., 2017; Epail-
lard and Bouguila, 2016). Furthermore, multinomial
cells and relative placements between categories are
not taken into consideration by the Dirichlet distribu-
tion (Oboh and Bouguila, 2017; Zamzami et al., 2020;
Nguyen et al., 2019). Moreover, inadequate parame-
terization limits the amount of variation and covari-
ance that may be captured in a set of data.
To tackle these challenges, Beta-Liouville from
Liouville family was proposed in (Bouguila, 2012a;
Bouguila, 2012b; Fan and Bouguila, 2013). It has
two additional parameters compared to Dirichlet. In
this context, and utilizing McDonald’s Beta to model
data on the support [0,1] (Forouzanfar et al., 2023b;
Forouzanfar et al., 2023a; Forouzanfar et al., 2023c),
we choose to extend the Beta-Liouville distribution in
our work and create the McDonald’s Beta-Liouville
distribution. McDonald’s Beta-Liouville has three
extra parameters compared to Dirichlet (Fan and
Bouguila, 2012) which gives the data modeling ad-
ditional degrees of freedom. Additionally, the extra
shape factors can alter the tail weights, simultane-
ously modify the kurtosis and skewness, and raise the
distribution’s entropy.
The following succinctly describes the primary
contributions of this work: 1) Based on McDonald’s
Beta and Liouville distributions, we suggest a novel
distribution appropriate for proportional data; 2) We
introduce a deep anomaly detector for images and
non-images, predicated on a broad assumption for
the softmax predictions vector. We present McDon-
ald’s Beta-Liouville distribution for estimating the
classifier’s output vector; 3) We utilize McDonald’s
Beta-Liouville distribution to construct a novel fea-
ture mapping function in SVM.
The rest of this article is organized as follows:
We discuss related work to anomaly detection in sec-
tion 2. In section 3, we propose a new distribution
based on McDonald’s Beta and Liouville distribu-
tions. Section 4 contains a detailed description of
the normality scores-based transformation architec-
ture. We present our McDonald’s Beta-Liouville fea-
ture mapping function of SVM in section 5. Section 6
is devoted to the experimental results when we eval-
uate the effectiveness of our approaches and compare
them to several baseline methods. In section 7, we
conclude our work.
2 RELATED WORK
In prior studies, researchers have explored diverse ap-
proaches for anomaly detection, with a particular fo-
cus on normality scores and SVM feature mapping.
For instance, in (Golan and El-Yaniv, 2018; Sghaier
et al., 2023), an innovative architecture was proposed
involving geometric transformations applied to im-
age data, followed by classification using a Dirich-
let (Golan and El-Yaniv, 2018) (or Multivariate Beta
in (Sghaier et al., 2023)) distribution-based normal-
ity scores function during testing. Regarding trans-
formations, we can refer to (Qiu et al., 2021), where
the authors described Neural Transformation Learn-
ing for Anomaly Detection (NeuTraL AD), an end-to-
end process for anomaly detection employing learn-
able transformations. The two parts of the NeuTraL
AD are an encoder and a fixed set of learnable trans-
formations. They are both simultaneously trained on
a contrastive loss that is deterministic (DCL). Addi-
tionally, the work in (Zhang et al., 2020) introduced
a semi-supervised method utilizing GANs and frame
prediction to generate normality scores during testing.
Talking about SVM, it has emerged as a
formidable tool in anomaly detection, as highlighted
in (Hosseinzadeh et al., 2021), where various machine
learning techniques were integrated with SVM clas-
sifiers for abnormality identification. Deep learning
techniques were also coupled with SVM, as exempli-
fied in (Erfani et al., 2016), which employed DBN
for feature extraction followed by one-class SVM
training. Notably, feature mapping functions have
been pivotal in enhancing SVM performance, espe-
cially in handling proportional data. The work pro-
posed by (Nedaie and Najafi, 2018) introduced a fea-
ture mapping function based on the Dirichlet distribu-
tion, which demonstrated effectiveness across various
tasks involving proportional data. Building upon this,
(Rahman and Bouguila, 2021) sought to leverage the
ICEIS 2025 - 27th International Conference on Enterprise Information Systems
182
explanatory capabilities of generalized Dirichlet and
Beta-Liouville distributions to develop a more flex-
ible feature mapping function for modeling propor-
tional data. These previous endeavors provide valu-
able insights and pave the way for further exploration
in the realms of normality scores and SVM feature
mapping for anomaly detection.
3 MCDONALD’S
BETA-LIOUVILLE
DISTRIBUTION
A K-dimensional vector X follows a Liouville distri-
bution with parameters (α
1
, ··· , α
K
) and density gen-
erator g(.) if its pdf (probability density function) is
defined by (Fang, 2018; Hu et al., 2019):
p(X|α
1
, ··· , α
K
) = g(u)
K
∏
i=1
X
α
i
−1
i
Γ(α
i
)
(1)
where u =
∑
K
i=1
X
i
< 1, and 0 < X
i
< 1, i = 1, · · · , K.
One common choice of the generator function is:
g(u) =
Γ(
∑
K
i=1
α
i
)
u
∑
K
i=1
α
i
−1
f (u) (2)
where f (.) is the pdf of the variable u, as a result, we
can obtain a new expression of the pdf of Liouville
distribution:
p(X) =
Γ(
∑
K
i=1
α
i
)
u
∑
K
i=1
α
i
−1
f (u)
K
∏
i=1
X
α
i
−1
i
Γ(α
i
)
(3)
The Beta distribution, with its two shape parameters
allowing it to approximate any arbitrary distribution,
is a convenient option for u (Bouguila and Elguebaly,
2012). Nevertheless, in this particular context, an ex-
tended version of the Beta distribution, known as Mc-
Donald’s Beta (Manoj et al., 2013), includes three
shape parameters instead of the usual version’s two.
It can therefore fit data more flexibly. McDonald’s
Beta has the ability to accurately reflect skewness and
kurtosis in data due to its extra feature, which is very
useful when modeling real-world data (Forouzanfar
et al., 2023b). Furthermore, the third extra shape pa-
rameter adjusts tail weights and raises the entropy of
the generated distribution. For modeling the random
variable u in our study, we select the McDonald’s Beta
distribution, whose pdf is provided by (Manoj et al.,
2013):
f (u|α, β, λ) =
λu
αλ−1
(1 − u
λ
)
β−1
B(α, β)
(4)
with:
B(a, b) =
Γ(a)Γ(b)
Γ(a + b)
(5)
represents the Beta function and Γ(.) denotes the
Gamma function, u is a scalar where 0 ≤ u ≤ 1,
and α, β, λ > 0 We obtain the expression of the pdf
for our proposed distribution for work, which is the
McDonald’s Beta-Liouville distribution, by using the
McDonald’s Beta as the density function for u in
Eq(2), and injecting Eq(4) in Eq(3) by considering
u =
∑
K
k=1
X
k
. The full expression is given as follows:
p(X|α
1
, ··· , α
K
, α, β, λ) =
Γ(
∑
K
k=1
α
k
)Γ(α + β)
Γ(α)Γ(β)
λ
×
K
∑
k=1
X
k
!
(
αλ−
∑
K
k=1
α
k
)
1 −
K
∑
k=1
X
k
!
λ
β−1
×
K
∏
k=1
X
α
k
−1
k
Γ(α
k
)
(6)
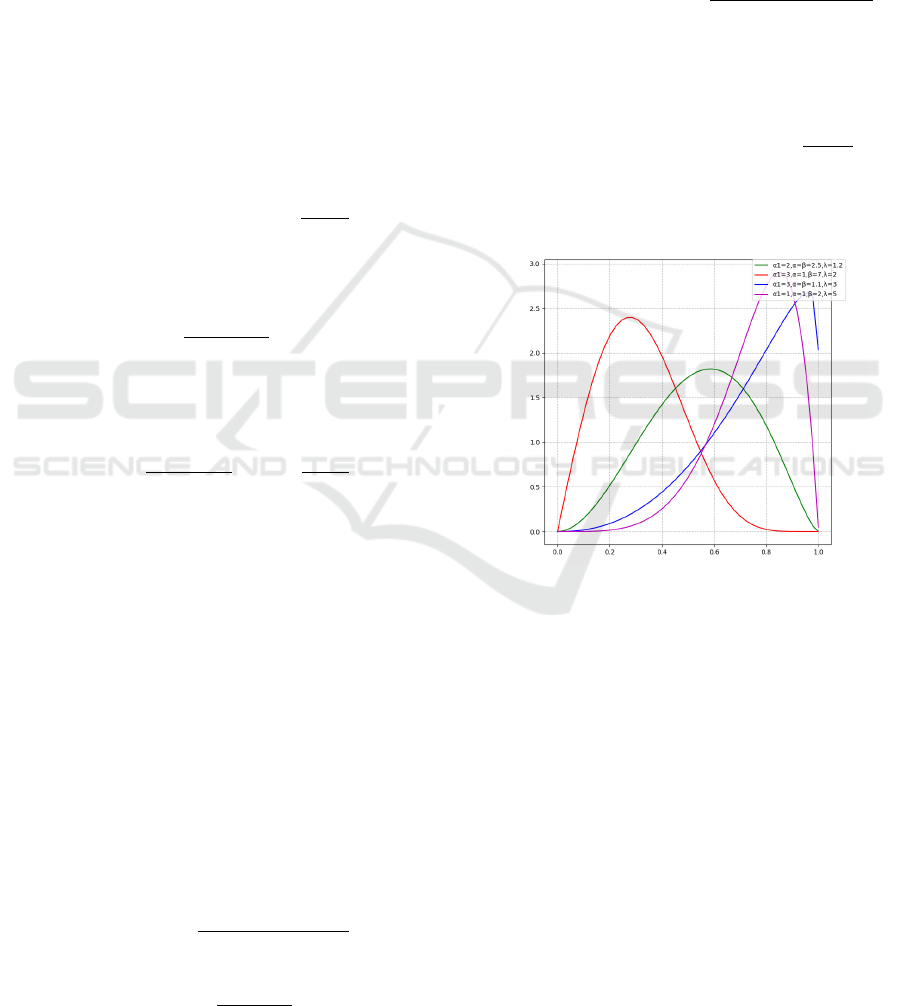
Figure(1) displays some examples of McDonald’s
Beta-Liouville distribution for different parameters.
.
Figure 1: McDonald’s Beta-Liouville Distribution.
4 MCDONALD’S
BETA-LIOUVILLE
NORMALITY SCORES
4.1 General Framework of the
Proposed Architecture
In this work, we highlight the application of a nor-
mality score in anomaly detection. The core notion of
this concept is as follows: Take into consideration X
as the totality of data samples, each labeled as ”Nor-
mal” or ”Anomaly”. A classifier named C(x) is to be
developed, and its objective is to take a sample x, re-
turn 1 if x is in the set of normal samples termed X,
and 0, otherwise. We must first construct a scoring
Uniting Mcdonald’s Beta and Liouville Distributions to Empower Anomaly Detection
183

function called n
s
(x) and compare its value to a preset
threshold known as λ in order to accomplish that. We
can conclude whether or not our sample is an abnor-
mality based on this comparison.
C
λ
s
(x) =
(
1 n
s
(x) ≥ λ
0 n
s
(x) < λ.
As determining an appropriate threshold value λ is
not the main challenge in this work, we will ignore
the limited binary decision problem and focus only
on the proper generation of the score function. We
need appropriate measures in order to evaluate the
score function for that. In our work, we determine
the trade-off of the normality score function by set-
ting the Area Under the Receiver Operating Charac-
teristic as our metric. The process starts by apply-
ing a collection of geometric adjustments in the form
of ∆ =
{
T
1
, T
2
, . . . T
K
}
to the input image data. We
can illustrate the efficacy of this kind of transforma-
tion by showing that it can retain the spatial details of
the normal sample, as the geometric structure of the
original image and its transformed counterpart will
be almost the same (Golan and El-Yaniv, 2018). We
build numerous neural networks based on dense lay-
ers followed by an auto-encoder for non-image data.
The usefulness of neural network-based dense layers,
which retain the structure of the vector data even af-
ter undergoing linear transformations, can be used to
support the choice to deploy them. The purpose of
the auto-encoder is to enhance feature extraction. The
output of this phase is the transformed data:
X
T
≜
(T
j
(x), j) : x ∈ X, T
j
∈ ∆
.
where j is the index of transformation, T
j
is the cor-
responding transformation, x is the given sample and
X is the set of normal samples. In this case, a new
label is assigned to each transformed sample which is
the index of transformation. Then, we fed the trans-
formed data to a deep classifier. In our study, we set
the Wide Residual Networks (WRN) (Zagoruyko and
Komodakis, 2016) as our classifier.
In the second stage of our proposed architecture,
we focus on building our normality scores for ev-
ery sample x ∈ X from the softmax prediction vec-
tor y(T
i
(x)) produced by the classifier for T
i
(x) (the
sample x being transformed by the i
th
transformation).
The normality scores function is the sum of the log-
likelihoods of the distributions of {y(T
i
(x))}
i=1,···,K
,
where K is the total number of transformations.
n
s
(x) =
K−1
∑
i=0
log p(y(T
i
(x))|T
i
) (7)
We decide to use McDonald’s Beta-Liouville distribu-
tion to approximate y(T
i
(x)). When data points range
from 0 to 1, it makes sense. In addition, its covari-
ance structure is stronger than that of traditional dis-
tributions like the Dirichlet. The McDonald’s Beta-
Liouville log-likelihood function is convex because it
belongs to the exponential family, making it simple to
identify the maximum. In order to estimate the dis-
tribution parameters, we create maximum likelihood
estimators using the modified normal data.
4.2 Mcdonald’s Beta-Liouville
Normality Scores Expression
In this section, we approximate y(T
i
(x)) with Mc-
Donald’s Beta-Liouville distribution: y(T
i
(x)) ∼
McDonald
′
sBL(θ
i
) with θ
i
= (α
i1
, ··· , α
iK
,
a
i1
, ··· , a
iK
, b
i1
, ··· , b
iK
, p
i1
, ··· , p
iK
). Injecting the
expression of McDonald’s BL pdf in Eq(6) into the
normality scores expression in Eq(7), we obtain the
following expression of n
s
(x):
n
s
(x) =
K−1
∑
i=0
log
Γ(
K−1
∑
k=0
˜
α
ik
)
!
+
K−1
∑
i=0
logΓ(
˜
α
i
+
˜
β
i
)
−
K−1
∑
i=0
log(Γ(
˜
α
i
)) −
K−1
∑
i=0
log
Γ(
˜
β
i
)
+
K−1
∑
i=0
log(
˜
λ
i
)
+
K−1
∑
i=0
˜
α
i
˜
λ
i
−
K−1
∑
k=0
˜
α
ik
!
log
K−1
∑
k=0
[y(T
i
(x))]
k
!
+
K−1
∑
i=0
(
˜
β
i
− 1)log
1 −
K−1
∑
k=0
[y(T
i
(x))]
k
!
˜
λ
i
+
K−1
∑
i=0
K−1
∑
k=0
(
˜
α
ik
− 1)log([y(T
i
(x))]
k
)
−
K−1
∑
i=0
K−1
∑
k=0
log(Γ(
˜
α
ik
)) (8)
the estimators of α
ik
, α
i
, β
i
, and λ
i
are denoted by the
following expressions:
˜
α
ik
,
˜
α
i
,
˜
β
i
, and
˜
λ
i
. The expres-
sion of n
s
(x) can be made simpler by removing all the
terms that are independent of the sample values. This
leaves us with:
n
s
(x) =
K−1
∑
i=0
˜
α
i
˜
λ
i
−
K−1
∑
k=0
˜
α
ik
!
log
K−1
∑
k=0
[y(T
i
(x))]
k
!
+
K−1
∑
i=0
(
˜
β
i
− 1)log
1 −
K−1
∑
k=0
[y(T
i
(x))]
k
!
˜
λ
i
+
K−1
∑
i=0
K−1
∑
k=0
(
˜
α
ik
− 1)log([y(T
i
(x))]
k
)−
K−1
∑
i=0
K−1
∑
k=0
log(Γ(
˜
α
ik
))
(9)
ICEIS 2025 - 27th International Conference on Enterprise Information Systems
184

Using the Fixed Point Iteration, the expressions of the
estimated parameters are the following at iteration t:
˜
α
ik
,t
= Ψ
−1
"
Ψ
K−1
∑
j=0
˜
α
jk
,t−1
!
+
1
N
N−1
∑
j=0
log(c
jk
)
−
1
N
N−1
∑
j=0
log
K−1
∑
m=0
c
jm
!#
, k = 0···K − 1 (10)
˜
α
i,t
= Ψ
−1
"
Ψ
˜
α
i,t−1
+
˜
β
i,t−1
+
˜
λ
i,t−1
N
N−1
∑
j=0
log
K−1
∑
k=0
c
jk
!#
(11)
˜
β
i,t
= Ψ
−1
"
Ψ
˜
α
i,t−1
+
˜
β
i,t−1
+
1
N
N−1
∑
j=0
log
1 −
K−1
∑
k=0
c
jk
!
˜
λ
i,t−1
#
(12)
˜
λ
,t
=
N
Q
(13)
where:
Q =
N−1
∑
j=0
(
˜
β
i,t−1
− 1)
log
∑
K−1
k=0
c
jk
∑
K−1
k=0
c
jk
˜
λ
i,t−1
1 −
∑
K−1
k=0
c
jk
˜
λ
i,t−1
−
1
N
N−1
∑
j=0
˜
α
i,t−1
log
K−1
∑
k=0
c
jk
!
(14)
with C = (c
jk
)
j=1···N,k=1···K
is the matrix where the
j
th
raw equals to y(T
i
(x
j
)), x
j
is the sample j in the
normal samples set X.
5 MCDONALD’S
BETA-LIOUVILLE FEATURE
MAPPING IN SVM
5.1 Support Vector Machines Classifier
SVM is a well-known and often used supervised
learning solution. Empirically, across numerous stud-
ies and applications, it has proven to have significant
generalization capabilities. SVMs are effective in de-
termining the optimal decision boundaries that max-
imize the margin between many classes in a dataset
(Cortes and Vapnik, 1995). The SVM optimization
problem’s primal representation is provided by:
min
w,b,ε
1
2
∥
w
∥
2
+C
∑
i
ε
i
(15)
subject to
y
(i)
(w
t
φ(X
i
) + b) > 1 − ε
i
, i = 1··· , N (16)
ε
i
> 0, i = 1··· , N (17)
where N is the number of samples, X
i
is the normal-
ized version of the i
th
sample in the data set, and y
i
is
the corresponding label.
In SVM, the regularization strength is controlled by
the hyperparameter C. It lessens the overfitting of the
model by applying a penalty to the misclassified data
points. It balances the trade-off between obtaining
a broader margin (lower complexity) and minimiz-
ing the classification error (higher complexity). The
feature mapping function from the input space χ to
the feature space H is denoted by φ(X
i
) in (16). If
no additional features are added or taken out of the
data, it is equal to the input data. Instead of being
< φ(X
i
), φ(X
j
) > in this instance, the kernel K - the in-
ner product between data points - becomes < X
i
, X
j
>.
The slack variable ε
i
is provided to solve the prob-
lem of non-lineary separated data, and
∑
i
ε
i
repre-
sents the upper bound of the generalization error. The
dual problem can be solved computationally for huge
datasets. When the constraints are loosened via La-
grange multipliers, the dual solution becomes,
max
γ
N
∑
i
γ
i
−
1
2
N
∑
i
N
∑
j
γ
i
γ
j
y
(i)
y
( j)
< φ(X
i
), φ(X
j
) >
(18)
subject to
0 < γ
i
< C,
N
∑
i
γ
i
y
(i)
= 0, i = 1··· , N (19)
In this case, the decision function of SVM becomes:
f (X) =
N
∑
i
γ
i
y
(i)
< φ(X
i
), φ(X) > (20)
5.2 Mcdonald’s Beta-Liouville SVM
Feature Mapping Function
This section focuses on selecting the feature mapping
function to solve the dual and primal problems, as
stated in (15) and (18), respectively. The selection
of φ(X ) for improved modeling is contingent upon
the data’s structure. Using the benefits of the Mc-
Donald’s Beta-Liouville distribution to model propor-
Uniting Mcdonald’s Beta and Liouville Distributions to Empower Anomaly Detection
185

tional data, the following can be used to create a po-
tential feature mapping function:
φ
j
(X
i
) =
X
i j
, j = 1, ··· , K
Γ(
∑
K
k=1
α
k
)Γ(α+β)
Γ(α)Γ(β)
λ
h
1 −
∑
K
k=1
X
ik
λ
i
β−1
×
∑
K
k=1
X
ik
(
αλ−
∑
K
k=1
α
k
)
×
∏
K
k=1
X
α
k
−1
ik
Γ(α
k
)
, j = K + 1
(21)
As can be seen from (21)’s suggested feature map-
ping function, the input dimension has risen by 1. Di-
versity is introduced into the data set by the new fea-
ture. Furthermore, it offers more information about
how the original characteristics were distributed over-
all. Sorting aberrant samples can be made easier with
this additional representation information. Newton
Raphson’s approach can be used to estimate the pa-
rameters using the initial input data set in a manner
similar to that described in (Nedaie and Najafi, 2018).
After obtaining the training parameters, we were able
to formulate McDonald’s Beta-Liouville SVM (Mc-
Donald’s BL SVM) in a novel way as follows:
min
w,b,ε
1
2
K+1
∑
k
w
2
k
+C
N
∑
i
ε
i
(22)
subject to
y
(i)
(w
t
φ(X
i
) + b) > 1 − ε
i
, i = 1··· , N (23)
ε
i
> 0, i = 1··· , N (24)
A new expression of McDonald’s BL SVM can be
formulated as follows:
min
w,b,ε
1
2
K+1
∑
k
w
2
k
+C
N
∑
i
ε
i
(25)
subject to
y
(i)
(
K
∑
k
w
k
X
ik
+ w
K+1
Γ(
∑
K
k=1
α
k
)Γ(α +β)
Γ(α)Γ(β)
λ×
K
∑
k=1
X
ik
!
(
αλ−
∑
K
k=1
α
k
)
1 −
K
∑
k=1
X
ik
!
λ
β−1
×
K
∏
k=1
X
α
k
−1
ik
Γ(α
k
)
> 1 − ε
i
, i = 1··· , N (26)
ε
i
> 0, i = 1··· , N (27)
6 EXPERIMENTAL RESULTS
6.1 Feature Mapping SVM Results
Three subsets of Fashion MNIST (Xiao et al., 2017)
data and three more from MNIST (Baldominos et al.,
2019) data served as the foundation for our analysis
in this section. We take 2000 samples from each of
the following classes: 1, 2, and 3 to serve as anomaly
classes for the three subsets, respectively (class 1 is
the anomaly class of the first subset, class 2 is the
anomaly class of the second subset, and class 3 is
the anomaly class of the third subset). We consider
the class 0 to be the normal class (10000 samples).
We thus set the anomalous rate to 16%. Using var-
ious SVM kernels, including Linear, RBF (Radial
Basis Function), and Polynomial kernels, we com-
pare the performance of our proposed method, Mc-
Donald’s Beta Liouville for feature mapping in SVM
(McDonald’s BL SVM), against baseline SVM and
two state-of-the-art benchmarking methods: Dirich-
let SVM (Dir SVM) and Beta-Liouville SVM (BL
SVM).
Our experiments on the Fashion MNIST dataset
revealed consistent improvements in classification
performance achieved by McDonald’s BL SVM
across different SVM kernels. Notably, when em-
ploying the Linear kernel, McDonald’s BL SVM out-
performed baseline SVM, Dir SVM, and BL SVM
across all classes, with F1 scores of 90.86% (Class
1), 89.7% (Class 2), and 73.41% (Class 3) com-
pared to 87.64%, 88.88%, 87.77%, and 84.03%,
89.3%, 89.3%, and 72.5%, 73.06%, 72.04%, respec-
tively. Under the RBF kernel, McDonald’s BL SVM
achieved even higher F1 scores, reaching 90.71%
(Class 1), 88.17% (Class 2), and 74.41% (Class 3),
surpassing baseline SVM, Dir SVM, and BL SVM.
Similarly, using the Polynomial kernel, McDonald’s
BL SVM demonstrated substantial improvements,
particularly in Class 2 (F1 score: 89.92%) outper-
forming baseline SVM, Dir SVM, and BL SVM.
McDonald’s BL SVM demonstrated better classifica-
tion performance on the MNIST dataset when com-
pared to benchmarking methods such as Dir SVM,
and baseline SVM for all SVM kernels. Its re-
markable performance with the Linear kernel was
especially noteworthy; McDonald’s BL SVM out-
performed baseline SVM, Dir SVM, and BL SVM,
achieving F1 scores of 97.01% (Class 1), 74.64%
(Class 2), and 76.57% (Class 3). Furthermore, Mc-
Donald’s BL SVM outperformed baseline SVM, Dir
SVM, and BL SVM with F1 scores of 97.96% (Class
1) and 82.66% (Class 3) using the RBF kernel. Mc-
Donald’s BL SVM demonstrated notable gains even
with the Polynomial kernel, especially in Class 1 (F1
score: 97.52%) and Class 2 (F1 score: 72.29%),
demonstrating how well it captures intricate correla-
tions in the data. This increase might be explained
by the McDonald’s Beta-Liouville distribution’s bet-
ter generalization capabilities, which allow it to repre-
ICEIS 2025 - 27th International Conference on Enterprise Information Systems
186
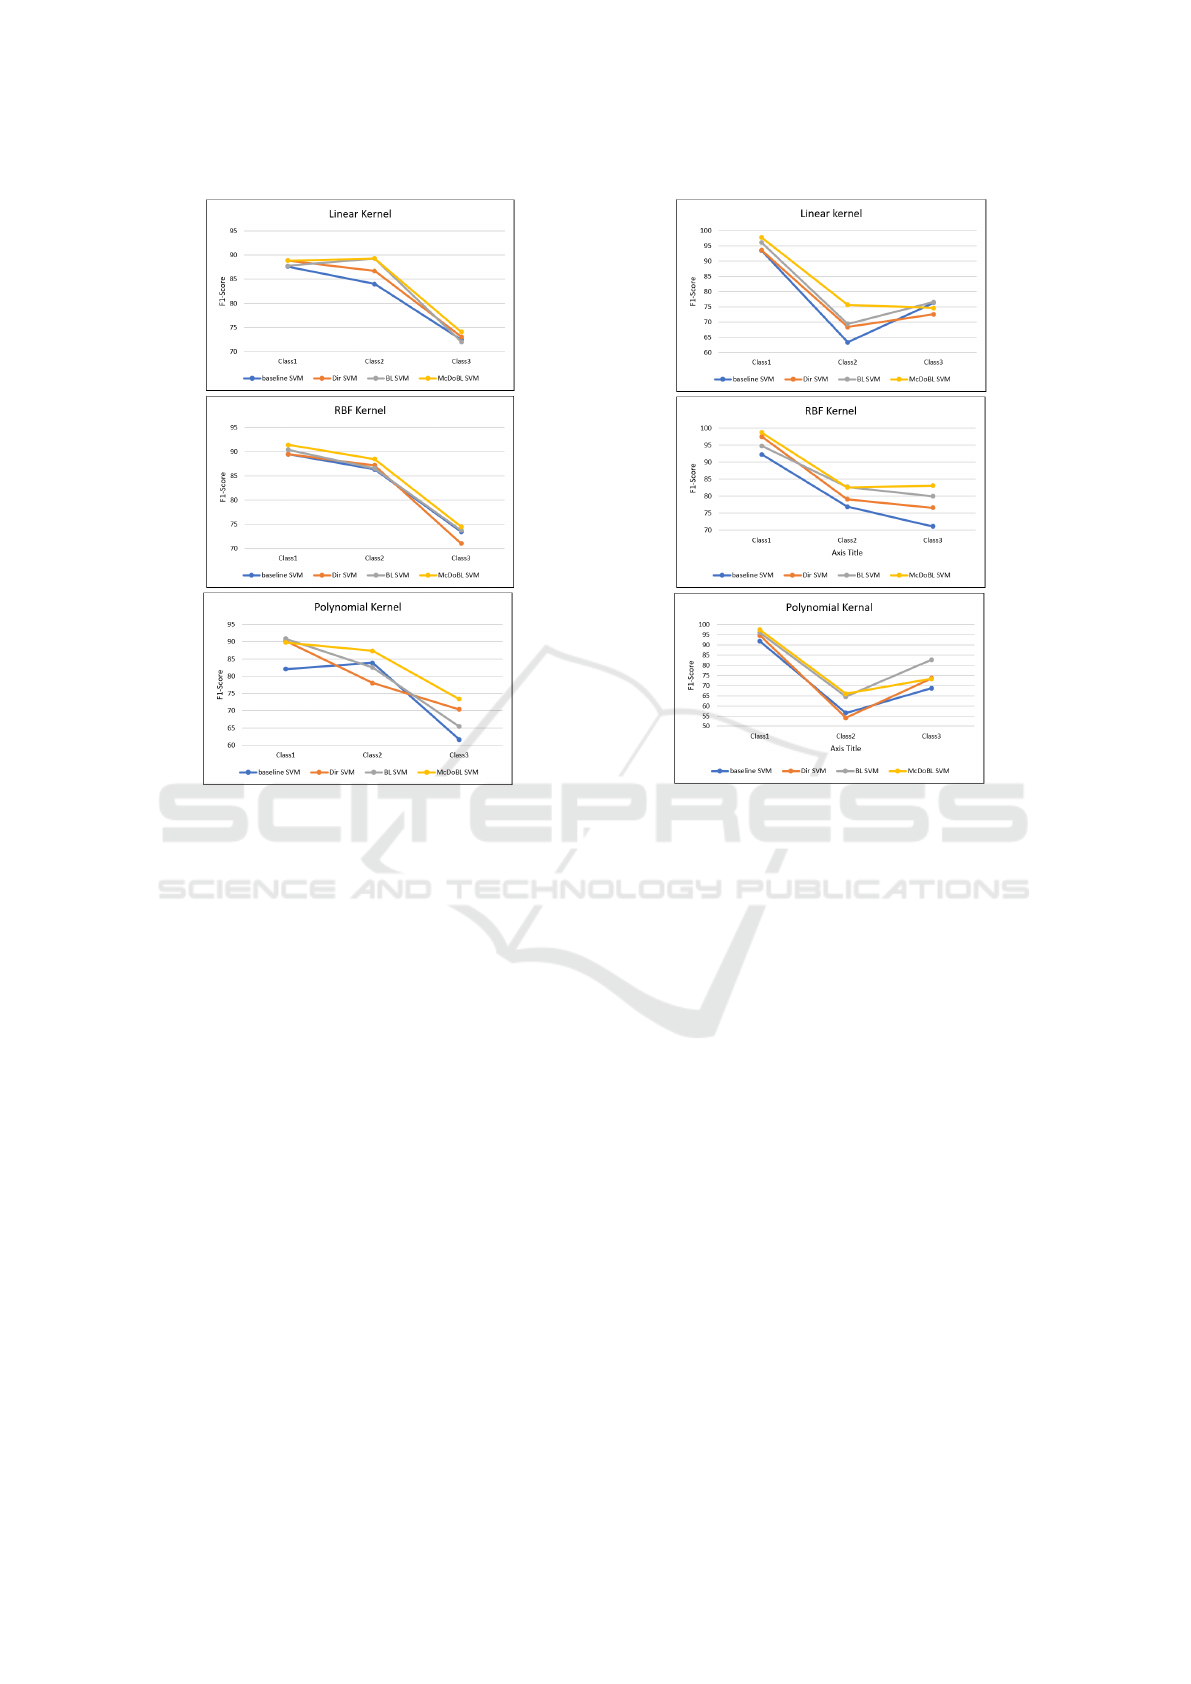
Figure 2: F1 score over subsets for the different approaches
on Fashion MNIST Data Set.
sent data distribution with a higher coherence covari-
ance structure.
Another data set used in our work to measure the per-
formance of our feature mapping strategy for SVM is
the bank data used previously in (Sghaier et al., 2024).
Table 1 shows that McDonald’s BLSVM performs
better than baseline SVM, BLSVM, and DSVM for
all kernels. For linear SVM, McDonald’s BLSVM
achieves the hightest scores marking 99.69 as ac-
curacy and 99.81 as f1 score. Also, McDonald’s
BLSVM provides the highest accuracy of 97.42 and
the highest f1 score of 98.45 when taking into account
the RBF SVM.
6.2 Normality Scores Results
In this part, we apply our suggested McDonald’s BL
normality scores method to the NSL-KDD Cup and
the MNIST image data sets. To simplify the work, we
restrict the label names for the NSL-KDD Cup dataset
to just two classes: the attack class, which consists of
all labels that deviate from the normal class. As a re-
sult, the final labels are the attack class and the normal
class. We assess the effectiveness of our approach by
comparing the normality scores based on the McDon-
Figure 3: F1 score over subsets for the different approaches
on MNIST Data Set.
ald’s BL distribution with those based on the Dirichlet
and Beta-Liouville distributions, as well as two base-
line methods: the Convolutional AutoEncoder One-
Class Support Vector Machine (CAE OCSVM) and
the Raw One-Class Support Vector Machine (RAW-
OCSVM) (Deecke et al., 2019),(Zhai et al., 2016).
We have selected Wide Residual Networks
(WRN) (Zagoruyko and Komodakis, 2016) as the
classifier for our architecture. Its width is set to 8,
and its depth to 16. In addition, the OCSVM hyper-
parameters were changed to ν ∈
{
0.1, ··· , 0.9
}
and
γ ∈
2
−7
, 2
−6
, ··· , 2
2
.
Table 2 displays the performance of various ap-
proaches for normality scores, as measured by AU-
ROC, using the MNIST data set. Take note that the
one-vs-all strategy was the evaluation method em-
ployed in our trials. It views one class as abnormal
and the other classes as typical. Based on the out-
comes in the three tables, we can verify that Dirichlet,
McDonald’s Beta-Liouville, and Beta-Liouville per-
form better than the baseline methods. This supports
(our hypotheses) that distributions with higher dis-
criminating power between data specified on a sim-
plex are those such as McDonald’s Beta-Liouville and
Beta-Liouville.
Uniting Mcdonald’s Beta and Liouville Distributions to Empower Anomaly Detection
187

Table 1: F1 score and Accuracy for different kernels on Bank Data Set.
Kernel Linear RBF Polynomial
Approach F1 Score Accuracy F1 Score Accuracy F1 Score Accuracy
Baseline SVM 94.86 91.95 94.97 92.11 90.87 86.22
DSVM 94.77 91.82 97.65 96.08 79.93 72.45
BLSVM 94.77 91.82 97.68 96.15 87.51 81.72
McDonald’s BL SVM 99.81 99.69 98.45 97.42 93.21 89.54
Table 2: AUC of anomaly detection-based normality score techniques for MNIST dataset. In each method, the model was
trained on a single class and tested on the rest. The best performing method in each row appears in bold.
Raw-OC-SVM CAE-OC-SVM Dirichlet Beta-Liouville McDonald’s Beta-Liouville
0 99.54 97.25 91.4 88.99 91.31
1 99.91 99.28 85.5 73.78 93.46
2 88.5 82.33 99.4 99.31 98.65
3 89.07 76.14 96.01 95.96 99.0
4 95.46 79.39 98.72 96.69 99.11
5 91.17 78.35 98.35 97.82 99.65
6 97.06 86.69 99.9 99.9 99.9
7 95.05 86.83 95.58 94.94 95.91
8 86.47 74.41 92.94 93.19 88.29
9 96.3 92.48 99.09 98.91 98.44
mean 93.85 85.31 95.68 93.94 96.37
Table 3: AUC of anomaly detection-based normality score techniques for NSL-KDD Cup dataset. In each method, the model
was trained on a single class and tested on the rest. The best performing method in each row appears in bold.
Dirichlet Beta-Liouville McDonald’s Beta-Liouville
Normal 75.62 75.12 83.12
Attack 76.91 81.59 81.72
mean 76.26 78.35 82.42
As seen in Table 2, the McDonald’s Beta-
Liouville (McDonald’s BL) normality score
(AUC=96.17) for the MNIST data set is better
than the Dirichlet normality score (AUC=95.68),
Beta-Liouville normality scores (AUC=93.94),
RAW OCSVAM (AUC=93.85), and CAE OCSVM
(AUC=85.31). Moreover, McDonald’s BL has the
highest scores for five of the ten classes (3,4,5,6,7),
achieving an AUC=99.9 for class 6. Even yet, Dirich-
let excels in three classes: 2,4,9, whereas class 8
has the highest AUC=93.19 based on Beta-Liouville
measurement.
The AUC results by Dirichlet, BL, and McDon-
ald’s BL on the NSL-KDD Cup data set are shown
in Table 3. With a 4% difference in AUC from the
nearest score (AUC = 82.42 for McDonald’s BL to
AUC = 78.35 and AUC = 76.26 for BL and Dirich-
let, respectively), McDonald’s BL performs well in
both classes, as this table illustrates. The McDonald’s
BL normalcy score for the attack class yields an AUC
of 81.72, while BL comes in second with 81.59. We
may observe that Dirichlet and BL perform similarly
for the Normal class in the normal class. Additionally,
we observe that McDonald’s BL (83.12, a difference
of 7% from the nearest score) shows a very high score
in comparison to other distributions.
7 CONCLUSION
The development of discriminative algorithms for
proportional data modeling and anomaly detection
tasks was the main objective of this paper. The Mc-
Donald’s Beta-Liouville distribution, which is derived
from the Liouville family and includes the Dirich-
let as a particular example, served as the foundation
for these methods. The McDonald’s Beta-Liouville
distribution, which is used to effectively statistically
represent the properties of the data, is another ad-
vantage of these techniques. This distribution is pri-
marily driven by the large number of data mining,
pattern recognition, and computer vision applications
that naturally generate this type of data. In particu-
lar, we proposed a deep anomaly detection architec-
ture based on normality score that uses McDonald’s
Beta-Liouville to approximate the classifier’s soft-
ICEIS 2025 - 27th International Conference on Enterprise Information Systems
188

max output vector predictions. Three feature map-
ping functions for proportional data have been added
to the SVM learning algorithm in the second and fi-
nal approach. Above all, the findings of the two
approaches have clearly shown that the McDonald’s
Beta-Liouville can be a good alternative to the re-
cently proposed Beta-Liouville, as it performs better
than the widely used Dirichlet. Nevertheless, signif-
icant drawbacks include presumptions regarding the
alignment of the data distribution, possible difficul-
ties in generalizing to different types of data, and is-
sues with computing complexity in large-scale appli-
cations. Future research may focus on creating hybrid
generative discriminative techniques using SVM ker-
nels produced from McDonald’s Beta-Liouville mix-
ture models.
ACKNOWLEDGEMENT
The completion of this research was made possible
thanks to Natural Sciences and Engineering Research
Council of Canada (NSERC) and Fonds de recherche
du Quebec.
REFERENCES
Amirkhani, M., Manouchehri, N., and Bouguila, N. (2021).
Birth-death MCMC approach for multivariate beta
mixture models in medical applications. In Fujita,
H., Selamat, A., Lin, J. C., and Ali, M., editors,
Advances and Trends in Artificial Intelligence. Arti-
ficial Intelligence Practices - 34th International Con-
ference on Industrial, Engineering and Other Appli-
cations of Applied Intelligent Systems, IEA/AIE 2021,
Kuala Lumpur, Malaysia, July 26-29, 2021, Proceed-
ings, Part I, volume 12798 of Lecture Notes in Com-
puter Science, pages 285–296. Springer.
Baldominos, A., Saez, Y., and Isasi, P. (2019). A survey
of handwritten character recognition with mnist and
emnist. Applied Sciences, 9(15):3169.
Bouguila, N. (2012a). Hybrid generative/discriminative ap-
proaches for proportional data modeling and classifi-
cation. IEEE Transactions on Knowledge and Data
Engineering, 24(12):2184–2202.
Bouguila, N. (2012b). Infinite liouville mixture models with
application to text and texture categorization. Pattern
Recognit. Lett., 33(2):103–110.
Bouguila, N. and Elguebaly, T. (2012). A fully bayesian
model based on reversible jump MCMC and finite
beta mixtures for clustering. Expert Syst. Appl.,
39(5):5946–5959.
Bouguila, N. and Ziou, D. (2005a). Mml-based approach
for finite dirichlet mixture estimation and selection. In
Perner, P. and Imiya, A., editors, Machine Learning
and Data Mining in Pattern Recognition, 4th Interna-
tional Conference, MLDM 2005, Leipzig, Germany,
July 9-11, 2005, Proceedings, volume 3587 of Lecture
Notes in Computer Science, pages 42–51. Springer.
Bouguila, N. and Ziou, D. (2005b). On fitting finite dirich-
let mixture using ECM and MML. In Wang, P., Singh,
M., Apt
´
e, C., and Perner, P., editors, Pattern Recogni-
tion and Data Mining, Third International Conference
on Advances in Pattern Recognition, ICAPR 2005,
Bath, UK, August 22-25, 2005, Proceedings, Part I,
volume 3686 of Lecture Notes in Computer Science,
pages 172–182. Springer.
Bouguila, N. and Ziou, D. (2005c). Using unsupervised
learning of a finite dirichlet mixture model to improve
pattern recognition applications. Pattern Recognit.
Lett., 26(12):1916–1925.
Bouguila, N. and Ziou, D. (2006). Online clustering via
finite mixtures of dirichlet and minimum message
length. Eng. Appl. Artif. Intell., 19(4):371–379.
Chandola, V., Banerjee, A., and Kumar, V. (2009).
Anomaly detection: A survey. ACM Comput. Surv.,
41(3).
Cortes, C. and Vapnik, V. (1995). Support-vector networks.
Machine Learning, 20:273–297.
Deecke, L., Vandermeulen, R., Ruff, L., Mandt, S., and
Kloft, M. (2019). Image anomaly detection with
generative adversarial networks. In Machine Learn-
ing and Knowledge Discovery in Databases: Euro-
pean Conference, ECML PKDD 2018, pages 3–17.
Springer.
Epaillard, E. and Bouguila, N. (2016). Proportional data
modeling with hidden markov models based on gen-
eralized dirichlet and beta-liouville mixtures applied
to anomaly detection in public areas. Pattern Recog-
nit., 55:125–136.
Epaillard, E. and Bouguila, N. (2019). Variational bayesian
learning of generalized dirichlet-based hidden markov
models applied to unusual events detection. IEEE
Transactions on Neural Networks and Learning Sys-
tems, 30(4):1034–1047.
Erfani, S. M., Rajasegarar, S., Karunasekera, S., and Leckie,
C. (2016). High-dimensional and large-scale anomaly
detection using a linear one-class svm with deep learn-
ing. Pattern Recognition, 58:121–134.
Fan, W. and Bouguila, N. (2012). Online variational fi-
nite dirichlet mixture model and its applications. In
2012 11th International Conference on Information
Science, Signal Processing and their Applications
(ISSPA), pages 448–453.
Fan, W. and Bouguila, N. (2013). Learning finite beta-
liouville mixture models via variational bayes for pro-
portional data clustering. In Rossi, F., editor, IJ-
CAI 2013, Proceedings of the 23rd International Joint
Conference on Artificial Intelligence, Beijing, China,
August 3-9, 2013, pages 1323–1329. IJCAI/AAAI.
Fan, W., Bouguila, N., and Ziou, D. (2011). Unsupervised
anomaly intrusion detection via localized bayesian
feature selection. In 2011 IEEE 11th International
Conference on Data Mining, pages 1032–1037.
Uniting Mcdonald’s Beta and Liouville Distributions to Empower Anomaly Detection
189

Fan, W., Sallay, H., and Bouguila, N. (2017). Online
learning of hierarchical pitman–yor process mixture
of generalized dirichlet distributions with feature se-
lection. IEEE Transactions on Neural Networks and
Learning Systems, 28(9):2048–2061.
Fang, K. W. (2018). Symmetric multivariate and related
distributions. CRC Press.
Forouzanfar, D., Manouchehri, N., and Bouguila, N.
(2023a). Bayesian inference in infinite multivari-
ate mcdonald’s beta mixture model. In Rutkowski,
L., Scherer, R., Korytkowski, M., Pedrycz, W.,
Tadeusiewicz, R., and Zurada, J. M., editors, Artificial
Intelligence and Soft Computing - 22nd International
Conference, ICAISC 2023, Zakopane, Poland, June
18-22, 2023, Proceedings, Part II, volume 14126 of
Lecture Notes in Computer Science, pages 320–330.
Springer.
Forouzanfar, D., Manouchehri, N., and Bouguila, N.
(2023b). Finite multivariate mcdonald’s beta mix-
ture model learning approach in medical applica-
tions. In Hong, J., Lanperne, M., Park, J. W., Cern
´
y,
T., and Shahriar, H., editors, Proceedings of the
38th ACM/SIGAPP Symposium on Applied Comput-
ing, SAC 2023, Tallinn, Estonia, March 27-31, 2023,
pages 1143–1150. ACM.
Forouzanfar, D., Manouchehri, N., and Bouguila, N.
(2023c). A fully bayesian inference approach for mul-
tivariate mcdonald’s beta mixture model with feature
selection. In 9th International Conference on Control,
Decision and Information Technologies, CoDIT 2023,
Rome, Italy, July 3-6, 2023, pages 2055–2060. IEEE.
Golan, I. and El-Yaniv, R. (2018). Deep anomaly detec-
tion using geometric transformations. In Advances
in Neural Information Processing Systems (NeurIPS),
volume 31.
Hosseinzadeh, M., Rahmani, A. M., Vo, B., Bidaki, M.,
Masdari, M., and Zangakani, M. (2021). Improving
security using svm-based anomaly detection: issues
and challenges. Soft Computing, 25:3195–3223.
Hu, C., Fan, W., Du, J., and Bouguila, N. (2019). A novel
statistical approach for clustering positive data based
on finite inverted beta-liouville mixture models. Neu-
rocomputing, 333:110–123.
Liu, F. T., Ting, K. M., and Zhou, Z.-H. (2008). Isolation
forest. In 2008 Eighth IEEE International Conference
on Data Mining, pages 413–422.
Manoj, C., Wijekoon, P., and Yapa, R. D. (2013). The mc-
donald generalized beta-binomial distribution: A new
binomial mixture distribution and simulation based
comparison with its nested distributions in handling
overdispersion. International Journal of Statistics and
Probability, 2(2):24.
Nedaie, A. and Najafi, A. A. (2018). Support vector ma-
chine with dirichlet feature mapping. Neural Net-
works, 98:87–101.
Nguyen, H., Azam, M., and Bouguila, N. (2019). Data
clustering using variational learning of finite scaled
dirichlet mixture models. In 2019 IEEE 28th Inter-
national Symposium on Industrial Electronics (ISIE),
pages 1391–1396.
Oboh, B. S. and Bouguila, N. (2017). Unsupervised learn-
ing of finite mixtures using scaled dirichlet distribu-
tion and its application to software modules catego-
rization. In 2017 IEEE International Conference on
Industrial Technology (ICIT), pages 1085–1090.
Qiu, C., Pfrommer, T., Kloft, M., Mandt, S., and Rudolph,
M. (2021). Neural transformation learning for deep
anomaly detection beyond images. In Proceedings of
the International Conference on Machine Learning,
pages 8703–8714. PMLR.
Rahman, M. H. and Bouguila, N. (2021). Efficient feature
mapping in classifying proportional data. IEEE Ac-
cess, 9:3712–3724.
Scholkopf, B. and Smola, A. J. (2002). Learning with Ker-
nels: Support Vector Machines, Regularization, Opti-
mization, and Beyond. MIT Press, Cambridge, MA.
Sefidpour, A. and Bouguila, N. (2012). Spatial color im-
age segmentation based on finite non-gaussian mix-
ture models. Expert Syst. Appl., 39(10):8993–9001.
Sghaier, O., Amayri, M., and Bouguila, N. (2023). Mul-
tivariate beta normality scores approach for deep
anomaly detection in images using transformations.
In 2023 IEEE International Conference on Systems,
Man, and Cybernetics (SMC), pages 3428–3433.
Sghaier, O., Amayri, M., and Bouguila, N. (2024).
Libby-novick beta-liouville distribution for enhanced
anomaly detection in proportional data. ACM Trans.
Intell. Syst. Technol., 15(5):107:1–107:26.
Topham, L. K., Khan, W., Al-Jumeily, D., Waraich, A., and
Hussain, A. J. (2022). Gait identification using limb
joint movement and deep machine learning. IEEE Ac-
cess, 10:100113–100127.
Wong, T. T. (1998). Generalized dirichlet distribution in
bayesian analysis. Applied Mathematics and Compu-
tation, 97(2–3):165–181.
Xiao, H., Rasul, K., and Vollgraf, R. (2017). Fashion-
mnist: A novel image dataset for benchmark-
ing machine learning algorithms. arXiv preprint
arXiv:1708.07747.
Zagoruyko, S. and Komodakis, N. (2016). Wide residual
networks. arXiv preprint arXiv:1605.07146.
Zamzami, N., Alsuroji, R., Eromonsele, O., and Bouguila,
N. (2020). Proportional data modeling via selection
and estimation of a finite mixture of scaled dirichlet
distributions. Comput. Intell., 36(2):459–485.
Zhai, S., Cheng, Y., Lu, W., and Zhang, Z. (2016). Deep
structured energy based models for anomaly detec-
tion. In Proceedings of the International Conference
on Machine Learning, pages 1100–1109. PMLR.
Zhang, Y., Nie, X., He, R., Chen, M., and Yin, Y. (2020).
Normality learning in multispace for video anomaly
detection. IEEE Transactions on Circuits and Systems
for Video Technology, 31(9):3694–3706.
ICEIS 2025 - 27th International Conference on Enterprise Information Systems
190
