
GAna: Model Generators and Data Analysts for Streamlined Processing
Stephanie C. Fendrich
1 a
, Philipp Fl
¨
ugger
1 b
, Annegret Janzso
1 c
, David Kaub
1 d
,
Stefan Klein
1 e
, Anna Kravets
1 f
, Patrick Mertes
1 g
, Nhat Tran
1 h
, Jan Ole Berndt
1 i
and Ingo J. Timm
1,2 j
1
Cognitive Social Simulation, German Research Center for Artificial Intelligence, 54296 Trier, Germany
2
Business Informatics, Trier University, Universitaetsring 15, 54296 Trier, Germany
fl
Keywords:
Data Processing, Workflow, Explainable AI, Transparency, Agent-Based Modeling, Simulation.
Abstract:
In the evolving landscape of Explainable AI, reliable and transparent data processing is essential to ensure
trustworthiness in model development. While agent-based modeling and simulation are used to provide in-
sights into complex systems, this becomes vital when applying results to decision-making processes. This
paper presents the GAna workflow — an approach that integrates model generation and data analysis to
streamline the workflow from data preprocessing to result interpretation. By automating data handling and fa-
cilitating the reuse of processed and generated data, the GAna workflow significantly reduces the manual effort
and computational expense typically associated with creating synthetic populations and other data-intensive
tasks. We demonstrate the effectiveness of the workflow through two distinct case studies, highlighting its
potential to enhance transparency in AI applications.
1 INTRODUCTION
In the shift towards Explainable AI, transparency and
trustworthiness are key principles. Simulation-based
approaches, such as Agent-Based Modeling (ABM)
contribute to these principles, as decisions made by
agents are usually based on clear decision rules,
mostly derived from empirically grounded theories,
such as from psychology or sociology. Furthermore,
the individualized consideration of agents can help
explain which factors influence decision-making and,
through emergence, can lead to the overall behav-
ior of a population under consideration at the macro
level. This allows outputs to be backtracked and pro-
cesses to be more explainable by following the steps
taken in the simulated environment, based on the di-
a
https://orcid.org/0000-0002-5168-3564
b
https://orcid.org/0009-0000-8063-537X
c
https://orcid.org/0009-0000-0431-3766
d
https://orcid.org/0009-0002-4092-7188
e
https://orcid.org/0009-0009-5126-5491
f
https://orcid.org/0009-0007-3354-4935
g
https://orcid.org/0009-0004-3954-4176
h
https://orcid.org/0009-0009-2476-0593
i
https://orcid.org/0000-0001-7241-3291
j
https://orcid.org/0000-0002-3369-813X
rectly specified parameters. In the following, men-
tions of models typically refer to ABM, unless other-
wise specified.
Over the last decades, there has been a significant
increase in the use of ABM in various disciplines,
such as social sciences, behavioral sciences, urban
land-use modeling, or spatial sciences. For instance,
ABMs have been employed to study social behaviors
and dynamics (Asgharpour et al., 2010; Hedstr
¨
om and
Manzo, 2015), land-use patterns (Huang et al., 2014;
Matthews et al., 2007) and spatial processes (Torrens,
2010). Ensuring that models are understandable and
their processes are clear is essential for building trust
in their outcomes, particularly in real-world applica-
tions like these.
In the context of ABM, this is especially relevant
to how data are handled, as transparent data prepara-
tion and reuse can significantly impact the reliability
and interpretability of the model. Hence, the majority
of time spent in ABM is often directed towards data
preparation and analysis rather than the design and
implementation of the models themselves (cf. Lee
et al. 2015; Munson 2012). Thus, by automating these
phases, the entire development process, from design
to dissemination, can be made more efficient. For ex-
ample, by reusing components such as (preprocessed)
synthetic population data or infrastructure modules,
608
Fendrich, S. C., Flügger, P., Janzso, A., Kaub, D., Klein, S., Kravets, A., Mertes, P., Tran, N., Berndt, J. O. and Timm, I. J.
GAna: Model Generators and Data Analysts for Streamlined Processing.
DOI: 10.5220/0013165600003890
In Proceedings of the 17th International Conference on Agents and Artificial Intelligence (ICAART 2025) - Volume 3, pages 608-618
ISBN: 978-989-758-737-5; ISSN: 2184-433X
Copyright © 2025 by Paper published under CC license (CC BY-NC-ND 4.0)

researchers can reduce the resources required for data
preparation in models with similar elements. This
reuse, thus, allows a greater focus on refining the
models and interpreting their results.
In this paper, we propose the GAna (Model
Generators and Data Analysts) workflow, which aims
to streamline both preprocessing and postprocessing
of data in the modeling process. By including these
steps in the overall application, it becomes easier to
backtrack the computational processes determining
results, thereby increasing explainability and promot-
ing reproducibility. Due to the automation of pro-
cesses that are often manual, this concept is less prone
to human error. Additionally, both of these aspects are
likely to increase user trust in the completed model,
thereby increasing acceptance. Moreover, this im-
proves the efficiency of the overall workflow, allow-
ing for faster and cleaner results at every step. The
development of intelligent model generators and data
analysts can be applied to a wide range of practical
applications. While we mainly focus on the bene-
fits of such a workflow for ABM and especially social
simulation, it is possible to transfer the concept to ad-
ditional fields such as Natural Language Processing.
The straightforward approach allows for quick adjust-
ments to individual components, allowing for the ex-
change of data, required formats, and model types.
The following Section 2 details the baseline upon
which the concept has been built, focusing on simi-
lar previous approaches and tools, as well as a gen-
eral overview of methods to enhance reproducibil-
ity and efficiency in simulation experiments. Subse-
quently, Section 3 formally introduces the workflow
concept by discussing the functionalities of the com-
ponents within the workflow, as well as requirements
for those components. In Section 4 the practical use
of the concept is highlighted, featuring two projects as
case studies which successfully make use of the core
components in the workflow - model generators and
data analysts. These projects focus on different top-
ics, with AKRIMA dealing with crisis management,
and GreenTwin focusing on last-mile logistics. This
demonstrates how the GAna workflow is applicable
to a variety of projects in ABM contexts. Finally, re-
sults and limitations are discussed in Section 5, with
an outlook on future work.
2 ENHANCING
REPRODUCIBILITY IN
SIMULATION EXPERIMENTS
The increasing use of simulation experiments across
various research fields presents several challenges.
One of these challenges is bridging the gap between
the technical knowledge of developers, who design
and implement the models, and the domain-specific
expertise—such as in the social or economic sci-
ences—held by experts in those fields. This gap often
leads to errors, particularly during the manual cus-
tomization of models, which in turn affects the re-
producibility of experiments. Consequently, there is
a growing need for systematic methodologies to en-
hance reproducibility, aligning with the broader ob-
jectives of enhancing transparency and accountability
in computational science. According to Dalle (2012),
both technical and human-related factors hinder re-
producibility. An additional challenge lies in the in-
consistent and sometimes careless use of the term ”re-
producibility” itself. Careful attention must be paid
to the correct usage of the term to prevent misunder-
standings, as the related terminology is not consis-
tently defined (Feitelson, 2015).
To mitigate these issues, automation is empha-
sized as a critical solution, reducing human interven-
tion and thereby minimizing the risk of errors in simu-
lation studies. Reproducibility in modeling and simu-
lation is inherently limited, which is why Taylor et al.
(2018) differentiate between the “art” and “science”
of simulation. They argue that while the scientific el-
ements of models—such as data collection and com-
putational modules—are often reproducible, the artis-
tic aspects, like conceptual modeling, rely heavily on
tacit knowledge and are therefore less reproducible.
Nevertheless, reproducibility remains critical for en-
suring scientific rigor in modeling and simulation.
Without it, research findings may lack credibility and
broader applicability. As a result, reproducibility has
become a widely recognized best practice in science
(Feger and Wo
´
zniak, 2022). Challenges to achieving
full reproducibility include legal restrictions, evolving
software platforms, and the inherent complexities of
model construction. Taylor et al. (2018) suggest that
while full reproducibility may not always be attain-
able, improved documentation, open access practices,
and standardization can significantly enhance trans-
parency and accountability in the field. Effective doc-
umentation is especially crucial, as poor documenta-
tion is often the primary reason experiments cannot
be reproduced (Raghupathi et al., 2022). Therefore,
addressing these challenges requires thorough docu-
mentation of the processes behind data creation.
Provenance, as highlighted by Herschel et al.
(2017), ensures that data processing steps are trans-
parent, reproducible, and verifiable, which enhances
the reliability of AI models. Provenance documents
how data are created, manipulated, and interpreted,
allowing users to trace each step and validate the re-
sults. Ruscheinski and Uhrmacher (2017) identify key
GAna: Model Generators and Data Analysts for Streamlined Processing
609

gaps in current provenance methodologies and pro-
pose a model to bridge these gaps by effectively doc-
umenting and managing the processes behind simula-
tion models and data. In further research, Ruscheinski
et al. (2018) present advancements in the application
of the PROV Data Model (PROV-DM) to simulation
models, proposing a PROV ontology to capture the
provenance of these models. While earlier research
primarily focused on documenting the provenance of
simulation data, this work shifts the focus to the mod-
els themselves, addressing the complexities of model
development. The authors emphasize the importance
of documenting the entire process of model genera-
tion, including the relationships between data, simu-
lation experiments, and model refinements, ensuring
that each step is traceable and verifiable. By leverag-
ing PROV-DM, they provide a framework for identi-
fying and relating the entities and activities involved
in the development of a simulation model.
Beyond the approach presented, there are addi-
tional, more technical methods for designing simu-
lation experiments. Teran-Somohano et al. (2015),
demonstrate a model-driven approach, offering web-
based assistance for creating simulation experiments.
This allows experts from various domains to design
experiments without needing expertise in experimen-
tal design or specialized knowledge. Another ap-
proach involves using schemas to describe an exper-
iment, which are then mapped to executable code
(Wilsdorf et al., 2019). When models from different
domains already exist, it is possible to merge them.
Pierce et al. (2018) present an iterative approach for
such a procedure. Additionally, existing models from
previous studies can be adapted to the specific con-
ditions of a new study (Wilsdorf et al., 2021). These
approaches support both model development and the
documentation of experiments.
GAna aims to increase reproducibility and effi-
ciency by structuring and automating operations with
data for pre- and postprocessing, e.g., enabling trans-
fer to other regions, domains and models (see also
(Skoogh and Johansson, 2008)). The presented ap-
proach focuses on improving both the efficiency and
quality of input and output data management in sim-
ulation contexts. By streamlining the identification,
collection, and preparation of data, it helps address
common challenges in these areas, ensuring that data
used in simulations is reliable and of high quality.
3 THE GAna WORKFLOW
In this section, we present the GAna workflow, which
outlines key steps ranging from selecting data in-
puts and processing them for use in the evaluation
and analysis of simulation models. Our group works
on cognitive social systems that include important
recurring components in modeling, such as popula-
tion structures, daily routines (e.g., job assignments)
and infrastructure setup. To streamline future devel-
opments, the value of reusable components through
automation and process structuring has become ap-
parent over time. The structuring of components in
this approach simplifies the integration and reuse of
generators and analysts in the modeling process and
ensures detailed documentation of input and output
files. The group recognizes that different use cases
require different levels of detail and therefore empha-
sizes the importance of modularity in the initial setup
and adaptation. By creating common and meaning-
ful interfaces, the group aims to improve interoper-
ability and adaptability in future modeling contexts.
These concepts, originally developed in the AKRIMA
project, and later applied in the GreenTwin project as
a second use case to demonstrate their wider applica-
bility and potential for continued development.
First, we describe the general workflow structure
in its entirety. Subsequently, we focus on each com-
ponent in the workflow, introduce its functionalities,
and discuss requirements that should be met when im-
plementing the approach. Since the needs of different
working groups or projects will vary, the formulated
requirements and how they can be achieved and vali-
dated might need to be extended or adapted.
The upper half of Figure 1 displays the steps of the
GAna workflow, consisting of the components: data,
model generator, model, data analyst and output. The
data input, further discussed in Section 3.1, is criti-
cal and is tailored both to the model’s data require-
ments and the hypotheses being tested. The raw input
data are used by model generators. A model genera-
tor’s purpose is to process incoming data, which often
originate from several data sources, and prepare these
for use in the respective model. Further details on
the generator’s function and structure are described
in Section 3.2. The prepared and processed data are
handed over to the respective (simulation) model (see
Section 3.3), where the model output is generated,
which can be further processed by data analysts. A
data analyst’s aim is to structure and summarize the
model output. This data postprocessing step prepares
the results for hypothesis testing and the creation of
visual aids (see Section 3.4). The GAna workflow
output primarily consists of visual aids, such as charts
and diagrams, which aid in the dissemination and dis-
cussions of results with stakeholders. Key statisti-
cal figures are used in analysis, decision-making, and
communication (see Section 3.5).
ICAART 2025 - 17th International Conference on Agents and Artificial Intelligence
610
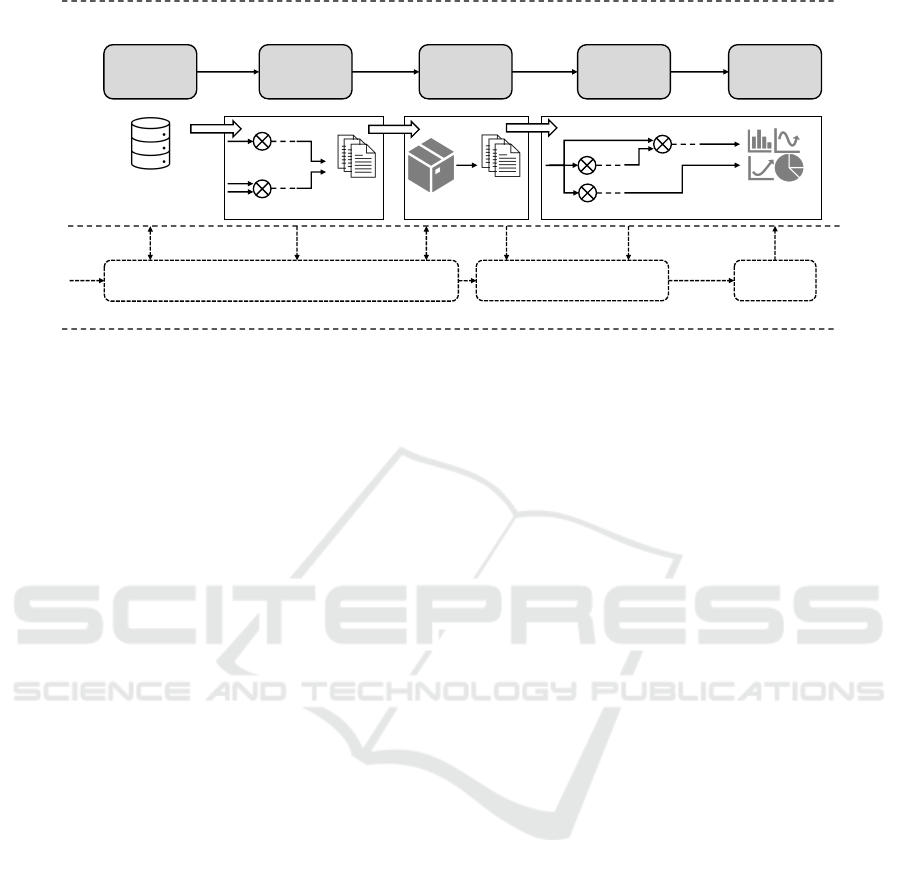
Data OutputModelGenerator Analyst
Definition of Hypotheses
Hypothesis Testing
Inter-
pretation
Hypothesis-Driven Development and Analysis
RQ1 - RQ4 RQ5 - RQ8
RQ9
RQ10
GAna Workflow
RQ5 - RQ8
RQ1
RQ11
Raw data
input
1...m
...
Prepared
data
1..m
Model
output
1..m
Analyst
output
1..m
...
Figure 1: The GAna Workflow Concept.
The lower half of the figure illustrates the accom-
panying hypothesis-driven development and analysis.
While this part can theoretically be considered sep-
arately from the actual workflow, we emphasize the
importance of such model development. Forming hy-
potheses, along with specific research questions that
can be accepted or rejected through scientific inquiry,
is a foundation for the development of any model.
This approach enables clear and objective conclusions
to be drawn (Lorig et al., 2017a,b). The choice of data
input depends on the hypotheses being addressed, and
vice versa, as data availability may limit or require the
reformulation of hypotheses. The defined hypotheses
are tested using the model’s output, e.g., with the help
of data analysts, which process data accordingly. Fi-
nally, the interpretation of the results depends on the
choice of hypotheses, as well as the visualized out-
put. As described in (Lorig et al., 2017a,b), a step
towards automated testing of hypotheses can be made
by formalizing these hypotheses, e.g., by using a for-
mal specification language which allows for an auto-
mated evaluation of hypotheses using methods such
as statistical hypothesis tests (cf. Lorig et al. 2017a).
This further increases objectivity and reproducibility
by minimizing experimenter bias.
3.1 Data
To be applicable for the GAna workflow, data input
must fulfill certain requirements, as indicated in Fig-
ure 1. Requirement RQ1: Data Format and Structure
refers to the format and internal structure of the in-
put data. While custom adapters can bridge the gap
between unusual file formats and the workflow, files
should be generally provided in widely accepted for-
mats, such as CSV or JSON. The structure of the files
should be standardized, i.e., ensuring consistent units
of measurement and data types. This reduces errors
and simplifies the integration of data with other model
components, such as model generators. Additionally,
good standardization eliminates the need for prepro-
cessing steps that would otherwise be necessary.
The GAna workflow aims for flexibility, allow-
ing a variety of different models to benefit from it.
This is addressed in Requirement RQ2: Data Main-
tenance and Accessibility. Since model generators
can produce data inputs essential for multiple models,
commonly used data used should be accessible by all
users. To increase reproducibility and to allow utiliza-
tion by different working groups, usage of publicly
accessible data are preferred. Additionally, with fast-
paced advancements leading to frequent data changes,
it is crucial to ensure that the data remains as current
as possible. Hence, the workflow should make use of
recurrent studies whenever possible. Another crucial
aspect is tackled in Requirement RQ3: Data Quality
concerning the completeness of the data input for the
respective application case or model scope. The files
should contain all relevant data fields, with a minimal
number of missing values. This leads directly to the
last Requirement we discuss concerning data input,
namely RQ4: Data Privacy and Usefulness. This re-
quirement addresses the trade-off between the neces-
sary anonymity of people in the data and the need for
unbiased data, ensuring that groups of people are not
completely excluded and can therefore be considered
in the subsequent data set and model (see also Leavy
et al. 2020; Kuhlman et al. 2020). Anonymity is al-
ways a prerequisite and must be guaranteed, but data
should always be valid with regard to the exclusion
of people with particular characteristics who form an
absolute minority in the data set but could be of great
relevance for certain models or general research (cf.
Schroeder et al. 2024).
GAna: Model Generators and Data Analysts for Streamlined Processing
611

3.2 Model Generator
The model generator typically uses raw data as in-
put, which is preprocessed according to its type and
returned in a common structure across all incoming
data. This process is repeated for every data source
and allows for the unified processing of data in differ-
ent formats. Higher quality of the process is allowed
by preprocessing multiple data sources individually;
this also allows for using differently structured data
and different data types as input, which can be com-
bined later on. The modular approach enables creat-
ing multiple versions and combinations of generator
steps, thereby allowing different versions of the pro-
cessed data to be created. Combining and filtering the
data removes unnecessary, unclean, or unprocessable
data, while grouping relevant data points from multi-
ple sources enhances the overall results.
One such example is how data regarding building
location and data on population statistics can be com-
bined to create a synthetic population of an area (fur-
ther described in Section 4.3). The model generator
plays a key role in structural transformation by defin-
ing the structure of the data used in the model. Multi-
ple generators may contribute to the input of a single
model. For instance, one generator may generate a
synthetic populace, whereas another prepares data for
the construction of street networks for models.
To ensure the effective operation of model gener-
ators within the GAna workflow, several key require-
ments must be met to maintain the quality and appli-
cability of the output. Requirement RQ5: Modular-
ity and Reusability emphasizes that model generators
should produce outputs that are not bound to any spe-
cific model. By using a well-defined data structure,
this allows for data to be reused across various ap-
plications, such as synthetic populations or road net-
works, for different modeling scenarios. By support-
ing modular, multistep processes where each compo-
nent operates independently, the system gains greater
flexibility. This modularity enables the generator to
be adapted to different models or workflows with-
out requiring significant changes, making it easier to
modify or replace components without disrupting the
overall workflow.
Another critical aspect of model generation is pre-
serving the Data Integrity and Reproducibility (RQ6).
RQ6 ensures that any transformations or processes
applied to the data do not alter its original seman-
tics or logical relationships. For example, when ag-
gregating or combining different datasets, it is es-
sential to consider the semantic overlap to maintain
coherence of the data. This helps avoid inconsis-
tencies that could arise from mismatches in mean-
ing or scope between datasets. Additionally, gener-
ators must behave deterministically, consistently pro-
ducing the same output for identical inputs, especially
when using pseudo-random values within the process.
This guarantees reproducibility and reliability across
repeated operations.
Efficiency is also a fundamental requirement for
the operation of model generators. If feasible, Re-
quirement RQ7: Performance and Scalability urges
to reflect for ad hoc analysis. They must be able
to adapt to various use cases, from handling small
datasets to scaling up for larger, more complex data
environments. For example, this could include mod-
eling different region sizes, ranging from individual
cities to larger municipalities. This adaptability en-
sures that the system remains responsive to diverse
performance needs while maintaining flexibility.
Finally, ensuring Compliance with Standards and
Transparency (RQ8) is essential. RQ8 emphasizes
the need to follow established guidelines and best
practices, grounded in well-founded methodologies.
This could be as simple as considering technical and
ethical guidelines for statistical practice, data protec-
tion regulation, or the specific data usage rights of
a dataset. For synthetic data, it is recommended to
use established technical methods like Iterative Pro-
portional Fitting Deming and Stephan (1940) or Sim-
ulated Annealing Kirkpatrick et al. (1983) to guar-
antee the expected statistical properties. The system
must operate with full transparency, recording all as-
sumptions to build trust and maintain accuracy. Doc-
umenting the provenance of the entire process makes
each step traceable and verifiable, as proposed by
Ruscheinski and Uhrmacher (2017).
3.3 Model
The model is treated as a black box: it receives tai-
lored inputs from the model generators, processes
it, e.g., by making use of the input for simulation
runs, and produces outputs for the downstream data
analysts. Depending on the application’s focus, the
model can be, for instance, a simulation or a math-
ematical model. In our case, we typically focus on
simulation models, specifically those that make use
of ABMs, which facilitates the integration of model
generator outputs across multiple models. Examples
of such models are given in Section 4, where two case
studies are discussed.
To ensure flexibility within the GAna work-
flow, Requirement RQ9: Interface Compatibility and
Workflow Adaptability states that the model’s input
and output interfaces must be semantically aligned
with those of the generator and analyst, respectively,
ICAART 2025 - 17th International Conference on Agents and Artificial Intelligence
612

for the relevant workflows. Alternatively, custom
adapters can be provided to make the data compatible
with those workflows. The model should meaning-
fully utilize the generator’s output (e.g., integrating a
synthetically generated population) and produce out-
puts that are usable for the analyst’s workflows. This
adaptability allows for model modifications without
changing the generator or analyst, preserving work-
flow integrity and efficient data transfer. Requirement
RQ10: Documentation and Usability emphasizes the
need for comprehensive documentation detailing the
model’s input and output interfaces, such as formats
and data types. Thus, it should outline the workflow
requirements for both the generator and analyst to
ensure proper integration. Clear documentation sup-
ports any necessary data transformations and efficient
use of the model within the workflow.
3.4 Data Analyst
Data analysts serve the purpose of making the model
output reveal its key insights by visualizing the data
using graphs or calculating aggregated results like
means, standard deviation, or confidence intervals.
The analyst output thus could be any kind of plot,
a (intermediate) data set, or even the result of auto-
mated hypothesis testing.
To accomplish this, several analyst functions are
implemented, ranging from data cleansing, validation
and aggregation steps over filtering and statistics to
plotting of the data. By combining these functions
into integrated workflows, complex evaluations can
be prepared once and then be executed automatically.
A typical workflow for a data analyst looks like
this: The output of a simulation model is represented
as a data node, which then undergoes several prepro-
cessing steps. These steps involve aggregating mul-
tiple simulation runs, filtering out irrelevant data, or
cleaning and organizing the data for analysis. Once
preprocessing is complete, the data are transformed
into the required format for further analysis. The final
step is to represent the data visually or statistically, us-
ing plots, descriptive statistics, or more complex ana-
lytical methods, to extract meaningful insights.
Analysts should be structured modular to allow
reuse of its subcomponents. Some workflows might
be completely generic or adjustable, while others can
refer to specific aspects of the respective model’s ap-
plication area.
Like model generators, data analysts within the
GAna workflow must maintain quality, reliability, and
reusability in their processes. Requirement RQ5:
Modularity and Reusability emphasizes that data ana-
lysts should evaluate multistep processes, where each
component operates independently and can be reused
across different models. This adaptability ensures that
evaluations can be applied to various outputs — such
as analyzing affected agents in a crisis or traffic be-
havior during an emergency — without requiring sig-
nificant changes to the overall analysis workflow. A
critical aspect of model analysis is ensuring that the
outputs remain consistent and logical throughout the
entire process.
Requirement RQ6: Data Integrity and Repro-
ducibility mandates that analysts maintain accuracy
and consistency in the outputs, especially when com-
bining or comparing multiple datasets. When inte-
grating different model outputs, it is crucial to pre-
serve the semantic relationships and logical structure.
Analysts must also ensure that outputs are determinis-
tic, consistently producing the same results for identi-
cal inputs. This ensures reliability in both current and
future analyzes.
Requirement RQ7: Performance and Scalability
ensures that the analysis process operates efficiently
under various conditions. This allows for ad-hoc anal-
ysis of previously generated data, considering outputs
from models with different levels of complexity. The
analysis process should support a range of tasks, from
simple plotting to complex calculations, and make the
results quickly accessible whenever possible. Trans-
parency and adherence to industry standards are es-
sential for ensuring the credibility of the analysis out-
put, which lays the foundation for further interpre-
tation. Requirement RQ8: Compliance with Stan-
dards and Transparency highlights the importance of
data analysts following established best practices or
widely recognized methodologies to ensure both ac-
curacy and clarity of the analysis. For example, using
reputable libraries such as Plotly
1
for data visualiza-
tions or scikit-learn
2
for data analysis can contribute
to standardization and reproducibility. All assump-
tions must be clearly documented to ensure trust and
transparency.
3.5 Output
The workflow results in the formation of suitable out-
put, for example, in the form of statistical key figures
or visual aids such as histograms or graphs. To be ap-
plicable in communication with stakeholders and to
be usable for dissemination, output should also fol-
low a few requirements. Firstly, output should be
easy to interpret and consistently presented to make
sure that various user groups, especially stakeholders,
can understand its meaning and derive the intended
1
https://plotly.com/python/
2
https://scikit-learn.org/
GAna: Model Generators and Data Analysts for Streamlined Processing
613

conclusions. The given output in combination with
the respective model should be able to communicate
assumptions made as well as limitations, allowing
user groups to be aware of possible constraints (trans-
parency) (RQ11: Clarity and Consistency). Secondly,
as was already mentioned for input data, it is essential
that the data types used for output files follow indus-
try standards (see Section 3.1), enabling further pro-
cessing using common tools (RQ1: Data Format and
Structure).
The requirements formulated above should be
considered a guideline that can be extended or
adapted to the specific needs of a working group or
project. While adaption is possible, and the specific
implementation is up to the user, they are intended as
a starting point and should help to ensure that basic
functionality as well as quality and transparency stan-
dards are met.
4 APPLYING GENERATORS AND
ANALYSTS: TWO CASE
STUDIES
In this section we introduce two distinct case studies
to demonstrate the applicability and effectiveness of
the proposed approach in different contexts. To this
end, the application projects are first presented, the
data and tools used to realize the workflow are ex-
plained and examples of model generators and data
analysts are described.
The AKRIMA project
3
(Automatic Adaptive Cri-
sis Monitoring- and Management-System) aims at of-
fering a generic toolkit for monitoring arbitrary re-
gions, with a focus on logistic processes and criti-
cal infrastructure. The approach builds mostly upon
publicly available data sources that can be combined
and processed to present an extensive overview for
monitoring and crisis management. This should sup-
port decision makers regarding the search for appro-
priate crisis response measures. For this project, vari-
ous crisis-relevant software and analysis components
are developed and integrated, with the aim of present-
ing explainable information to support decision mak-
ers. These include, among others, a social simulation
dashboard focusing on the analysis of pandemic sce-
narios, a process simulation for evaluating business
processes during times of crisis, a map dashboard to
visualize the impact on supply chains, and a critical
infrastructure analysis that estimates the impact of cri-
sis scenarios regarding their Robustness of Accessibil-
ity (RoA) (Kaub et al., 2024). The applied software
3
https://akrima.dfki.de/
components focus on the representation of the pop-
ulation, their homes, workplaces, critical infrastruc-
ture, geographical features like water levels or flood-
ing zones, and logistic routes.
The GreenTwin project (Green digital twin with
artificial intelligence for CO
2
-saving cooperative mo-
bility and logistics in rural areas) researches how pro-
environmental behavior in rural areas can be pro-
moted, with a particular focus on individual trans-
portation and logistics. For the project, several sce-
narios are investigated, using an agent-based simu-
lation approach with a Digital Twin of a rural area.
Besides delivery services and demand-driven prod-
uct ranges, scenarios regarding mobility on-demand
or shared economy are examined. These scenar-
ios are combined into a marketplace platform with
the goal of motivating individuals to move towards
pro-environmental behavior by offering compelling
and financially sensible alternatives to CO
2
-intensive
individual transportation (Bae et al., 2024). The
project’s Digital Twin is structured in three lay-
ers (individual, spatial, and social) with each one
requiring specific types of model generators with
varying degrees of complexity (Rodermund et al.,
2024). The GreenTwin simulation model shares many
represented entities with the previously discussed
AKRIMA model. But it focuses more on the repre-
sentation of individual schedules and their daily rou-
tines - like going to work, getting groceries, pursu-
ing leisure activities while considering their preferred
mode of transport.
Both AKRIMA and GreenTwin benefit from sev-
eral of the aforementioned workflow components, as
they have a need for tailored data from heterogeneous
sources to implement realistic model behavior. This
requirement stems from the geospatial and social na-
ture of the applied modeling approaches.
4.1 Data & Statistics
Depending on the specific scenario, various general
and more specific data sources need to be combined
to create composite data components that can be used
by following processes in the workflow. These can
range from crowdsourced data - like OpenStreetMap
(OSM)
4
to proprietary data from companies or ad-
ministrative authorities. Additionally, the results from
scientific research, in the form of theories and statis-
tics, are often required for a valid implementation of
generators and analysts.
One essential requirement shared by both case
studies is the representation of various infrastructural
entities - like street networks, buildings, Points of
4
https://www.openstreetmap.de/
ICAART 2025 - 17th International Conference on Agents and Artificial Intelligence
614

Interest (POIs), or district boundaries. Therefore,
the usage of crowdsourced, publicly available data
from OSM is reasonable (RQ2). Due to the uniform
API provided by various libraries (RQ1, RQ8), deal-
ing with OSM data becomes a straightforward and
generic way to fulfill this need. OSM also performs
quite well when evaluated against the requirements
formulated in Section 3, as it comes in a standard-
ized cross-regional format, as well as getting regu-
larly maintained by a wide range of contributors. Data
quality in poorly covered regions can be compromised
(especially regarding completeness), but depending
on the specific use case, this might not have a notice-
able negative impact (RQ3).
The other fundamental data input for various
model generators is the regularly surveyed census
statistics
5
. Unlike the non-personal data available
through OSM, census data — such as from the Ger-
man census — provides detailed demographic infor-
mation with a resolution as fine as 1 hectare. Due
to its regular nationwide standardized procedure and
advanced statistical methods, it also meets our formu-
lated data requirements (see Section 3.1). Data pri-
vacy (RQ4) is always a concern when dealing with
personal data, but the responsible statistical office en-
sures the anonymization of the published statistics.
4.2 Tools
In our case studies, we use several tools to handle
both preprocessing and postprocessing phases of the
model generators and data analysts respectively. At
the core of our workflow, we apply Python as a fun-
damental programming language for data preprocess-
ing and analysis. Its vast ecosystem provides libraries
and frameworks for varying use cases like geospatial
computing (Pandas
6
) or social simulation (Mesa
7
).
Python and its libraries are widely adopted for
modeling and data processing, offering strong sup-
port for transparency and adherence to best prac-
tices, as required by RQ8. The active development
and thorough documentation of these tools ensure the
clear recording of assumptions and methodologies,
supporting accuracy, clarity, and transparency in the
GAna workflow.
Taipy
8
is a versatile Python library designed to
create data-driven web applications. It allows or-
ganizing the codebase into three main components:
data nodes, tasks, and scenarios. Data nodes repre-
sent variables, tasks correspond to functions, and sce-
5
E.g., in Germany: https://www.zensus2022.de
6
https://pandas.pydata.org/
7
https://mesa.readthedocs.io/
8
https://taipy.io/
narios are well-defined ordered combinations of data
nodes and tasks. Such a scenario implementation is
shown in Figure 2, which visualizes the process of a
model generator realized in Taipy.
The modular design aligns with RQ5, enabling
components to be reused and easily modified. This al-
lows for the seamless integration of additional tasks,
such as data transformers for individual models, into
existing scenarios. The library provides a high-level
abstraction layer for defining and automating analysis
workflows in the form of a GUI, where tasks and data
nodes can be arranged and connected
9
.
Taipy supports RQ6 by providing structured work-
flows that define clear relationships between data
nodes and tasks, ensuring that data transformations
are traceable and consistent. The library enforces val-
idation and control over data flows, reducing errors
and maintaining data quality. Additionally, by of-
fering a transparent and well-documented approach
to workflow design, Taipy aligns with RQ8, making
workflows more comprehensible and enabling less
technical users to modify or interpret the output.
GeoPandas
10
is a critical tool for handling and
manipulating geospatial data. It offers a range of
integrated functions that streamline the processing
steps by building on Pandas and extending the core
functionality to support various geometric operations.
One example is the possibility of spatially joining two
datasets by defining an appropriate predicate, such as
within or intersects. This is achieved due to the in-
tegration of the Shapely library, which offers a wide
range of geometric operations and classes.
Its functionalities can be reused for data process-
ing across different tasks, supporting the modular ap-
proach outlined in RQ5. Besides this, GeoPandas
proves as good choice due to its easy integration with
other data formats and libraries such as GeoJSON,
Shapefiles, or spatial databases. For our case stud-
ies, GeoPandas proves as an essential tool due to the
nature of the data required by our models.
4.3 Model Generators
As outlined in Section 3.2, model generators serve as
preprocessing units designed for specific use cases,
depending on the model they support. The complexity
of these generators can vary significantly, from simple
operations like data filtering to complex processes in-
volving multiple data sources and advanced statistical
methods.
9
https://marketplace.visualstudio.com/items?
itemName=Taipy.taipy-studio
10
https://geopandas.org/
GAna: Model Generators and Data Analysts for Streamlined Processing
615
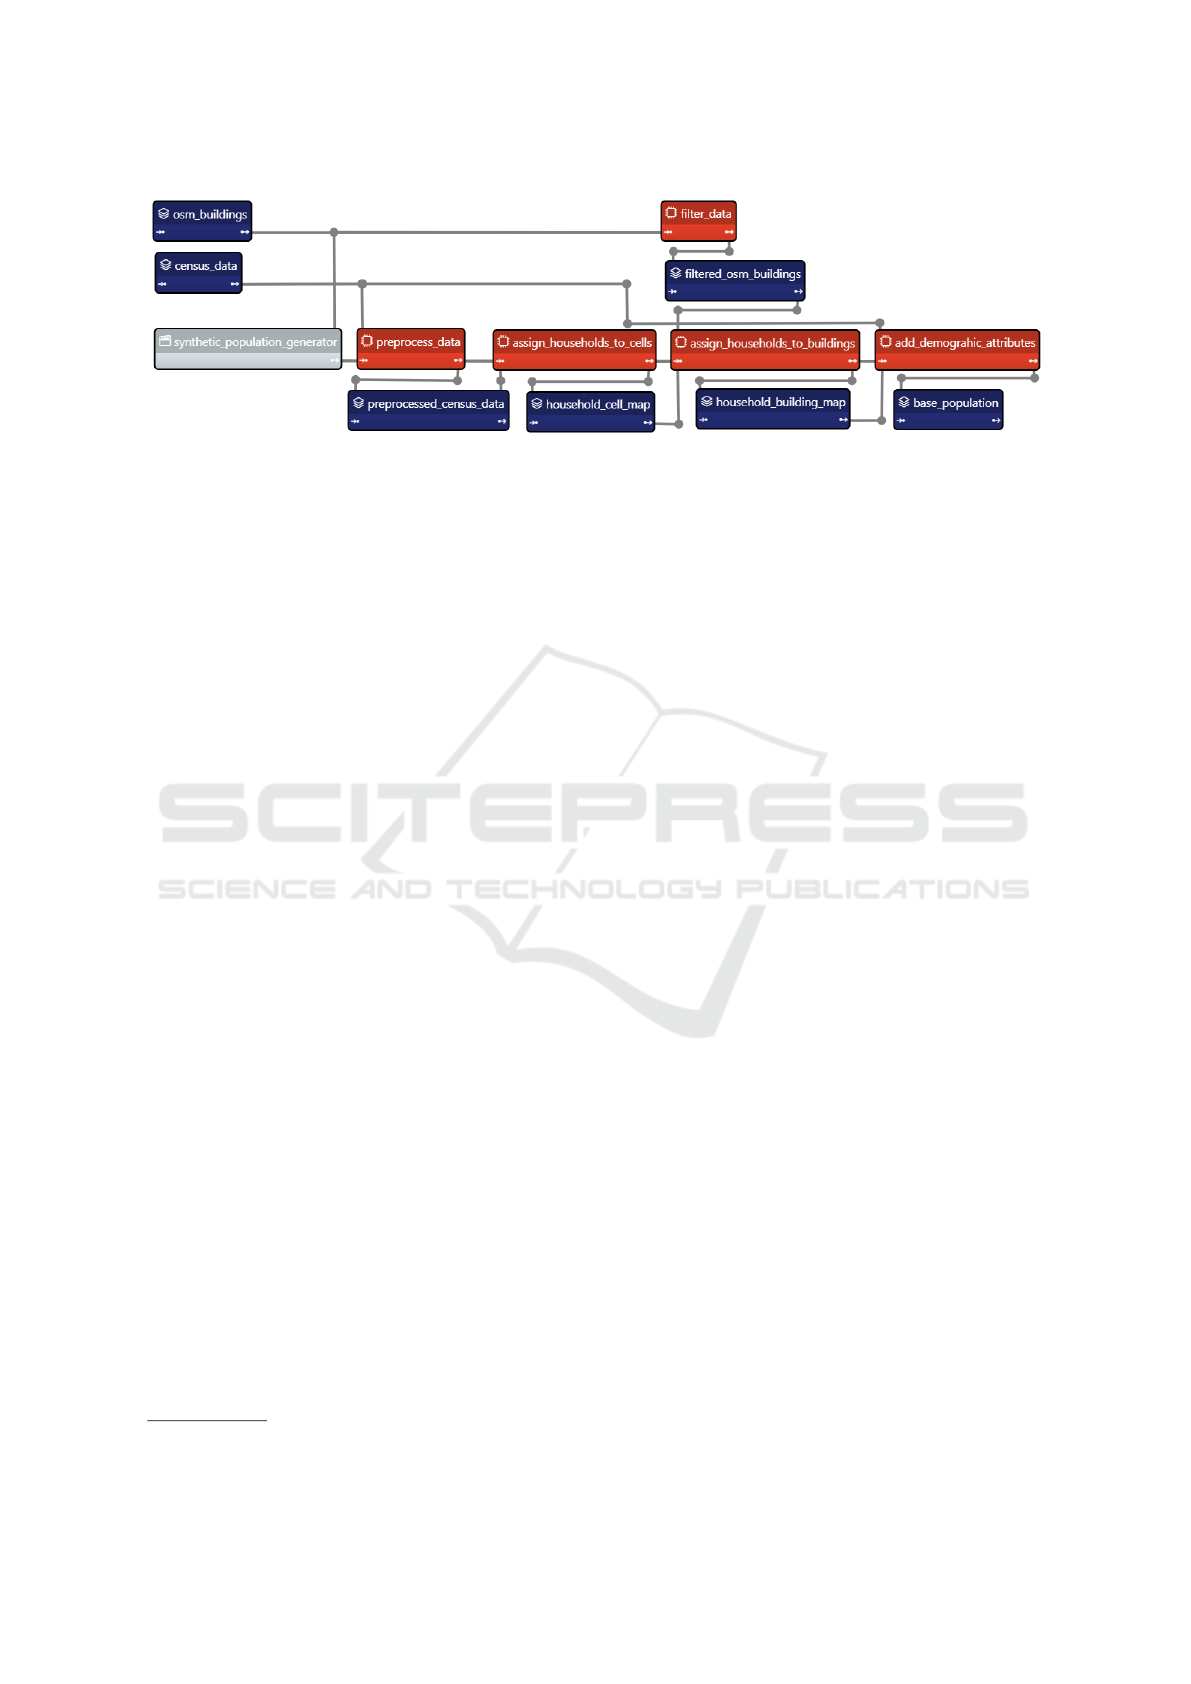
Figure 2: Synthetic Population Taipy Scenario.
At the simplest level, a model generator might
only load data and perform minimal preprocessing.
For example, using OSMnx
11
, data can be queried and
filtered from OSM to retrieve specific geospatial in-
formation. In our discussed case studies, we apply
several generators of this type to load buildings, ad-
ministrative boundaries, street networks, POIs, or ge-
ographical features like rivers.
A more advanced example of a model genera-
tor is used to prepare for the RoA analysis intro-
duced in Section 4. This generator integrates data
from multiple sources, including historical flooding
records from administrative authorities and outputs
from the previously mentioned street network gen-
erator. The RoA index is used to evaluate the in-
frastructural robustness under crisis scenarios such as
flooding. The generator intersects the street network
with the flooded shapes to identify flooded and non-
flooded sections in the network. The data are then
used by the method to compare accessibility of vari-
ous points in the network in disrupted and undisrupted
states.
Even more sophisticated generators are the Pop-
ulation Generator (cf. Figure 2), Workplace As-
signer, and Social Network Generator, which require
the integration of heterogeneous data sources from
various origins. These sources include administra-
tive authorities (e.g., census data), publicly available
data (e.g., OSM), statistical methods (e.g., Simulated
Annealing), proprietary employee data from compa-
nies, or proprietary datasets from authorities (RQ2).
More specifically, the population generation process
as shown in Figure 2 involves several steps ranging
from loading and filtering the required input data, to
creating and assigning households to cells, and ex-
plicitly mapping the households to the filtered build-
ings. Based on the specific household types, demo-
graphic attributes like age and gender can be deducted
to create a population with sufficient attributes that
can be used by various models (RQ4).
11
https://osmnx.readthedocs.io/
4.4 Data Analysts
Following the explanation in Section 3.4, data ana-
lysts serve the purpose of making the model output
reveal its key insights. Similar to the data generators,
the complexity of workflows will vary based on the
number, size, and properties of the datasets and the
specific analytical requirements.
The most commonly used analyst tool allows ba-
sic analysis of the results of agent-based simulation.
Since it is typical to have some degree of random-
ness as part of an ABM and therefore the data farm-
ing process, multiple replications of the same parame-
ter combinations will be run using individual random
seeds. While this allows reflecting uncertainty, e.g.,
in a decision-making process within a model, it also
has to be considered when analyzing the data.
The Generic Time series Chart Analyst allows the
aggregation of such data by solely providing the name
of a generic aggregation variable (i.e., the column
name of a dataset) in addition to the data itself, and
calculates the mean, standard deviation, and confi-
dence intervals. The resulting data are either plotted
statically and exported as an image or as an interac-
tive chart using Plotly and serialized to allow, e.g.,
embedding it on a website. Besides the plot itself, in-
termediate results can either be used for further anal-
ysis like hypothesis testing or for result tables due to
the modular approach of such analysts.
A more advanced analyst is used to process the
output of the above-mentioned RoA component. The
analyst takes data about the distances and reachability
of POIs as well as geographic information about the
administrative boundaries of the relevant area to cal-
culate scores for individual samples that can be hierar-
chically aggregated on a street, district, city, county,
or even country level. Including the street network
created by the upstream generator, data can be plot-
ted as a graph, highlighting potential problem areas or
relevant (emergency) services. Serialization of the an-
alyzed results allows downstream visualizations, e.g.,
within a dashboard or web application.
ICAART 2025 - 17th International Conference on Agents and Artificial Intelligence
616

5 DISCUSSION AND
CONCLUSIONS
The process of pre- and postprocessing of data takes
up a majority of time in the entire development pro-
cess of a (simulation) model. In an attempt to simplify
this process and to make it more efficient and trans-
parent for users and stakeholders, we introduced the
GAna workflow - a conceptual framework describing
the steps from processing incoming data for the use in
a model and preparing model output for dissemination
purposes. To do so, we first presented the entire work-
flow process including the alignment to hypothesis-
driven execution of simulation studies. Subsequently,
we focused on the respective steps in the workflow
whereby we defined requirements for each step that
should be met, either by the choice of data, tools or
the overall structure of the components. The core of
the workflow consists of model generators and data
analysts that are designed to be applicable in as many
contexts as possible. To demonstrate this, we intro-
duced the application of model generators and data
analysts in two simulation models with different fo-
cuses.
An important challenge lies in testing when new
modules are added or existing modules are modified.
For this reason, the development of single compo-
nents and their subsequent integration in the work-
flow is recommended. This approach also ensures
reusability. In addition, a consistency check of the
intermediate results is recommended to avoid an er-
ror propagation between the components. To address
this issue, Taipy allows emitting intermediate results
and thus enables testing for consistency. This tool is
also a good choice to reduce the implementation over-
head. Versioning the stages of development of the
components, e.g., using Git enables their use in differ-
ent contexts at different points in time. This also en-
hances transparency and provenance of the processes.
Currently, the GAna workflow has been predom-
inantly applied to simulation models, like those pre-
sented in Section 4, which, despite differing in their
objectives, share similar settings such as the granular-
ity of the population and spatial aspects. This limits
the conclusions that can be drawn about the applica-
bility of the approach when applied to other model
types.
Hence, the next steps in the development pro-
cess of this approach include the testing of the over-
all workflow on a wider range of models than has
been done thus far. By performing evaluation studies
in terms of key characteristics such as usability and
transferability, conclusions on the general applicabil-
ity of the approach in different contexts can be drawn.
Furthermore, future work might focus on evaluating
and enhancing the robustness of the model genera-
tor by analyzing how variations in the incoming data
impact the stability and consistency of the generated
models. At the time of writing, an entire workflow
has not yet been implemented, but results could still
be obtained by using individual model generators and
data analysts without a fully automated workflow, es-
pecially regarding hypotheses and hypotheses testing.
ACKNOWLEDGEMENTS
This work has been conducted in the projects
AKRIMA and GreenTwin. AKRIMA – Automatic
Adaptive Crisis Monitoring and Management Sys-
tem - is a consortium project funded from 01/2022
until 03/2025 within the “Research for civil secu-
rity” program (sifo.de) by the German Federal Min-
istry of Education and Research (BMBF) under grant
number 13N16251. In its context the conceptual
development of the GAna workflow was conducted
and first generators and analysts were implemented.
GreenTwin - Green Digital Twin with artificial in-
telligence for CO
2
-saving cooperative mobility and
logistics in rural areas - is a project funded by the
Federal Ministry for the Environment, Nature Con-
servation, Nuclear Safety and Consumer Protection
(BMUV) (No. 67KI31073C). In this context addi-
tional generators, e. g., to create daily routines for
the agents and specific analysts were implemented
and applied to support the simulation based analysis
of last mile logsitics. We would further like to ac-
knowledge the work of Marek Graca, Brian Kr
¨
amer,
Benedikt L
¨
uken-Winkels, and Lukas Tapp in the de-
velopment of this workflow.
REFERENCES
Asgharpour, A., Bravo, G., Corten, R., Gabbriellini, S.,
Geller, A., Manzo, G., Gilbert, N., Tak
´
acs, K., Terna,
P., and Troitzsch, K. G. (2010). The impact of agent-
based models in the social sciences after 15 years of
incursions. History of economic ideas, 18:197.
Bae, Y. E., Berndt, J. O., Brinkmann, J., Dartmann, G.,
Hucht, A., Janzso, A., Kopp, S., Kravets, A., Lidynia,
C., Lotz, V., et al. (2024). GreenTwin: Developing a
Digital Twin for sustainable cooperative mobility and
logistics in rural areas. In Proceedings of REAL CORP
2024, pages 361–373. CORP–Competence Center of
Urban and Regional Planning.
Dalle, O. (2012). On reproducibility and traceability of sim-
ulations. In Proceedings of the 2012 Winter Simula-
tion Conference, page 11p. IEEE.
GAna: Model Generators and Data Analysts for Streamlined Processing
617

Deming, W. E. and Stephan, F. F. (1940). On a least squares
adjustment of a sampled frequency table when the
expected marginal totals are known. The Annals of
Mathematical Statistics, 11(4):427–444.
Feger, S. S. and Wo
´
zniak, P. W. (2022). Reproducibility: A
researcher-centered definition. Multimodal Technolo-
gies and Interaction, 6(2).
Feitelson, D. G. (2015). From repeatability to reproducibil-
ity and corroboration. ACM SIGOPS Oper. Syst. Rev.,
49:3–11.
Hedstr
¨
om, P. and Manzo, G. (2015). Recent trends in agent-
based computational research: A brief introduction.
Sociological Methods & Research, 44(2):179–185.
Herschel, M., Diestelk
¨
amper, R., and Ben Lahmar, H.
(2017). A survey on provenance: What for? what
form? what from? The VLDB Journal, 26(6):881–
906.
Huang, Q., Parker, D. C., Filatova, T., and Sun, S. (2014). A
review of urban residential choice models using agent-
based modeling. Environment and Planning B: Plan-
ning and Design, 41(4):661–689.
Kaub, D., Lohr, C., Reis David, A., Das Chandan, M. K.,
Chanekar, H., Nguyen, T., Berndt, J. O., and Timm,
I. J. (2024). Shortest-path-based resilience analysis of
urban road networks. In International Conference on
Dynamics in Logistics, pages 132–143. Springer.
Kirkpatrick, S., Gelatt, C. D., and Vecchi, M. P. (1983).
Optimization by simulated annealing. Science,
220(4598):671–680.
Kuhlman, C., Jackson, L., and Chunara, R. (2020). No com-
putation without representation: Avoiding data and
algorithm biases through diversity. In Proceedings
of the 26th ACM SIGKDD International Conference
on Knowledge Discovery & Data Mining, page 3593,
New York, NY, USA. Association for Computing Ma-
chinery.
Leavy, S., O’Sullivan, B., and Siapera, E. (2020). Data,
power and bias in artificial intelligence. In AI for So-
cial Good Workshop.
Lee, J.-S., Filatova, T., Ligmann-Zielinska, A., Hassani-
Mahmooei, B., Stonedahl, F., Lorscheid, I., Voinov,
A., Polhill, J. G., Sun, Z., and Parker, D. C. (2015).
The complexities of agent-based modeling output
analysis. Journal of Artificial Societies and Social
Simulation, 18(4).
Lorig, F., Becker, C. A., and Timm, I. J. (2017a). For-
mal specification of hypotheses for assisting computer
simulation studies. In Proceedings of the Symposium
on Theory of Modeling & Simulation, pages 1–12.
Lorig, F., Lebherz, D. S., Berndt, J. O., and Timm, I. J.
(2017b). Hypothesis-driven experiment design in
computer simulation studies. In 2017 Winter Simu-
lation Conference (WSC), pages 1360–1371. IEEE.
Matthews, R. B., Gilbert, N. G., Roach, A., Polhill, J. G.,
and Gotts, N. M. (2007). Agent-based land-use mod-
els: a review of applications. Landscape Ecology,
22:1447–1459.
Munson, M. A. (2012). A study on the importance of and
time spent on different modeling steps. ACM SIGKDD
Explorations Newsletter, 13(2):65–71.
Pierce, M. E., Krumme, U., and Uhrmacher, A. M. (2018).
Building simulation models of complex ecological
systems by successive composition and reusing sim-
ulation experiments. In 2018 Winter Simulation Con-
ference (WSC), pages 2363–2374. IEEE.
Raghupathi, W., Raghupathi, V., and Ren, J. (2022). Repro-
ducibility in computing research: An empirical study.
IEEE Access, 10:29207–29223.
Rodermund, S. C., Janzso, A., Bae, Y. E., Kravets, A.,
Schewerda, A., Berndt, J. O., and Timm, I. J. (2024).
Driving towards a sustainable future: A multi-layered
agent-based digital twin approach for rural areas. In
ICAART (1), pages 386–395.
Ruscheinski, A., Gjorgevikj, D., Dombrowsky, M., Budde,
K., and Uhrmacher, A. M. (2018). Towards a prov
ontology for simulation models. In International
Provenance and Annotation Workshop, pages 192–
195. Springer.
Ruscheinski, A. and Uhrmacher, A. M. (2017). Provenance
in modeling and simulation studies – bridging gaps.
In Proceedings of the 2017 Winter Simulation Confer-
ence, pages 871–883. IEEE.
Schroeder, D., Chatfield, K., Chennells, R., Partington, H.,
Kimani, J., Thomson, G., Odhiambo, J. A., Snyders,
L., and Louw, C. (2024). The exclusion of vulnera-
ble populations from research. In Vulnerability Re-
visited: Leaving No One Behind in Research, pages
25–47. Springer.
Skoogh, A. and Johansson, B. (2008). A methodology
for input data management in discrete event simula-
tion projects. In 2008 Winter Simulation Conference,
pages 1727–1735. IEEE.
Taylor, S. J. E., Eldabi, T., Monks, T., Rabe, M., and
Uhrmacher, A. M. (2018). Crisis, what crisis–does re-
producibility in modeling and simulation really mat-
ter? In 2018 Proceedings of the Winter Simulation
Conference, page 11p. IEEE.
Teran-Somohano, A., Smith, A. E., Ledet, J., Yilmaz, L.,
and O
˘
guzt
¨
uz
¨
un, H. (2015). A model-driven engi-
neering approach to simulation experiment design and
execution. In 2015 Winter Simulation Conference
(WSC), pages 2632–2643. IEEE.
Torrens, P. M. (2010). Agent-based models and the spatial
sciences. Geography Compass, 4(5):428–448.
Wilsdorf, P., Dombrowsky, M., Uhrmacher, A. M., Zim-
mermann, J., and van Rienen, U. (2019). Simula-
tion experiment schemas–beyond tools and simulation
approaches. In 2019 Winter simulation conference
(WSC), pages 2783–2794. IEEE.
Wilsdorf, P., Wolpers, A., Hilton, J., Haack, F., and Uhrma-
cher, A. M. (2021). Automatic reuse, adaption, and
execution of simulation experiments via provenance
patterns. ACM Transactions on Modeling and Com-
puter Simulation, 33:1 – 27.
ICAART 2025 - 17th International Conference on Agents and Artificial Intelligence
618
