
Performance Analysis of a Data Stream Processing System for Online
Activity Classification via Wearable Sensor Data
Hawzhin Hozhabr Pour
1 a
, Gabriela Ciortuz
1 b
, Andr
´
e L
¨
uers
2
and Sebastian Fudickar
1 c
1
Institute of Medical Informatics, University of L
¨
ubeck, Ratzeburger Allee 160, 23562 L
¨
ubeck, Germany
2
Department of Informatics, University of Oldenburg, Carl von Ossietzky Universit
¨
at Oldenburg Ammerl
¨
ander Heerstraße
114-118, 26129 Oldenburg, Germany
{hawzhin.hozhabrpour, gabriela.ciortuz, sebastian.fudickar}@uni-luebeck.de, andre-lueers@gmx.de
Keywords:
Network Architecture, Streaming Media, Performance Evaluation, Throughput, Latency, Distributed
Computing, Human Activity Recognition, Pattern Recognition, Wearable Sensors.
Abstract:
Online activity recognition based on wearable sensors is commonly used in sports and medicine applications.
The question of whether cloud or edge computing approaches are more suitable is not easy to answer and
depends on several factors. To address this issue, the influence the resource availability, batch sizes and number
of considered users on the throughput and latency of central data stream processing architectures has yet to
be answered. This article conducts a performance analysis, identifying relevant factors for a corresponding
cloud-based online data stream processing platform for online human activity recognition, using the Apache
Spark data processing framework and the Apache Kafka distributed messaging system. The platform focuses
on quantitative performance criteria to evaluate its effectiveness in terms of latency (turnaround time) and
throughput (number of users). Both metrics, throughput and latency (dependent variables), depend on the
batch interval, number of users, and hardware availability (independent variables). In addition to identifying
clear advantages of larger batch intervals, we also found significant benefits in applying vertical scaling. The
results indicate a monthly cost of 1e per user for compute resources in online activity recognition, a price that
could potentially be reduced by combining edge and cloud computing.
1 INTRODUCTION
The increasing digitization of daily life and the rise of
the Internet of Things (IoT) are resulting in a grow-
ing number of data streams, including measurement
data from sensors and scientific measuring stations
(Namiot, 2015). These data streams are continuous
data flows that are too large and frequent to be stored
before processing. IoT applications in Human Ac-
tivity Recognition (HAR) systems (Aroganam et al.,
2019) with wearable electronic sensors are used in
sports and medicine. For the data processing of these
multimodal data streams, Machine Learning (ML)
and Artificial Intelligence (AI) are crucial in trans-
forming raw sensor data into valuable predictions and
recommendations and have become very popular for
HAR (Mart
´
ın et al., 2022).
Cloud and edge computing are both popular tech-
nologies for handling big volumes of data generated
a
https://orcid.org/0000-0003-4404-7313
b
https://orcid.org/0000-0001-9443-7825
c
https://orcid.org/0000-0002-3553-5131
by such IoT devices. Edge computing processes
data closer to the source, reducing response time,
conserving bandwidth, and improving system perfor-
mance by minimizing data transfer to central data
centers. In contrast, cloud computing delivers on-
demand services, storing data remotely instead of lo-
cally (Chithra et al., 2022).
Edge computing has been used oftentimes for
HAR because it facilitates context-aware and user-
centric systems that prioritize privacy (Zebin et al.,
2019). However, this approach often comes with no-
table drawbacks – a substantial increase of the edge
device power consumption and thus the reduction
of the device’s battery lifespan (Agarwal and Alam,
2020). In addition, considering the trade-offs, not ev-
ery company is eager to store their models at the Edge
(Khannouz and Glatard, 2020).
A viable alternative is to process the data in
the cloud, utilizing well-established technologies like
Apache Spark (Salloum et al., 2016) and Apache
Kafka (Garg, 2013), some of the most popular data
stream systems (Ali Mohamed et al., 2021; Maaloul
Hozhabr Pour, H., Ciortuz, G., Lüers, A. and Fudickar, S.
Performance Analysis of a Data Stream Processing System for Online Activity Classification via Wearable Sensor Data.
DOI: 10.5220/0013166100003911
Paper published under CC license (CC BY-NC-ND 4.0)
In Proceedings of the 18th International Joint Conference on Biomedical Engineering Systems and Technologies (BIOSTEC 2025) - Volume 2: HEALTHINF, pages 571-578
ISBN: 978-989-758-731-3; ISSN: 2184-4305
Proceedings Copyright © 2025 by SCITEPRESS – Science and Technology Publications, Lda.
571

et al., 2023).
Apache Kafka is a distributed streaming platform
ideal for real-time data transport and caching, of-
fering low latency, high throughput, fault tolerance,
and scalability. Apache Spark complements Kafka
with distributed data stream processing and clus-
ter computing. Companies like Google, Meta, and
Twitter use these technologies for data processing.
Meta, for instance, processes millions of photos daily
to detect inappropriate content, supporting continu-
ous data streams for ML/AI systems (Mart
´
ın et al.,
2022)).These powerful frameworks have proven their
capabilities and efficiency in handling vast data while
maintaining acceptable performance levels.
The adoption of cloud-based data processing
through Spark and Kafka offers several advantages.
It allows for more efficient utilization of resources,
scalability, and ease of maintenance (Ali Mohamed
et al., 2021; Maaloul et al., 2023). Furthermore,
performance reviews and case studies have shown
promising results, demonstrating the efficacy of this
approach for handling real-world data processing re-
quirements (Inoubli et al., 2018; Nasiri et al., 2019).
Various approaches to distributed real-time data
stream processing have already been documented in
the scientific literature (Nasiri et al., 2019). In (In-
oubli et al., 2018), the frameworks Hadoop, Spark,
and Flink have been thoroughly evaluated in terms of
quantitative performance criteria using various bench-
marks, such as WordCount, Connected Components,
and K-Means. The evaluation involved comparing the
execution times across different cluster sizes (number
of nodes), data set sizes, and framework configura-
tions (Inoubli et al., 2018).
In general, Spark and Flink execute faster than
Hadoop, with Spark generally outperforming Flink
across benchmarks. These performance trends remain
consistent regardless of cluster or data set size, high-
lighting their efficiency in distributed real-time data
processing (Inoubli et al., 2018).
In their study (Nasiri et al., 2019), Nasiri et al. an-
alyzed the performance of Spark, Flink, and Storm
using Yahoo Streaming benchmarks, focusing on re-
source utilization, workload performance, latency,
and throughput. Storm and Flink excelled in latency
due to Spark’s batch processing, but Spark achieved
the highest throughput. The choice of framework de-
pends on factors like cluster size, latency, throughput
needs, and input rate, with Flink and Storm showing
similar performance and Spark prioritizing through-
put over latency.
In order to process big data, batch processing and
low latency are necessary. Apache Spark has proven
advantageous because it can process tuples in batches
(Nasiri et al., 2019). Kafka also addresses these
needs, by consuming large volumes of data with low
latency, thanks to its unique features, such as multi-
customer distribution via its publish/subscribe system
and a high message dispatch rate enabled by multiple
functionalities such as message set abstractions and a
binary message format (Mart
´
ın et al., 2022).
These features make Spark and Kafka an excellent
candidates for HAR, but the evaluations focus only on
the streaming and processing characteristics of textual
or metadata, lacking insight into the impact of han-
dling large-scale continuous raw sensor data streams
and computationally intensive classification in HAR
on delay and throughput in cloud streaming environ-
ments. These sensors are typically sampled at 100Hz.
Martin et al. (Mart
´
ın et al., 2022) introduced
Kafka-ML, an open-source framework for managing
ML/AI pipelines via data streams. However, perfor-
mance issues vary, complicating the use of consistent
metrics and evaluation techniques (Jain, 1990), and
knowledge about key factors and parameters in this
data processing remains limited.
In HAR, high throughput is crucial, while low-
delay feedback is less critical (Mart
´
ın et al., 2022).
In order to investigate the suitability of the Spark data
processing framework in combination with the Kafka
distributed messaging system and to identify relevant
factors, we implemented a corresponding measure-
ment data stream processing system for automated
motion classification. The system was then analyzed,
focusing on quantitative performance criteria to eval-
uate its effectiveness in latency and throughput. Both
throughput and latency depend on the batch inter-
val, the number of users, and the configuration of the
Spark cluster.
This article conducts a performance analysis for
a corresponding cloud-based online data stream pro-
cessing platform for online HAR based on the Apache
Spark data processing framework and the Apache
Kafka distributed messaging system. The rest of this
paper is organized as follows. Section 2 presents
the architecture of the data stream components, the
methodology, and the evaluation setting. Section 3
presents the results of the created framework. We
conclude the paper in Section 4 by describing our ac-
complishments, study limitations, and future work.
2 METHODS
2.1 Data Stream Architecture
We propose a data stream processing system for au-
tomated motion classification using acceleration and
HEALTHINF 2025 - 18th International Conference on Health Informatics
572

gyroscope data from an Android app. This section
outlines the system and implementation, focusing on
reliable, high-throughput, low-latency classification
for multiple users.
The system consists of an Android app and a
server-cluster for data stream processing (see Figure
1). The Android app is the interface between sensors,
users and the cluster. It can be used to acquire sensor
data and to forward it to the server. For data stream
and processing, Apache Kafka , Apache Spark and
Docker (Docker Inc., 2024) frameworks are used.
In Spark, data order is preserved, and multiple
data processing is avoided. This is crucial because
sensor data is time-series-based, and its classification
would be distorted if exact-once evaluation in the cor-
rect order is not ensured.
To achieve efficient data analysis, multiple oper-
ate work in parallel, following the master-slave com-
munication principle. The master server handles task
administration and delegation, while the slave servers
perform the actual data classification tasks. Docker,
along with Docker Compose and Docker Stack, was
chosen as the containerization tool.
2.2 Data Producer
The app provides users with various sensor-related
information and enables data acquisition and trans-
mission. Data transmission runs in the background,
receiving sensor data, caching it, and sending it in
batches via HTTP post requests to the Kafka REST
interface. For evaluation purposes, the app’s behavior
is simulated using a script that employs pre-recorded
sensor data from a user performing a Timed Up & Go
test (Fudickar et al., 2020).
2.3 Kafka
The data stream is received by Kafka through a REST
interface and stored in a topic. The data series are
cached on an Apache Kafka platform running on the
master server, which listens via Kafka’s REST API
(see Figure 1). In this setup, Apache Kafka connects
the data producer (e.g., a HAR app) with a Spark data
stream processor as the data consumer, to cache the
data or data streams.
In this work, the HAR app connects to a Kafka
cluster, pre-processes data through transformation
and aggregation, and passes it to a Python script
for classification using a trained model. The Spark
Worker executes the classification, storing labels on
disk. Before classification, data is grouped by a key
column within a time window and aggregated into ar-
rays. After configuring the parameters, a data frame
represents a data stream of Kafka records. The con-
sidered parameters are the URL of the Kafka server
with the port of the Kafka broker. The key corre-
sponds to the user’s ID entered in the Android app.
Afterwards, the initially defined data frame is trans-
formed and processed.
Kafka’s message size is configured for 10kb/s.
Since Kafka can process a throughput of over
100mb/s, 10000 users can use the system simulta-
neously (Apache Kafka, 2024), it is expected that
the Spark cluster can process data from significantly
fewer users with the available resources, so Kafka will
not be a bottleneck for our performance evaluation.
A single broker was configured with a topic con-
taining five partitions, which provides sufficient per-
formance for this work. The Schema Registry is not
used because the schema of the consumer application
(Spark program) matches the producer’s schema (An-
droid app).
2.4 Spark
Apache Spark is used to process the sensor data
stream. The processing includes the following steps:
1. Extraction of data from the Kafka platform
2. Aggregation of the data according to the user ID
3. Classification of sensor data per user ID with the
CNN classifier
4. Persistent storage of classification results
The master server (see Figure 1) hosts the Spark
Master (cluster Manager) that monitors, reserves,
and allocates the resources of the distributed Spark-
cluster. The Spark architecture includes Spark Core,
Spark SQL, Spark Streaming, MLlib Machine Learn-
ing Library, and GraphX. Spark Core includes the
basic functions of Spark, such as task distribution,
memory management, troubleshooting, or interac-
tions with storage systems. It is also responsible for
tracking the worker nodes by checking the state and
the progress of processing. A Spark application starts
and ends with the Spark Driver, which connects to the
master, schedules tasks, and coordinates execution.
Aggregating over a window requires a watermark to
include late-arriving data, but this has no effect when
using the system timestamp.
Within the Spark executor, sections of code from
the Driver program are first executed to extract and
preprocess data from Kafka. As preprocessing, the
start time of the data set, and the list of sensor data
is formatted as a two-dimensional array with six
columns (one column per sensor axis) and n lines,
where n corresponds to the length of sensor data
lists. With the applied batch interval of 30 seconds
Performance Analysis of a Data Stream Processing System for Online Activity Classification via Wearable Sensor Data
573
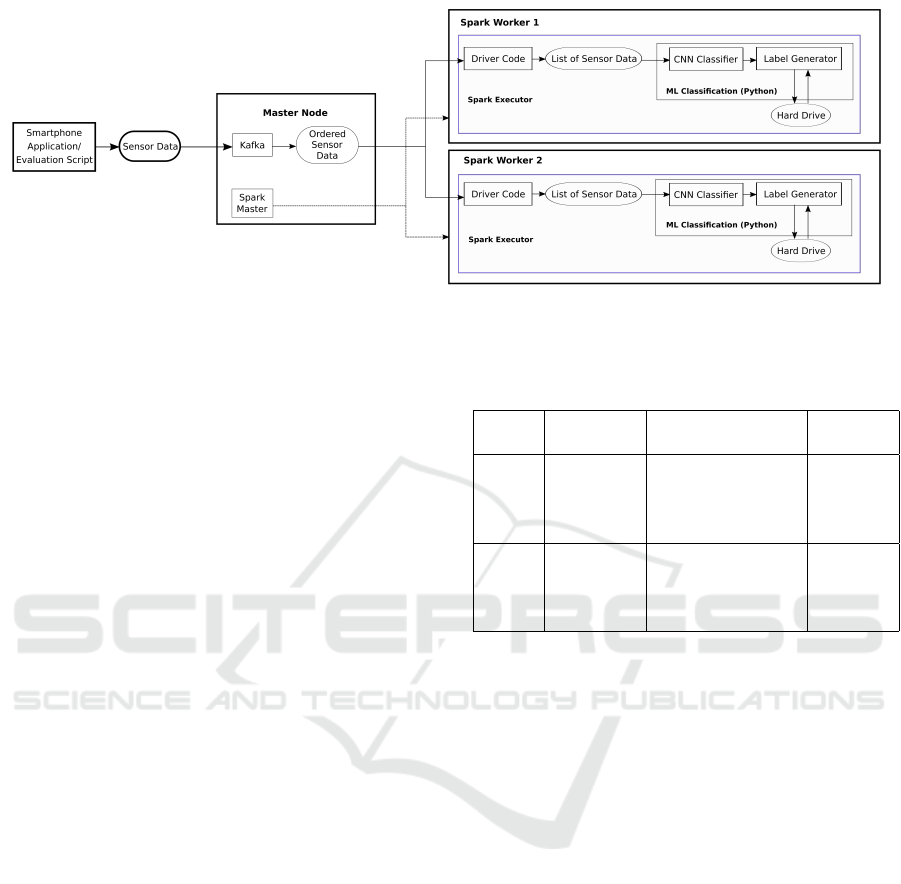
Figure 1: Overview of the data stream processing framework.
and a sampling frequency of 100Hz of the sensors,
n equals 3000. After preprocessing, a CNN classi-
fier was trained with a list of sensor data (see Section
2.5) and the data was classified. The classification
results (labels) are formatted and stored on the disk.
Finally, corresponding Docker container-images were
built for the Spark Master/Worker containers, which
provide an environment that meets the requirements.
To create the container-images for the Spark Worker
and the Master/Worker, a Docker file is created by us-
ing the image tensorflow/tensor- flow:1.14.0-py3 as a
basis, via Python 3.6 and TensorFlow on a Ubuntu
18.04 system.
2.5 Data Classification
For data classification, a trained Python classification
model was adapted to the online characteristics and
used for classification of the preprocessed sensor data
within the CNN classifier. For HAR classification
a windowing approach is used per user in intervals
of 30 seconds with. Thus, batch processing is trig-
gered every 30 seconds and the classification is initi-
ated for the current data frame (including acceleration
and gyroscope-measures and the measurement time).
During initialization, the model is loaded, and vari-
ables such as the path to the label list, step size, and
window size are defined,and the dataset is classified.
A list of labeled IDs y and a label map are returned,
in which the label and textual descriptions are placed
in a context.
2.6 Evaluation Setup
To identify factors influencing the performance of
data stream processing for HAR systems in terms of
throughput and latency, the following evaluation was
conducted in accordance with (Jain, 1990). Through-
put, defined as users per batch, measures the maxi-
Table 1: Setting of the performance evaluation of the data
stream processing system.
Settings Hardware
(per server)
Independent vari-
ables
Dependent
Variables
1 8GB RAM,
8 cores
Batch interval,
Number of users,
Cluster configura-
tions
Latency,
Through-
put
2 16GB
RAM,
16 cores
Batch interval,
Number of users,
Cluster configura-
tions
Latency,
Through-
put
mum number of users whose sensor data the system
can process simultaneously. Latency is the time be-
tween a job’s start and the availability of classifica-
tion results. Both throughput and latency depend on
the batch interval, user count, and Spark cluster con-
figuration.
In the experiment, three virtual servers were used.
Each, equipped with Intel(R) Xeon(R) CPU E5-2683
v4 @ 2.10GHz with 16 cores, a memory of 16GB
with a Red Hat Enterprise Linux 7 Operating System
and a 100GB HD Hard disk space. To conduct the
aforementioned evaluation, throughput and latency
are measured iteratively for different factor combi-
nations.Two settings are configured to determine the
correlations between the independent (i.e. batch in-
terval, number of users and cluster configurations)
and dependent variables (i.e. latency and through-
put). In setting 1, each slave-nodes have 8 cores and
8GB RAM, while in setting 2 the number of cores
and RAM was doubled. This enabled the evaluation
of the system’s vertical scaling. Per worker node, at
least one core and at least one GB of RAM were re-
served for the operating system and Docker. Thus,
only the remaining memory and cores could be used
for the data stream processing.
The parameter shuffle.partition was used to con-
HEALTHINF 2025 - 18th International Conference on Health Informatics
574
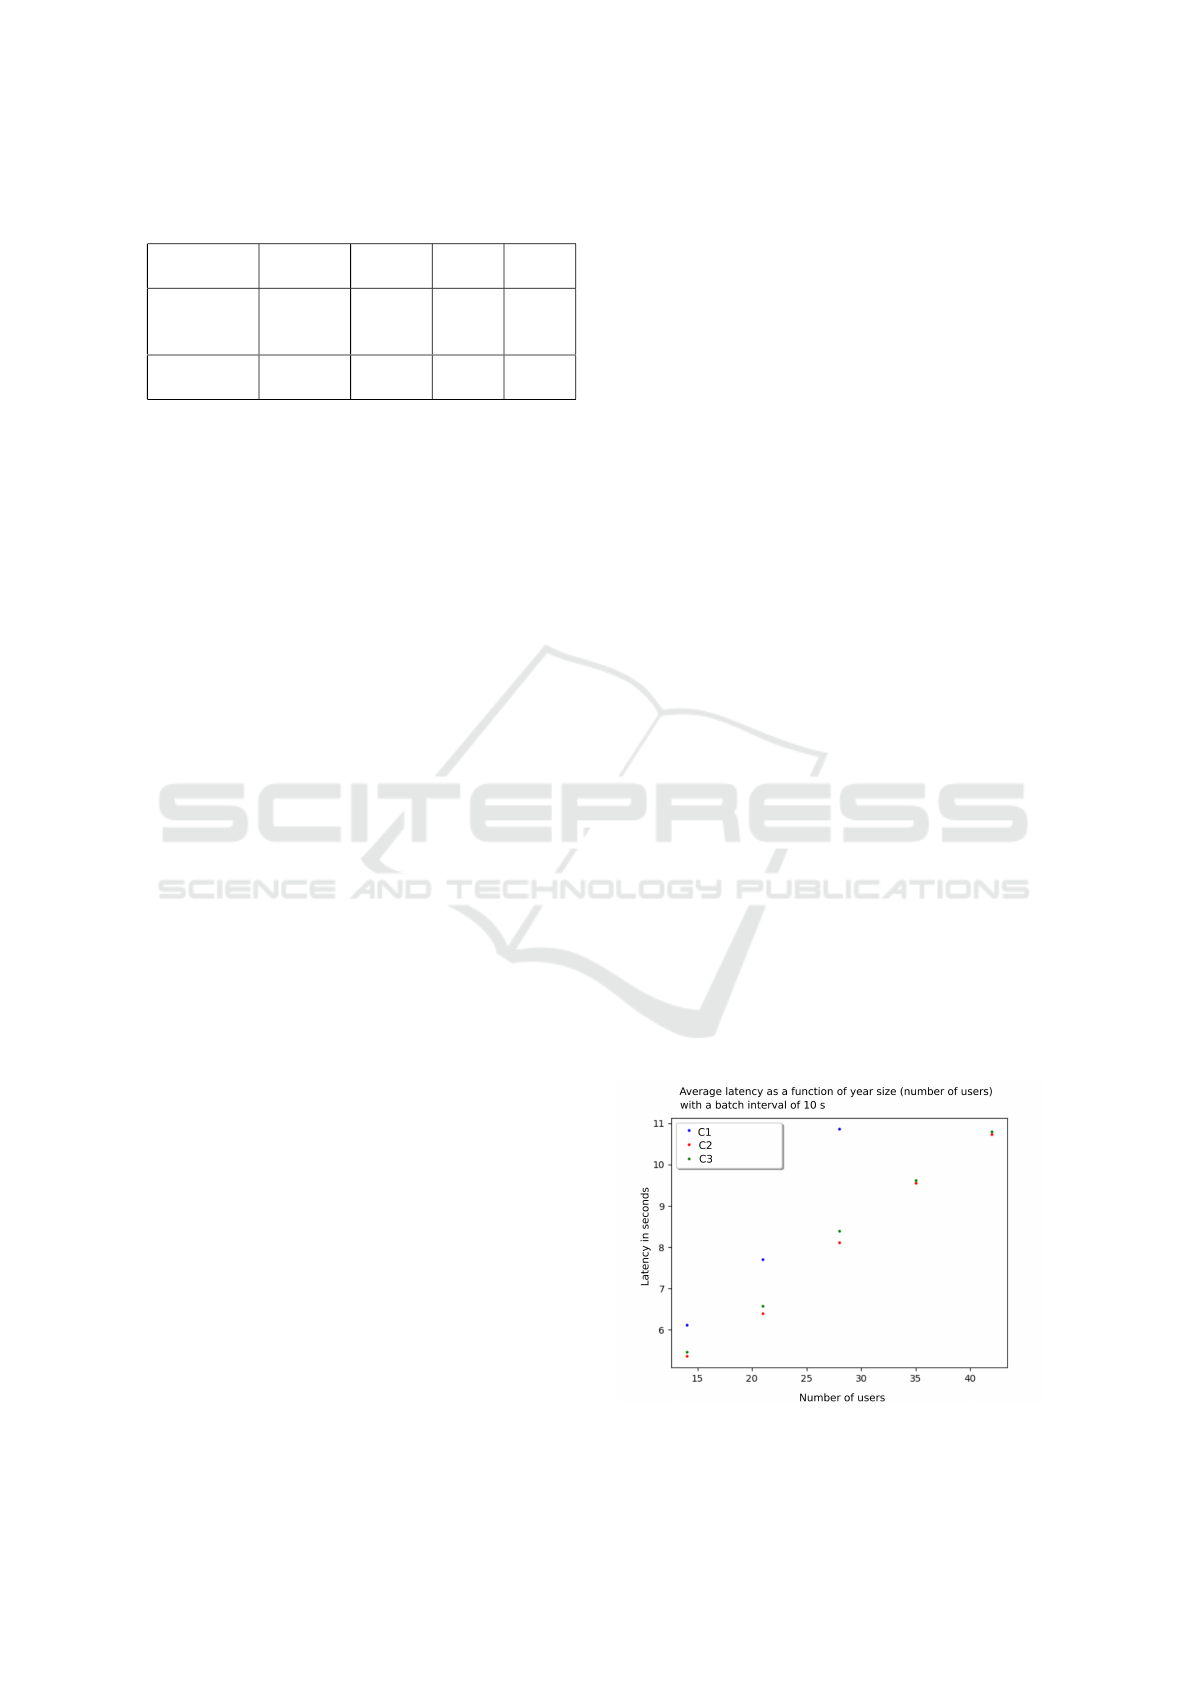
Table 2: Overview of the analyzed Spark Cluster configura-
tions.
Experiments Configu-
rations
Executor/
node
Cores/
executor
RAM/
executor
Setting 1 C1
C2
C3
14
2
4
1
7
4
1 (GB)
7 (GB)
3 (GB)
Setting 2 C4
C5
2
4
14
7
14 (GB)
7 (GB)
trol the number of tasks per job. The maximum num-
ber of tasks was executed in parallel, based on the to-
tal number of cores (14 in the first setting and 28 in the
second). Additionally, Kafka consisted of five parti-
tions in both settings. The batch interval was changed
between 10, 20 and 30 seconds. The different cluster
configurations resulted from the adjustment of three
parameters:
• The number of executors in the cluster
• The number of cores per executor and
• The RAM per executor
In order to evaluate the different combinations as
efficiently as possible, two extreme cases and a bal-
anced configuration were analyzed (see Table 2).
Configurations C1 to C3 are part of the first set-
ting and the configurations C4 and C5 are part of the
second setting: C1 corresponds to the extreme case
of many executors with few resources. For the sec-
ond setting, this configuration was not evaluated be-
cause the performance in setting 1 dropped signifi-
cantly compared to the other two configurations. C2
and C4 correspond to the extreme configuration, few
executors with many resources, and C3 and C5 corre-
spond to the balanced configuration. C3 has a total of
2 cores and 2GB RAM less available. This is due to
the fact that the 14 available cores/GB of RAM for the
configuration type cannot be symmetrically split be-
tween two nodes. Besides the possibility of evaluating
vertical scaling, this inequality is a reason for setting 2
to be able to perform a fair performance comparison.
While the batch interval and the cluster configu-
ration parameters are adjusted via Spark’s driver pro-
gram, the number of users and the number of data se-
ries are adjusted via a Python script, which simulates
the data sources. The sensor’s sampling frequency is
set to 100Hz. Extrapolated to the different batch in-
tervals, the number of data series are adjusted accord-
ingly.
To perform the above-mentioned experiments, the
throughput and latency were measured iteratively
across parameter combinations. Latency was aver-
aged from 50 job runtimes via the Spark Web UI,
while throughput was based on user count. Maximum
throughput was reached when job duration exceeded
the batch interval or resource limits caused program
termination.
3 RESULTS
In this section, we present experimental results for an-
alyzing the influence of the system parameters on per-
formance metrics, notably latency and throughput.
3.1 Influence of Factors on Latency in
Setting 1
Figures 2 and 3 summarize the results of the latency
as a function of the number of users for the three batch
intervals. In general, C2 (few executors with many re-
sources including 30 seconds batch intervals) showed
the best performance in terms of latency among set-
ting 1.
At a batch interval of 10 seconds, C2 shows the
smallest latency, closely followed by C3. Both con-
figurations show an approximately linear relationship
between the job size (number of users) and the la-
tency (job duration). For C1, the latency is signif-
icantly higher in comparison and with a user count
of 28, the average latency is already higher than the
batch interval. Up to a number of users of 30, C3 has a
lower latency than C1. After that, the reverse relation-
ship applies up to a number of users of 39, where the
program crashes for both configurations due to lack
of resources. It is noticeable that C3 crashes when
the number of users exceeds 40, while C1 can still
process data from up to 60 users before the program
crashes. One explanation for this is the problem that
C3 has a total of 2 cores and 2GB RAM less than
C1. Larger batch intervals improve efficiency, reduc-
Figure 2: Latency as a function of the number of users at a
batch interval of 10 seconds (setting 1).
Performance Analysis of a Data Stream Processing System for Online Activity Classification via Wearable Sensor Data
575
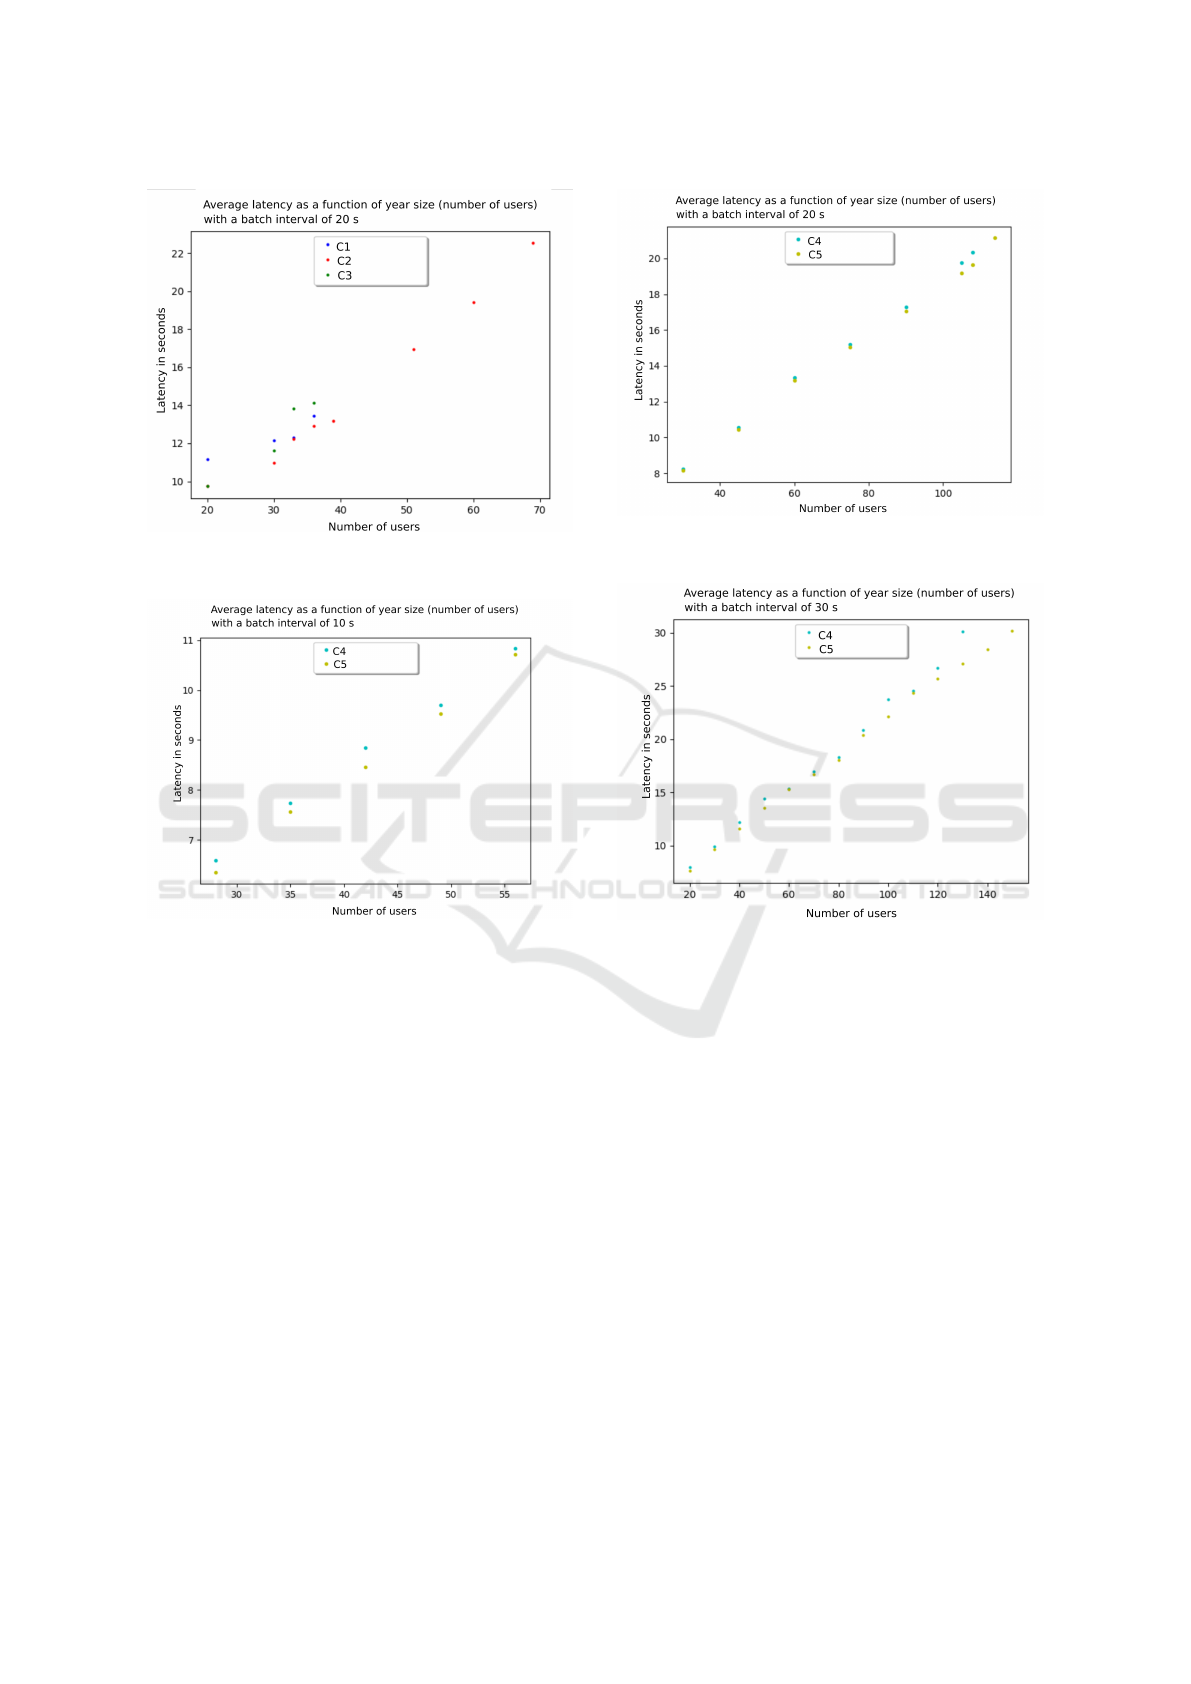
Figure 3: Latency as a function of the number of users at a
batch interval of 30 seconds (setting 1).
Figure 4: Latency as a function of the number of users at a
batch interval of 10 seconds (setting 2).
ing overall processing latency, likely due to model
loading times. However, batch size has less impact
on latency compared to the number of users.
3.2 Influence of Factors on Latency in
Setting 2
Considering the impact of executors’ processing
power on the latency, we compared configuration C4
which has doubled cores and RAM, but half the num-
ber of executors per worker in contrast to C5. The
results are shown in Figures 4 to 6 . For all three
batch intervals (10 − 30 seconds), C5 has the lowest
latency as a function of the number of users. The re-
lationship between the number of users and latency is
almost linear for both configurations. We found that
increasing the number of executors, rather than their
power, improves processing latencies, but this applies
only to resource redistribution, not vertical scaling.
Figure 5: Latency as a function of the number of users at a
batch interval of 20 seconds (setting 2).
Figure 6: Latency as a function of the number of users at a
batch interval of 30 seconds (setting 2).
3.3 Influence of Vertical Scaling on
Latency
The effect of vertical scaling on latency is illustrated
by comparing C2 to C5 in 7, using the 30 second
batch interval as an example. The comparable con-
figurations are C2 and C4 (few, large executors) and
C3 and C5 (balanced executors). As expected, C4 and
C5, which use around twice as many cores and main
memory, have a significantly lower latency than their
comparison configuration. For configurations C2 and
C4, the latency is significantly higher: E.g. for a user
number of 20, an improvement in performance (re-
duction in latency) of 18% can be observed. This in-
creases continuously up to an improvement of 34%
with a user number of 90. There are only three com-
parison points for C3 and C5 (20, 30, 40 users), since
the program crashes with C3 with more than 40 users.
The latency can be reduced by 22%, 32% and 28% in
HEALTHINF 2025 - 18th International Conference on Health Informatics
576
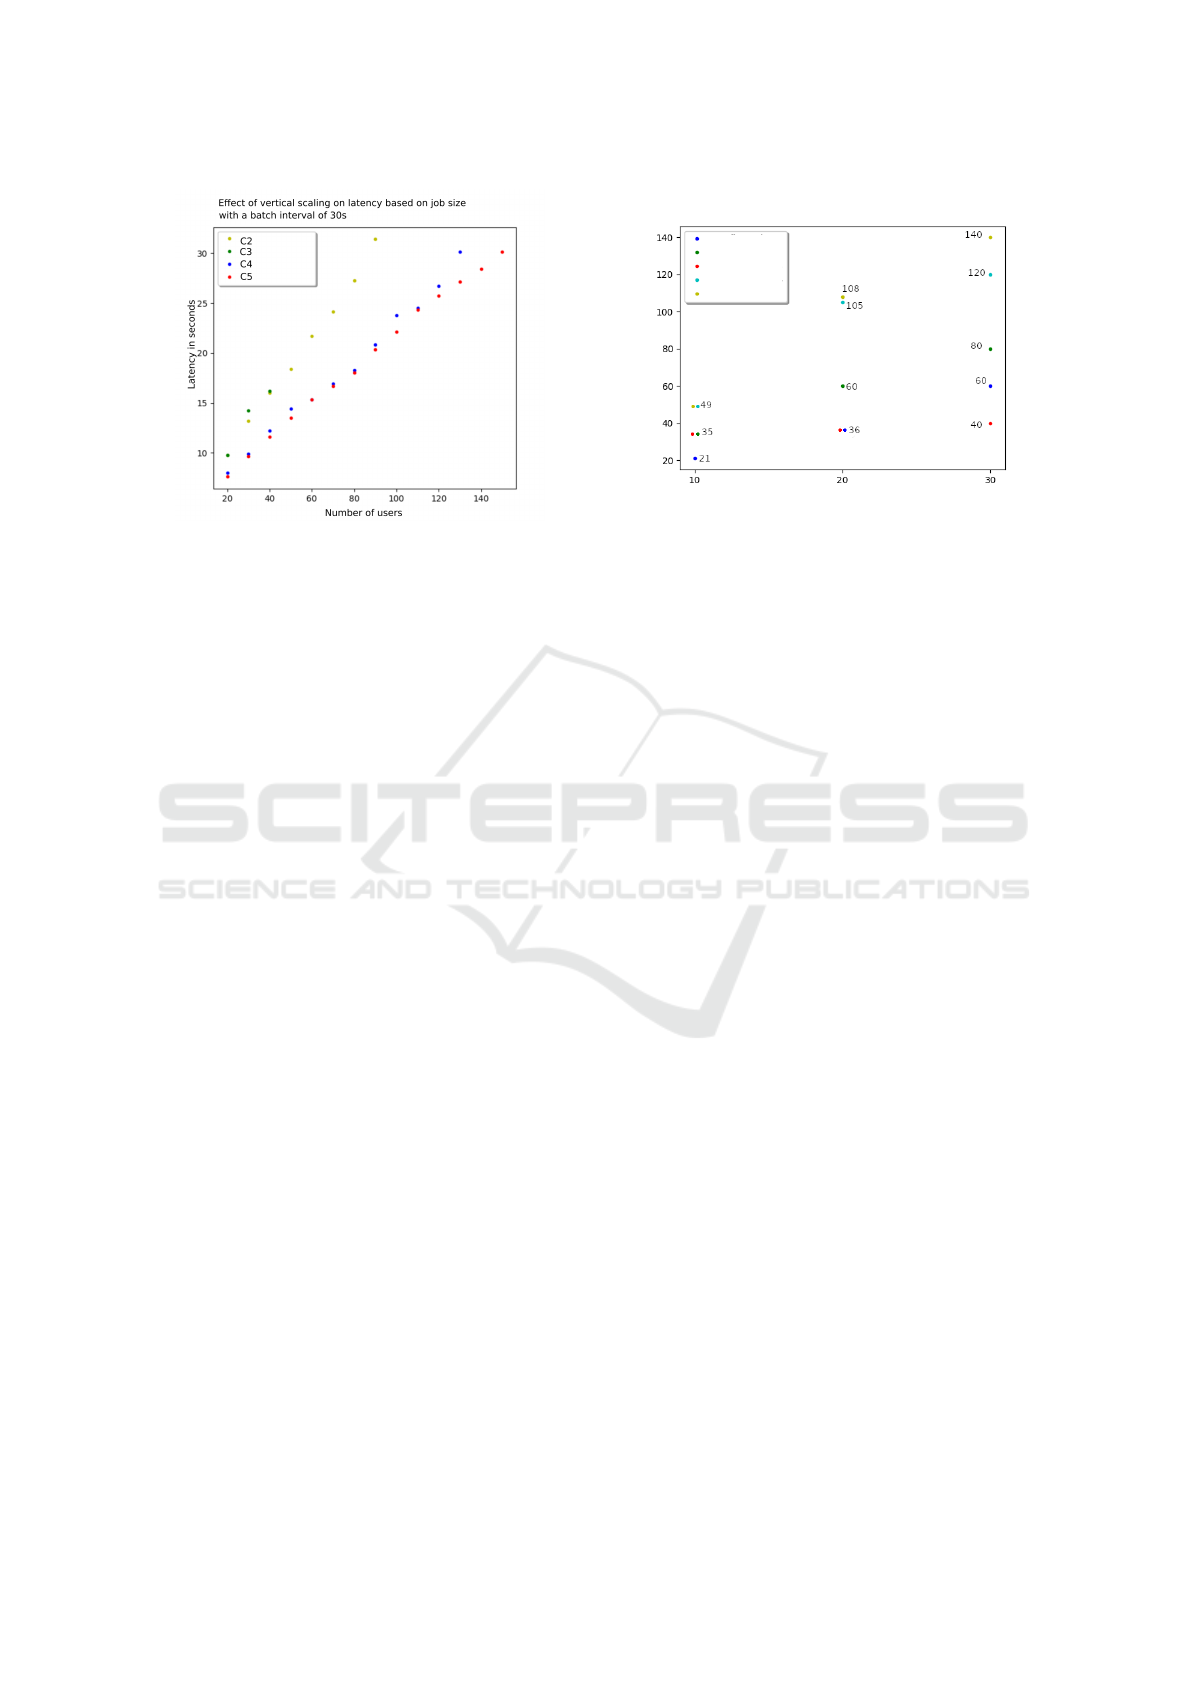
Figure 7: Latency based on the number of users for a batch
interval of 30 seconds.
the three cases by doubling the RAM and cores (C5).
Reducing latency is crucial for higher throughput, as
job duration must stay within the batch interval. How-
ever, doubling resources significantly increases costs,
and latency reduction is below 50%, making verti-
cal scaling impractical unless low latency is critical.
Doubling executor nodes is likely a more practical al-
ternative.
3.4 Influence of Factors on Throughput
Figure 8 shows the throughput (the maximum users
per batch) per configuration as a function of the batch
interval. The corresponding values of the comparison
as data series per batch or data series per second are
shown in Tables 1 and 2.
With a batch interval of 10 seconds, C1 has the
lowest throughput with 21 users per batch. C2 and
C3 both have a throughput of 35 and C4 and C5 of
49 users per batch. Thus, the vertical scaling has in-
creased the throughput by 40%.
For a batch interval of 20 seconds, C1 and C3
achieve low throughput with 36 users per batch. In
contrast, C2, C4 and C5 achieve 60, 105 and 108
users per batch respectively. This corresponds to an
improvement in throughput of 75% to 200% due to
vertical scaling.
Similar results can be found for a batch interval
of 30 seconds, where C3 and C1 achieved a through-
put of 40 and 60 users per batch. C2 with 80 users
per batch and C4 and C5 outperformed the previous
configurations 120 and 140 users per batch, respec-
tively. Thus, the vertical scaling configurations has
resulted in a 50% and 250% increase in throughput.
Consequently, we found a strong motivation of ap-
plying vertical scaling to increase throughput. De-
pending on the batch size the throughput can be ex-
Throughput (number of users) depending on batch interval
per configuration
Throughput (in users/batch)
Batch interval (seconds)
C2
C3
C4
C5
C1
Figure 8: Throughput (number of users) based on batch in-
terval per configuration.
tended by 200 to 300%. For configurations that have
the same throughput at a batch interval, the data points
have been plotted side by side to provide a better rep-
resentation for interpretation (see Figure 8).
4 CONCLUSION AND FUTURE
WORK
In this article, we conducted a performance evaluation
of a Kafka and Spark-based data stream processing ar-
chitecture for motion classification, to determine the
effects of hardware distribution, Spark configuration,
and batch intervals on the dependent parameters of
throughput and latency.
Considering the configurations, we found two
general challenges that should be prevented: First, too
little main memory per executor (see C1) leads to a
limitation in throughput and secondly small number
of cores per executor (see C3) results in a limitation
of latency. These lead to the fact that an executor can
only execute one (see C1) or fewer (see C3) tasks in
parallel.
In setting 1, the balanced configuration (C2)
achieved the best throughput and lowest latency
across all batch sizes and user counts. Throughput
and latency are interdependent, with high throughput
prioritized to support multiple users, while latency is
less critical due to batch processing requirements.
In setting 2, hardware disparities between C2 and
C3 are balanced by doubling resources, with C4 and
C5 each having 28 cores and 28GB RAM. Vertical
scaling reduces latency and increases throughput. Un-
like setting 1, configurations with fewer executors but
more resources (C2 and C4) no longer perform best,
as resource equality allows both configurations to uti-
lize the same cores and memory. Higher throughput
Performance Analysis of a Data Stream Processing System for Online Activity Classification via Wearable Sensor Data
577

Table 3: Setting of the performance evaluation of the data
stream processing system.
Configurations Latency im-
provement
(in%)
Throughput
improvement
(in%)
C4 27.05 55
C5 28.2 163.33
increases garbage collection time, extending job du-
ration for fewer executors.
Table 3 shows that doubling cores and RAM re-
duces latency by 30% and significantly improves
throughput, with increases of up to 160% in C5, high-
lighting the impact of vertical scaling.
In summary, the balanced configuration achieves
the highest throughput with the lowest latency, with
vertical scaling offering the best performance gains.
Batch interval prioritization depends on application
needs, as larger intervals increase both latency and
throughput. With current hardware and a 30-second
batch interval, the system supports 140 users for con-
tinuous HAR data processing.
The Spark-based data stream processing frame-
work achieves significant performance improve-
ments, with 28.2% lower latency and 163.33% higher
throughput using 28 cores and 28GB RAM. Reducing
latency in cloud computing is challenging due to con-
nectivity dependencies, while edge computing (e.g.,
smartphones) simplifies latency reduction. Through-
put improvements depend on edge device capacity but
are affected in cloud computing by internet transfer
delays, which can hinder real-time applications.
With online servers offering 64 cores and 64GB
RAM costing around 300e per month and support-
ing 300-400 users, compute storage costs remain sig-
nificant but manageable. Reducing pre-processing
on edge devices while running intensive analytics on
central servers could be a viable future approach.
ACKNOWLEDGEMENTS
This work is supported by the German Federal Min-
istry of Education and Research (BMBF) within the
Junior research group ”Integration and analysis of
multimodal sensor signals for research into neurolog-
ical movement disorders” (MoveGroup) at the Uni-
versity of Lubeck (grant number: 01ZZ2007).
REFERENCES
Agarwal, P. and Alam, M. (2020). A lightweight deep learn-
ing model for human activity recognition on edge de-
vices. Procedia Computer Science, 167:2364–2373.
Ali Mohamed, M., El-Henawy, I. M., and Salah, A. (2021).
Usages of spark framework with different machine
learning algorithms. Computational Intelligence and
Neuroscience, 2021(1):1896953.
Apache Kafka (2024). Apache kafka performance. Ac-
cessed: 2024-10-21.
Aroganam, G., Manivannan, N., and Harrison, D. (2019).
Review on wearable technology sensors used in con-
sumer sport applications. Sensors, 19(9):1983.
Chithra, S., Maheswari, D., and Sethurathinam, C. (2022).
A comparative study on cloud computing and edge
computing with its applications. Indian J. Nat. Sci,
12:32241–32247.
Docker Inc. (2024). Docker overview. Accessed: 2024-10-
21.
Fudickar, S., Kiselev, J., Frenken, T., Wegel, S., Dim-
itrowska, S., Steinhagen-Thiessen, E., and Hein, A.
(2020). Validation of the ambient tug chair with light
barriers and force sensors in a clinical trial. Assistive
Technology, 32(1):1–8.
Garg, N. (2013). Apache kafka. Packt Publishing Birming-
ham, UK.
Inoubli, W., Aridhi, S., Mezni, H., Maddouri, M., and
Nguifo, E. M. (2018). An experimental survey on big
data frameworks. Future Generation Computer Sys-
tems, 86:546–564.
Jain, R. (1990). The art of computer systems performance
analysis. john wiley & sons.
Khannouz, M. and Glatard, T. (2020). A benchmark of data
stream classification for human activity recognition on
connected objects. Sensors, 20(22):6486.
Maaloul, K., Brahim, L., and Abdelhamid, N. M.
(2023). Real-time human activity recognition from
smart phone using linear support vector machines.
TELKOMNIKA (telecommunication Computing Elec-
tronics and Control), 21(3):574–583.
Mart
´
ın, C., Langendoerfer, P., Zarrin, P. S., D
´
ıaz, M., and
Rubio, B. (2022). Kafka-ml: Connecting the data
stream with ml/ai frameworks. Future Generation
Computer Systems, 126:15–33.
Namiot, D. (2015). On big data stream processing. Inter-
national Journal of Open Information Technologies,
3(8):48–51.
Nasiri, H., Nasehi, S., and Goudarzi, M. (2019). Evalua-
tion of distributed stream processing frameworks for
iot applications in smart cities. Journal of Big Data,
6(1):52.
Salloum, S., Dautov, R., Chen, X., Peng, P. X., and Huang,
J. Z. (2016). Big data analytics on apache spark. In-
ternational Journal of Data Science and Analytics,
1:145–164.
Zebin, T., Scully, P. J., Peek, N., Casson, A. J., and
Ozanyan, K. B. (2019). Design and implementation
of a convolutional neural network on an edge comput-
ing smartphone for human activity recognition. IEEE
Access, 7:133509–133520.
HEALTHINF 2025 - 18th International Conference on Health Informatics
578
