
Integrating Image Quality Assessment Metrics for Enhanced
Segmentation Performance in Reconstructed Imaging Datasets
Samiha Mirza
1
, Apurva Gala
2
, Pandu Devarakota
2
, Pranav Mantini
1
and Shishir K. Shah
1
1
Quantitative Imaging Lab, University of Houston, TX, U.S.A.
2
Shell Information Technology International Inc., Houston, TX, U.S.A.
Keywords:
Image Quality Assessment, Segmentation, MRI, Seismic Imaging.
Abstract:
Addressing the challenge of ensuring high-quality data selection for segmentation models applied to recon-
structed imaging datasets, particularly seismic and MRI data, is crucial for enhancing model performance.
These datasets often suffer from quality variations due to the complex nature of their acquisition processes,
leading to the model failing to generalize well on these datasets. This paper investigates the impact of incor-
porating Image Quality Assessment (IQA) metrics into the data selection process to mitigate this challenge.
By systematically selecting images with the highest quality based on quantitative metrics, we aim to improve
the training process of segmentation models. Our approach focuses on training salt segmentation models for
seismic data and tumor segmentation models for MRI data, illustrating the influence of image quality on seg-
mentation accuracy and overall model performance.
1 INTRODUCTION
Over the past decades, researchers in artificial intelli-
gence (AI) have primarily focused on enhancing ma-
chine learning (ML) models within the model-centric
AI paradigm. This approach has driven significant
advancements in AI-based systems (Minaee et al.,
2021; Krizhevsky et al., 2017), emphasizing improve-
ments in algorithms and computational techniques.
However, the selection of suitable data for training
plays a crucial role in determining the effectiveness
and efficiency of these models (Singh, 2023; Hamid,
2022). The quality and quantity of data impact not
only model performance but also the costs associated
with labeling and training (Zha et al., 2023). De-
spite extensive research in data engineering, the im-
portance of data quality and quantity in AI systems is
often overlooked. Hence, data-centric AI (Ng et al.,
2021; Zha et al., 2023) emphasizes the systematic de-
sign of datasets and the engineering of data quality
and quantity to improve AI system performance. This
approach is not just about having more data but also
about selecting appropriate data for model training.
One critical aspect of data-centric AI is the selec-
tion of high-quality data (Motamedi et al., 2021). This
task is particularly challenging in the context of re-
constructed imaging datasets, such as seismic data in
the energy sector and MRI, CT, or X-ray datasets in
the medical field (Adeoye et al., 2023). Unlike natural
image datasets captured using cameras, reconstructed
imaging datasets are often generated through complex
computational processes. These datasets can vary
significantly in quality depending on the instruments
used, with some images containing artifacts, noise,
or other distortions that can adversely affect model
training (Devarakota et al., 2022; Alkan et al., 2022).
Therefore, ensuring the selection of high-quality data
is essential for developing robust segmentation mod-
els in these specialized fields.
To illustrate the challenge, consider seismic im-
ages used by geologists to identify the presence of top
salt layer (Jones and Davison, 2014) and MRI scans
used in the medical field for tumor segmentation. Fig-
ure 1 shows examples of MRI and seismic images
with varying Integrated Local Natural Image Quality
Evaluator (ILNIQE) scores, indicating image quality.
On the left, we see images with high ILNIQE scores,
representing lower quality, which leads to poor seg-
mentation predictions using a trained model. In con-
trast, the images on the right, with lower ILNIQE
scores, exhibit higher quality and result in signifi-
cantly better segmentation predictions using the same
model. This clear correlation between image quality
and prediction accuracy underscores the critical role
of selecting high-quality data in training robust seg-
mentation models.
Hence, we propose the use of Image Quality As-
sessment (IQA) metrics (Wang and Bovik, 2006; Zhai
and Min, 2020) to evaluate and select the best im-
ages for training segmentation models. IQA provides
450
Mirza, S., Gala, A., Devarakota, P., Mantini, P. and Shah, S. K.
Integrating Image Quality Assessment Metrics for Enhanced Segmentation Performance in Reconstructed Imaging Datasets.
DOI: 10.5220/0013166400003912
Paper published under CC license (CC BY-NC-ND 4.0)
In Proceedings of the 20th International Joint Conference on Computer Vision, Imaging and Computer Graphics Theory and Applications (VISIGRAPP 2025) - Volume 3: VISAPP, pages
450-457
ISBN: 978-989-758-728-3; ISSN: 2184-4321
Proceedings Copyright © 2025 by SCITEPRESS – Science and Technology Publications, Lda.
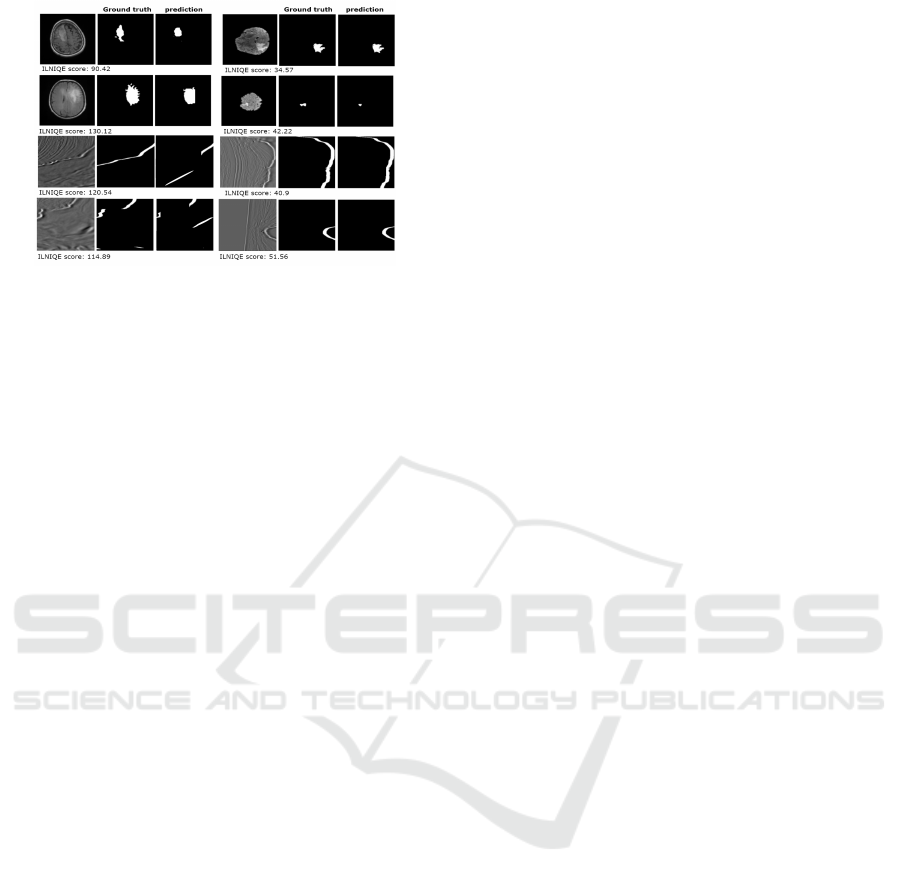
Figure 1: Examples of segmentation performance on im-
ages with varying quality, as indicated by ILNIQE scores.
Images with higher ILNIQE scores (left) represent lower
quality and lead to poor model predictions, while images
with lower ILNIQE scores (right) indicate higher quality
and result in more accurate segmentation predictions. Data
courtesy of TGS.
a quantitative framework to objectively determine im-
age quality, ensuring that only the highest-quality im-
ages are included in the training dataset (Mirza et al.,
2024). By integrating IQA, we aim to enhance the
performance of segmentation models applied to re-
constructed imaging datasets such as salt segmenta-
tion in seismic imaging and tumor segmentation in
MRI scans, thereby improving the accuracy and re-
liability of these models. This paper makes the fol-
lowing contributions:
• Propose a novel approach to integrate IQA metrics
to select high-quality images for training segmen-
tation models in reconstructed image datasets.
• Demonstrate the effectiveness of this approach in
enhancing the model performance of salt segmen-
tation in seismic and tumor segmentation in MRI.
• Provide a comprehensive summary of applying
state-of-the-art IQA metrics to these two domains,
showcasing their impact on improving model ac-
curacy and reliability.
2 RELATED WORKS
2.1 IQA for Data Selection
In Facial Recognition. Several studies have ex-
plored the link between image quality and recognition
performance. Dutta et al. (Dutta et al., 2015) pre-
dicted recognition performance using quality features
like pose and illumination. Galbally et al. (Galbally
et al., 2013) integrated life assessment through image
quality metrics to improve biometric security. Nisa
et al. (Nisa et al., 2022) assessed supervised and un-
supervised FIQA methods for ensuring optimal qual-
ity in an Asian face dataset. Zhung et al. (Zhuang
et al., 2019) developed a DCNN for selecting high-
quality facial images by evaluating factors like bright-
ness, contrast, and occlusion.
In Segmentation. Saeed et al.(Saeed et al., 2021)
introduced a dual neural network framework that uses
reinforcement learning, where a controller network
selects images to maximize task performance, allow-
ing it to discard those negatively impacting accuracy,
and a target task predictor optimized on the training
set. However, the work in using IQA in segmenta-
tion has been very limited. Hence, in our study, we
focus on using IQA for data selection for our seg-
mentation models to improve performance and ensure
higher quality input images, ultimately enhancing the
accuracy and robustness of our segmentation tasks.
2.2 State-of-the-Art IQA Metrics
IQA metrics in the literature can be broadly cat-
egorized into three types: full-reference (FR),
reduced-reference (RR), and no-reference (NR). Full-
reference metrics require a reference image to com-
pare against the test image, while reduced-reference
metrics use partial information about the reference
image. NR metrics, on the other hand, do not require
any reference image and assess quality based solely
on the test image itself. Our focus is on NR-IQA met-
rics, which are more applicable in real-world scenar-
ios where a reference image is often unavailable.
The Integrated Local Natural Image Quality
Evaluator (ILNIQE) (Zhang et al., 2015) and
Blind/Referenceless Image Spatial Quality Evaluator
(BRISQUE) (Mittal et al., 2011) are early notable
NR-IQA metrics. ILNIQE evaluates image quality
using local natural scene statistics modeled with a
Gaussian Mixture Model (GMM), while BRISQUE
uses grayscale normalization and Mean Subtracted
Contrast Normalized (MSCN) coefficients to assess
quality based on deviation from a Gaussian model.
CNNIQA (Kang et al., 2014) introduced CNN-based
feature learning for quality prediction, setting the
stage for methods like DBCNN, which aggregates lo-
cal and global features from image patches. Hyper-
IQA employs a self-adaptive hyper network to dy-
namically integrate features for robust generalization
across diverse datasets (Su et al., 2020). ManIQA fur-
ther advances quality assessment using Vision Trans-
formers (ViT) and attention mechanisms to enhance
local and global feature interactions (Yang et al.,
2022).
Integrating Image Quality Assessment Metrics for Enhanced Segmentation Performance in Reconstructed Imaging Datasets
451

3 METHODOLOGY
3.1 Problem Definition
The overall pipeline is depicted in Figure 2, illustrat-
ing the systematic approach of using IQA metrics for
data selection, followed by model training and evalua-
tion. The task involves training a segmentation model
using high-quality images to improve the model’s per-
formance. Given a set of training datasets D
train
=
{Train
i
}
n
i=1
, where n is the number of datasets and
each dataset Train
i
consists of images {I
i j
}
m
j=1
, with
m being the number of images, the goal is to select
best quality images from these datasets. To achieve
this, we employ image quality assessment (IQA) met-
rics. Let M represent the set of IQA metrics, with
M = {M
l
},
l∈{BRISQUE,ILNIQE,CnnIQA,DBCNN,HyperIQA,ManIQA}
.
Each image I
i j
is evaluated using these metrics l to
obtain a score s
l
i j
:
s
l
i j
= M
l
(I
i j
),
where s
l
i j
∈ R.
3.2 Proposed Pipeline
Data Selection Phase. Each image I
i j
in the training
datasets is assessed using the IQA metrics in M . For
each metric M
l
, a threshold T
l
is defined based on
the overall scores value distribution. An image I
i j
is
selected if its score s
l
i j
exceeds the threshold T
l
:
I
i j
∈ D
selected
if
s
l
i j
> T
l
for l ∈ {CnnIQA,
DBCNN, HyperIQA,
ManIQA}
s
l
i j
< T
l
for l ∈ {BRISQUE,
ILNIQE}
The set D
selected
contains all selected high-quality
images. One challenge of this approach is to set ap-
propriate thresholds T
l
for these scores to select high-
quality images for training.
Model Training and Evaluation Phase. In the
model training and evaluation phase, the selected im-
ages D
selected
are used to train a segmentation model
f
θ
with parameters θ. The training objective is to min-
imize the binary cross-entropy loss L
BCE
over the se-
lected training set:
θ
∗
= argmin
θ
∑
I
i j
∈D
selected
L
BCE
( f
θ
(I
i j
), I
gt
i j
),
where I
gt
i j
represents the ground truth mask for im-
age I
i j
.
4 EXPERIMENTS
4.1 Implementation Details
We conducted experiments using the U-net architec-
ture (Ronneberger et al., 2015), which features an
encoder-decoder structure wherein the encoder ex-
tracts high-level features through a series of convolu-
tions and max-pooling operations, while the decoder
restores spatial dimensions using transposed convolu-
tions. Skip connections are used to retain detailed in-
formation. For training the U-net models, we used the
Adam optimizer (Kingma and Ba, 2014). We set the
batch size to 32 and trained the models for 30 epochs,
maintaining a fixed learning rate of 0.001. Addition-
ally, we implemented a pacing function, specifically
the ReduceOnPlateau scheduler, to dynamically ad-
just the learning rate during training. This sched-
uler reduces the learning rate when the validation loss
stops improving, enabling more efficient model con-
vergence. For evaluating our models, we utilize the
Dice coefficient, the Area Under the Curve (AUC)
of the Precision-Recall (PR) score, and the confusion
matrix.
4.2 Datasets
We apply our approach in the context of two appli-
cation domains: 1) top salt segmentation in seismic
images and 2) brain tumor segmentation in magnetic
resonance images (MRIs).
4.2.1 Salt Segmentation in Seismic
As shown in Table 1, we used 3 distinct seismic
datasets to train and evaluate our models. Dataset
A
,
Dataset
B
, and Dataset
C
, are 3D seismic volumes from
which 2D images, measuring 256 × 256 pixels are
sliced at regular intervals in an inline and crossline
manner (Yilmaz, 2001). Dataset
A
is a substantial vol-
ume with 14k images. Dataset
B
and Dataset
C
are
comparatively smaller in scale with nearly 4k im-
ages in each. For testing, we used two separate 3D
volumes, from different survey regions, denoted by
Test
A
and Test
B
containing 450 and 843 images re-
spectively. Using two distinct test sets allows us to
capture different geological or seismic challenges, as
volumes can vary in complexity, noise, resolution etc.
4.2.2 Brain Tumor Segmentation in MRI
As shown in Table 1, we utilized four MRI datasets:
UPENN (Bakas et al., 2022), UCSF (Calabrese et al.,
2022), BraTS20 (Bakas et al., 2017; Bakas et al.,
VISAPP 2025 - 20th International Conference on Computer Vision Theory and Applications
452
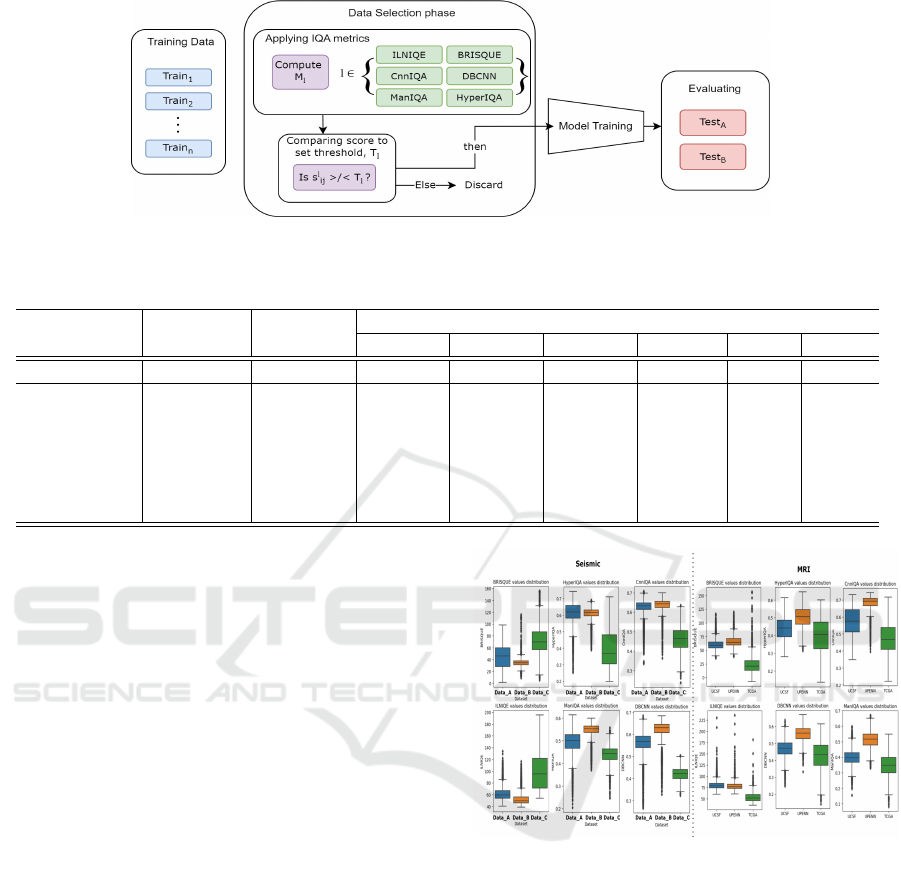
Figure 2: Overview of the proposed pipeline for selecting training data using IQA metrics, training the segmentation model,
and evaluating its performance.
Table 1: Data selection statistics for seismic.
Seismic Data MRI Data
Metric Threshold Dataset
A
Dataset
B
Dataset
B
UPENN UCSF TCGA
Total images 14986 4170 4216 4215 6148 2128
# of images
selected
BRISQUE 70 13448 3689 2040 2900 5067 1867
ILNIQE 100 14849 3952 2268 3898 5680 1920
CnnIQA 0.4 14727 3745 3288 4004 5836 1513
DBCNN 0.35 14665 3732 3190 4004 5724 1572
HyperIQA 0.3 14721 3750 3060 4005 5828 1579
ManIQA 0.38 13898 3729 3392 3962 3801 673
2018; Menze et al., 2014), and TCGA (Buda et al.,
2019; Mazurowski et al., 2017). UCSF includes 3D
MRI images gathered from the University of Califor-
nia, San Francisco and includes nearly 6k 2D gener-
ated images after slicing the 3D scans. UPENN com-
prises approximately 4.2k 2D generated images, with
each image typically having dimensions of 256×256
pixels. BraTS is a widely-used benchmark dataset
consisting of MRI images collected from multiple in-
stitutions and we used approximately 3.4k 2D im-
ages. The TCGA-TCIA dataset combines MRI im-
ages from The Cancer Genome Atlas (TCGA) col-
lection and from The Cancer Imaging Archive from
which we used nearly 2k images.
5 RESULTS AND DISCUSSION
5.1 Distribution of IQA Metric Values
The distribution of IQA metric values is shown in Fig-
ure 3. For BRISQUE and ILNIQE, lower scores in-
dicate better image quality, while higher scores do so
for CnnIQA, DBCNN, ManIQA, and HyperIQA. In
seismic data, Dataset
C
shows notably poorer quality
compared to the other two datasets. The presence of
numerous outliers across all datasets highlights sig-
nificant variability in quality, with the worst images
being excluded in subsequent experiments. Similarly,
Figure 3: Distribution of IQA metric values for seismic
(left) and MRI (right).
for MRI datasets, the UPENN dataset displays com-
paratively lower quality with multiple outliers, reflect-
ing similar trends across the distributions.
5.2 IQA Metrics for Seismic Data
Selection
As shown in Table 2, we begin by training our base-
line model using all the data - no data selection -
to serve as a point of comparison against models
trained with images selected using various IQA met-
rics. The baseline model achieves a Precision-Recall
(PR) score of 0.363406 and a Dice score of 0.44737
on Test
A
and PR score of 0.4267 and Dice score of
Integrating Image Quality Assessment Metrics for Enhanced Segmentation Performance in Reconstructed Imaging Datasets
453
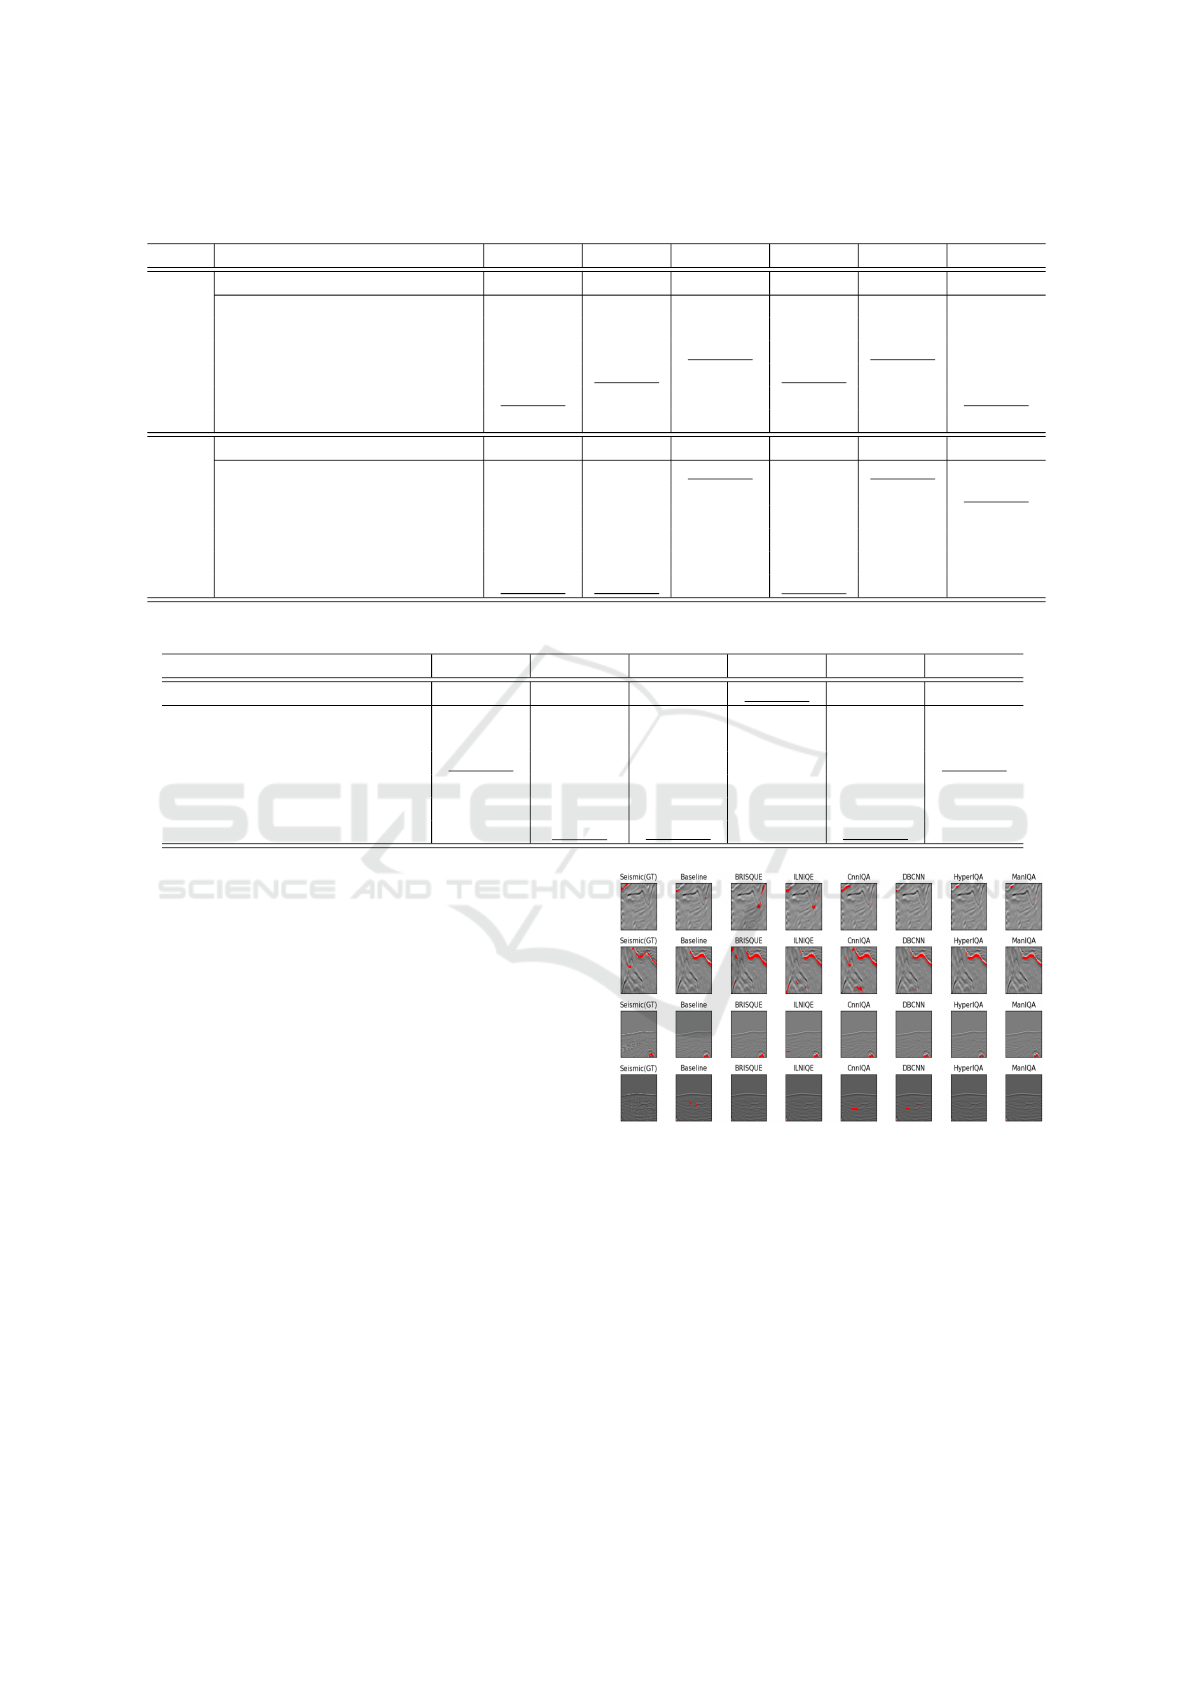
Table 2: Results of applying IQA metrics for Seismic data selection models. Highest scores are indicated in bold, wheres the
second highest scores are underlined.
Data IQA metric PR score Dice TP FP FN TN
Test
A
Baseline 0.363406 0.44737 0.57372 0.63336 0.42627 0.95649
ILNIQE (Zhang et al., 2015) 0.34763 0.37186 0.57828 0.72595 0.42172 0.94724
BRISQUE (Mittal et al., 2011) 0.415008 0.42055 0.64762 0.68862 0.35238 0.94775
CNNIQA (Kang et al., 2014) 0.38221 0.42839 0.60612 0.66874 0.39387 0.951995
DBCNN (Zhang et al., 2018) 0.38384 0.46819 0.554509 0.59487 0.44549 0.95982
HyperIQA (Su et al., 2020) 0.40694 0.48008 0.58905 0.59486 0.41094 0.95837
ManIQA (Yang et al., 2022) 0.36471 0.42172 0.56902 0.66499 0.43097 0.95422
Test
B
Baseline 0.42675 0.58521 0.54984 0.30125 0.45016 0.919095
ILNIQE (Zhang et al., 2015) 0.501209 0.67009 0.76355 0.38537 0.23645 0.897208
BRISQUE (Mittal et al., 2011) 0.59881 0.73482 0.71525 0.19937 0.28474 0.91856
CNNIQA (Kang et al., 2014) 0.53421 0.68026 0.72105 0.31854 0.27895 0.90516
DBCNN (Zhang et al., 2018) 0.44431 0.59291 0.55696 0.29724 0.44303 0.92003
HyperIQA (Su et al., 2020) 0.44552 0.60883 0.57865 0.29377 0.42135 0.91763
ManIQA (Yang et al., 2022) 0.58115 0.72366 0.77565 0.29362 0.22434 0.90329
Table 3: Results of applying IQA metrics for MRI data selection for tumor segmentation models on BraTS.
IQA metric PR score Dice TP FP FN TN
Baseline 0.844617 0.712418 0.706616 0.13392 0.287917 0.950439
ILNIQE (Zhang et al., 2015) 0.84594 0.71908 0.72556 0.13381 0.26897 0.94944
BRISQUE (Mittal et al., 2011) 0.84884 0.73347 0.748278 0.159012 0.246254 0.948946
CNNIQA (Kang et al., 2014) 0.84925 0.72602 0.72355 0.13856 0.27098 0.94996
DBCNN (Zhang et al., 2018) 0.85307 0.72562 0.72338 0.13511 0.27115 0.94995
HyperIQA (Su et al., 2020) 0.84746 0.72346 0.721248 0.140575 0.27328 0.94972
ManIQA (Yang et al., 2022) 0.84486 0.7294 0.73132 0.15404 0.26321 0.94973
0.5852 on Test
B
. In Table 1, we see the number of im-
ages selected from each dataset for the different IQA
metrics. The thresholds shown represent the most op-
timal values obtained from threshold parameter tun-
ing experiments, which are detailed in the next sub-
section.
When we employ IQA metrics for data selection,
we observe significant improvements in performance
metrics on both the tested datasets. For instance,
BRISQUE achieves the highest PR score on Test
A
and
HyperIQA gives the highest Dice score. On Test
B
,
the BRISQUE metric also stands out with the high-
est PR and the highest Dice score. Some visual pre-
dictions can be seen in Figure 4. Overall, the re-
sults indicate that using IQA metrics for data selec-
tion enhances the quality of training data, leading
to improved performance of the segmentation model.
Among the tested IQA metrics, BRISQUE, Hyper-
IQA, and ManIQA demonstrate the most consistent
and superior performance across both test datasets.
BRISQUE is able to effectively capture distortions
and noise levels through its use of mean subtracted
contrast normalized (MSCN) coefficients. HyperIQA
leverages a deep neural network to learn complex rep-
resentations and high-level features, while ManIQA
Figure 4: Qualitative evaluation on seismic datasets. Data
courtesy of TGS.
utilizes a multi-level quality assessment strategy that
combines local and global image features, making
them highly adept at selecting high-quality images
that enhance model training.
5.3 IQA Metrics for MRI Data Selection
As shown in Table 3, we evaluated the effectiveness
of various IQA metrics in selecting high-quality train-
ing data for MRI image segmentation, specifically on
the BraTS dataset. The baseline model, which was
VISAPP 2025 - 20th International Conference on Computer Vision Theory and Applications
454
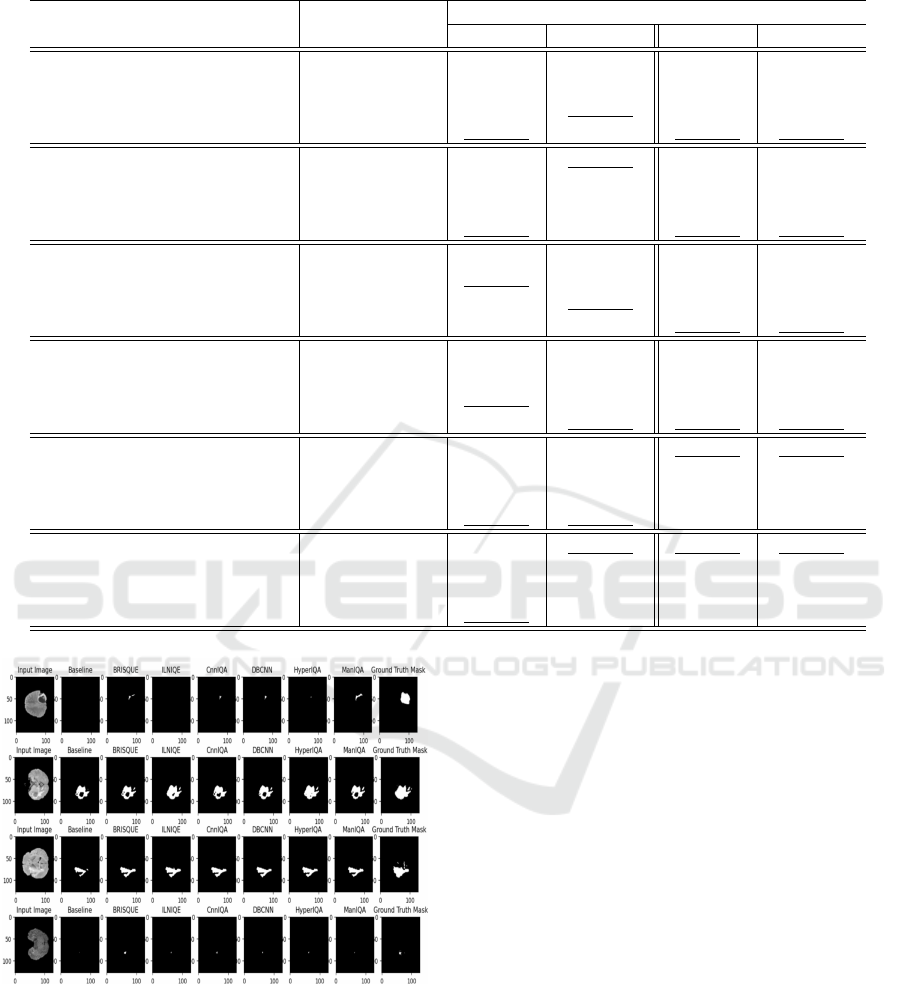
Table 4: Results of using different selection thresholds for each IQA metric on Seismic datasets.
Test
A
Test
B
Metric used Threshold PR score Dice score PR score Dice score
ILNIQE (Zhang et al., 2015)
80 0.34547 0.27942 0.5012 0.67009
100 0.34763 0.37186 0.303404 0.47254
120 0.34513 0.41218 0.40269 0.57362
Lowest quartile 0.34632 0.42453 0.48763 0.62135
BRISQUE (Mittal et al., 2011)
70 0.415008 0.42055 0.59881 0.73482
80 0.35433 0.32554 0.37188 0.53429
90 0.35149 0.35909 0.37968 0.57628
Lowest quartile 0.41932 0.44381 0.58291 0.70004
CnnIQA (Kang et al., 2014)
0.38 0.37466 0.43282 0.489602 0.63985
0.4 0.38221 0.42839 0.53421 0.68026
0.42 0.35143 0.45909 0.47693 0.528543
Lowest quartile 0.40932 0.45935 0.50932 0.66883
DBCNN (Zhang et al., 2018)
0.35 0.38384 0.46819 0.29817 0.45285
0.4 0.345 0.42921 0.44431 0.59291
0.42 0.37946 0.42939 0.38188 0.54247
Lowest quartile 0.36729 0.43633 0.40343 0.55839
HyperIQA (Su et al., 2020)
0.28 0.37466 0.43283 0.44552 0.60883
0.3 0.37538 0.45991 0.38762 0.543522
0.32 0.35654 0.40023 0.39812 0.55911
Lowest quartile 0.37248 0.44494 0.45034 0.64839
ManIQA (Yang et al., 2022)
0.38 0.36471 0.42172 0.58115 0.72366
0.4 0.34151 0.41655 0.26447 0.40738
0.41 0.33915 0.41175 0.25771 0.39731
Lowest quartile 0.35739 0.4395 0.58933 0.73709
Figure 5: Qualitative evaluation on MRI dataset.
trained on the entire dataset without any quality-based
selection, serves as a reference for comparison against
models trained on data selected using different IQA
metrics. Table 4 gives the number of images selected
from each MRI dataset.
We observe that here too, the results clearly
demonstrate that using IQA metrics for data se-
lection enhances the segmentation model’s perfor-
mance. Several metrics, notably BRISQUE, ILNIQE,
and ManIQA, consistently outperform the baseline.
BRISQUE achieved the highest PR indicating its ef-
fective at identifying high-quality images that con-
tribute to improved segmentation accuracy. Hyper-
IQA and ManIQA also performed well, demonstrat-
ing the robustness of deep learning-based IQA meth-
ods which is consistent with the results observed on
seismic. Figure 5 shows visual predictions.
5.4 Further Evaluation
Parameter Tuning for IQA Selection Threshold.
In this section, we evaluate the impact of different
IQA metric thresholds on segmentation model perfor-
mance for seismic and MRI datasets. By varying the
thresholds, we aim to determine the optimal cutoffs
for image selection, enhancing training data quality
and model performance. Results are summarized in
Tables 4 and 5.
For seismic datasets (TestA and TestB), the opti-
mal thresholds varied across metrics. ILNIQE per-
formed best on Test
B
at a threshold of 80, while
BRISQUE consistently achieved high PR and Dice
Integrating Image Quality Assessment Metrics for Enhanced Segmentation Performance in Reconstructed Imaging Datasets
455

Table 5: Results of using different selection thresholds for each IQA metric on MRI datasets.
Metric used Threshold PR score Dice score
ILNIQE (Zhang et al., 2015)
85 0.83248 0.65829
90 0.84594 0.71908
100 0.84057 0.71314
Lowest quartile 0.84209 0.71895
BRISQUE (Mittal et al., 2011)
70 0.83874 0.71748
75 0.84884 0.73347
80 0.84672 0.72537
Lowest quartile 0.84904 0.74112
CnnIQA (Kang et al., 2014)
0.38 0.84321 0.71241
0.4 0.84559 0.72094
0.42 0.84925 0.72602
Lowest quartile 0.84431 0.72293
DBCNN (Zhang et al., 2018)
0.32 0.84772 0.72566
0.35 0.84242 0.67947
0.38 0.85307 0.72662
Lowest quartile 0.84993 0.71029
HyperIQA (Su et al., 2020)
0.28 0.84738 0.72253
0.3 0.84745 0.72346
0.32 0.84447 0.715884
Lowest quartile 0.84545 0.72584
ManIQA (Yang et al., 2022)
0.28 0.8485 0.71242
0.3 0.84486 0.72941
0.32 0.84368 0.71996
Lowest quartile 0.8499 0.73101
scores at a threshold of 70. CNNIQA, DBCNN, Hy-
perIQA, and ManIQA showed their best performance
at thresholds between 0.28 and 0.4, highlighting the
importance of fine-tuning thresholds for each met-
ric. For MRI, ILNIQE and BRISQUE performed op-
timally at thresholds of 90 and 75, respectively, while
CNNIQA, HyperIQA, and ManIQA showed strong
results with thresholds around 0.3–0.42. These results
emphasize that fine-tuning IQA thresholds enhances
data selection and model performance.
An Alternative for Threshold Selection. In addi-
tion to manually tuning IQA thresholds, another ef-
fective method for threshold selection is to analyze
the overall distribution of metric values within the
dataset and remove the lowest-quality images based
on quartiles. For example, by examining the distribu-
tion of BRISQUE scores across the dataset, we can set
a threshold by removing the images that fall into the
worst quartile (i.e., those above the 75th percentile).
This method ensures that the poor quality images, are
systematically excluded from the training set, and the
model performance can be seen in Table 4 for seis-
mic and Table 5 for MRI respectively. The results for
each metric are denoted by ”Lowest quartile”. No-
tably, the ”Lowest quartile” selection shows competi-
tive or even superior performance compared to some
manually tuned thresholds, especially for BRISQUE,
CnnIQA, and ManIQA metrics, where it consistently
improves both PR and Dice scores.
6 CONCLUSION
The shift towards data-centric AI represents a signif-
icant advancement, particularly in domains reliant on
reconstructed imaging datasets like seismic and med-
ical imaging. By integrating Image Quality Assess-
ment (IQA) metrics into the data selection process,
we ensure the selection of only high-quality data for
the model to learn from, thus enhancing the perfor-
mance, accuracy, and reliability of these models.
ACKNOWLEDGEMENTS
We thank Shell Information Technology International
Inc. for funding this work. We also thank TGS for the
data in Figures 1 and 4.
VISAPP 2025 - 20th International Conference on Computer Vision Theory and Applications
456

REFERENCES
Adeoye, J., Hui, L., and Su, Y.-X. (2023). Data-centric ar-
tificial intelligence in oncology: a systematic review
assessing data quality in machine learning models for
head and neck cancer. Journal of Big Data.
Alkan, E., Cai, Y., Devarakota, P., Gala, A., et al. (2022).
Saltcrawler: Ai solution for accelerating velocity
model building. In IMAGE.
Bakas, S., Akbari, H., Sotiras, A., Bilello, M., Rozycki,
M., et al. (2017). Advancing the cancer genome at-
las glioma mri collections with expert segmentation
labels and radiomic features. Scientific data.
Bakas, S., Reyes, M., Jakab, A., Bauer, S., et al. (2018).
Identifying the best machine learning algorithms for
brain tumor segmentation, progression assessment,
and overall survival prediction in the brats challenge.
arXiv.
Bakas, S., Sako, C., Akbari, H., Bilello, M., et al. (2022).
The university of pennsylvania glioblastoma (upenn-
gbm) cohort: Advanced mri, clinical, genomics, & ra-
diomics. Scientific data.
Buda, M., Saha, A., and Mazurowski, M. A. (2019). Asso-
ciation of genomic subtypes of lower-grade gliomas
with shape features automatically extracted by a
deep learning algorithm. Computers in biology and
medicine.
Calabrese, E., Villanueva-Meyer, J. E., Rudie, J. D., et al.
(2022). The university of california san francisco pre-
operative diffuse glioma mri dataset. Radiology: Arti-
ficial Intelligence.
Devarakota, P., Gala, A., Li, Z., and Alkan, E. a. (2022).
Deep learning in salt interpretation from r&d to de-
ployment: Challenges and lessons learned. In IMAGE.
Dutta, A., Veldhuis, R., and Spreeuwers, L. (2015). Predict-
ing face recognition performance using image quality.
arXiv.
Galbally, J., Marcel, S., and Fierrez, J. (2013). Image qual-
ity assessment for fake biometric detection: Applica-
tion to iris, fingerprint, and face recognition. IEEE
Trans. image processing.
Hamid, O. H. (2022). From model-centric to data-centric
ai: A paradigm shift or rather a complementary ap-
proach? In ITT.
Jones, I. F. and Davison, I. (2014). Seismic imaging in and
around salt bodies. SEG Interpretation.
Kang, L., Ye, P., Li, Y., and Doermann, D. (2014). Convolu-
tional neural networks for no-reference image quality
assessment. In CVPR.
Kingma, D. P. and Ba, J. (2014). Adam: A method for
stochastic optimization. arXiv.
Krizhevsky, A., Sutskever, I., and Hinton, G. E. (2017). Im-
agenet classification with deep convolutional neural
networks. Communications of the ACM.
Mazurowski, M. A., Clark, K., Czarnek, N. M., Shamses-
fandabadi, P., et al. (2017). Radiogenomics of lower-
grade glioma: algorithmically-assessed tumor shape
is associated with tumor genomic subtypes and patient
outcomes in a multi-institutional study with the cancer
genome atlas data. Journal of neuro-oncology.
Menze, B. H., Jakab, A., Bauer, S., Kalpathy-Cramer, J.,
et al. (2014). The multimodal brain tumor image seg-
mentation benchmark (brats). IEEE Trans. medical
imaging.
Minaee, S., Boykov, Y., Porikli, F., Plaza, A., et al. (2021).
Image segmentation using deep learning: A survey.
IEEE transactions on pattern analysis and machine
intelligence.
Mirza, S., Nguyen, V. D., Mantini, P., and Shah, S. K.
(2024). Data quality aware approaches for address-
ing model drift of semantic segmentation models. In
VISIGRAPP.
Mittal, A., Moorthy, A. K., and Bovik, A. C. (2011).
Blind/referenceless image spatial quality evaluator. In
ASILOMAR.
Motamedi, M., Sakharnykh, N., and Kaldewey, T. (2021).
A data-centric approach for training deep neural net-
works with less data. arXiv.
Ng, A., Laird, D., and He, L. (2021). Data-centric ai com-
petition.
Nisa, A., Fajri, R., Nashrullah, E., Harahap, F., et al. (2022).
Performance face image quality assessment under the
difference of illumination directions in face recogni-
tion system using faceqnet, sdd-fiqa, and ser-fiq. In
IC3INA.
Ronneberger, O., Fischer, P., and Brox, T. (2015). U-net:
Convolutional networks for biomedical image seg-
mentation. In MICCAI.
Saeed, S. U., Fu, Y., Baum, Z. M., Yang, Q., et al. (2021).
Learning image quality assessment by reinforcing task
amenable data selection. In International Conference
on Information Processing in Medical Imaging.
Singh, P. (2023). Systematic review of data-centric ap-
proaches in artificial intelligence and machine learn-
ing. Data Science and Management.
Su, S., Yan, Q., Zhu, Y., Zhang, C., et al. (2020). Blindly
assess image quality in the wild guided by a self-
adaptive hyper network. In CVPR.
Wang, Z. and Bovik, A. C. (2006). Modern image quality
assessment. PhD thesis.
Yang, S., Wu, T., Shi, S., Lao, S., et al. (2022). Maniqa:
Multi-dimension attention network for no-reference
image quality assessment. In CVPR.
Yilmaz,
¨
O. (2001). Seismic data analysis, volume 1. SEG.
Zha, D., Bhat, Z. P., Lai, K.-H., Yang, F., et al. (2023). Data-
centric artificial intelligence: A survey. arXiv.
Zhai, G. and Min, X. (2020). Perceptual image quality as-
sessment: a survey. Science China Information Sci-
ences.
Zhang, L., Zhang, L., and Bovik, A. C. (2015). A feature-
enriched completely blind image quality evaluator.
IEEE Trans. Image Processing.
Zhang, W., Ma, K., Yan, J., Deng, D., and Wang, Z. (2018).
Blind image quality assessment using a deep bilinear
convolutional neural network. IEEE Trans. Circuits
and Systems for Video Technology.
Zhuang, N., Zhang, Q., Pan, C., Ni, B., et al. (2019). Recog-
nition oriented facial image quality assessment via
deep convolutional neural network. Neurocomputing.
Integrating Image Quality Assessment Metrics for Enhanced Segmentation Performance in Reconstructed Imaging Datasets
457
