
Independent Real and Imaginary Spectral Analysis for Improving the
Brillouin Frequency Shift Resolution in the Differential
Cross-Spectrum BOTDR (DCS-BOTDR) Fiber Sensor
Ain Nabihah Mohammad Rihan
1a
, Mohd Saiful Dzulkefly Zan
1b
, Yosuke Tanaka
2c
,
Mohd Hadri Hafiz Mokhtar
1d
, Norhana Arsad
1e
and Ahmad Ashrif A Bakar
1f
1
Department of Electrical, Electronic & Systems Engineering, Faculty of Engineering & Built Environment,
Universiti Kebangsaan Malaysia, 43600 UKM Bangi, Selangor Darul Ehsan, Malaysia
2
Department of Electrical and Electronic Engineering, Graduate School of Engineering,
Tokyo University of Agriculture and Technology, Koganei, Tokyo 184-8588, Japan
Keywords: Distributed Fiber Sensor, Strain and Temperature Sensor, Brillouin Optical Time Domain Reflectometry,
Spectral Analysis, Fast Fourier Transform.
Abstract: We propose a technique to improve Brillouin gain spectrum (BGS) acquisition in a Brillouin optical time
domain reflectometry (BOTDR) fiber sensor by independently analyzing the real and imaginary components
of the Brillouin backscattered signal through fast Fourier transform (FFT) analysis. This technique aims to
enhance Brillouin frequency shift (BFS) resolution in our previously proposed differential cross-spectrum
BOTDR (DCS-BOTDR) method. Using an intensity modulation scheme to generate a probe pulse pair, we
conducted temperature sensing experiment by heating an 8 m section at the far end of a 1.2 km fiber at 70°C.
The experimental results showed a significant reduction of BGS width from 128 MHz to around 53 MHz with
the real spectrum component. Consequently, this has resulted in the enhancement of the BFS resolution to
1.49 MHz using the real spectrum and 1.51 MHz with the imaginary spectrum. We have also achieved 40 cm
spatial resolution measurement and reduced the processing time from 7.21 s to 7.08 s, demonstrating an
improved efficiency and accuracy for distributed temperature measurement in BOTDR sensor.
1 INTRODUCTION
In recent years, many studies on Brillouin optical time
domain reflectometry (BOTDR) have multiplied due
to its potential applications such as structural health
monitoring of large infrastructures, pipeline
monitoring, and power cable monitoring. The
growing interest was influenced by the ability of
BOTDR systems to detect local variations in
Brillouin frequency shift that are sensitive to
temperature and strain, which allows for distributed
sensing. As a result of the linear dependence of
temperature and strain on the Brillouin frequency
shift (BFS), the Brillouin gain spectrum mapping was
used for distributed temperature and strain sensing in
the BOTDR system (Bao et al., 2021). The BOTDR
system utilized spontaneous Brillouin scattering
(SpBS) to measure the strain distribution. However,
signal-to-noise (SNR) is weak due to the low
amplitude of the SpBS. The SNR can be improved
by increasing the pulse width, but the spatial
resolution will be compromised.
a
https://orcid.org/0009-0004-8101-1197
b
https://orcid.org/0000-0002-1440-5434
c
https://orcid.org/0000-0002-6539-5977
d
https://orcid.org/0000-0001-5307-073X
e
https://orcid.org/0000-0003-4543-8383
f
https://orcid.org/0000-0002-9060-0346
Rihan, A. N. M., Zan, M. S. D., Tanaka, Y., Mokhtar, M. H. H., Arsad, N. and Bakar, A. A. A.
Independent Real and Imaginary Spectral Analysis for Improving the Brillouin Frequency Shift Resolution in the Differential Cross-Spectrum BOTDR (DCS-BOTDR) Fiber Sensor.
DOI: 10.5220/0013167300003902
In Proceedings of the 13th International Conference on Photonics, Optics and Laser Technology (PHOTOPTICS 2025), pages 35-40
ISBN: 978-989-758-736-8; ISSN: 2184-4364
Copyright © 2025 by Paper published under CC license (CC BY-NC-ND 4.0)
35

Figure 1: Time domain Brillouin backscattered (BS) analysis scheme using differential cross spectrum technique.
Due to the trade-off between these parameters,
various studies have been conducted on enhancing
spatial resolution without compromising the SNR
(Almoosa et al., 2022; Horiguchi et al., 2019; Zan et
al., 2018). Almoosa et. al proposed a method to
improve the BFS resolution of the BOTDR system by
using an artificial neural network (ANN) (Almoosa et
al., 2022). This technique demonstrated the
improvement of BFS resolution from 21.13 MHz to
2.88 MHz. Horiguchi et. al reported phase shift pulse
BOTDR (PSP-BOTDR) where a probe pulse pair
modulated by the phase shift keying method and has
obtained 20 cm spatial resolution with this method
(Horiguchi et al., 2019). Differential cross-spectrum
BOTDR (DCS-BOTDR) which has a similar
approach to the PSP-BOTDR was proposed by Zan et
al. (2018), whereby an intensity modulation scheme
is used to generate a long-short probe pulse pair. This
technique has demonstrated 0.2 m spatial resolution
for a 350 m sensing range. Even though all of these
techniques have further improved the spatial
resolution of the BOTDR system, the measurement
time took quite a long period due to high averaging.
In this paper, we introduce a method to acquire the
BGS by independently analysing real and imaginary
parts of the fast Fourier transform (FFT). In the DCS-
BOTDR, the BGS was acquired by analysing power
spectral density (PSD), which is the magnitude of real
and imaginary components. The proposed method
will use a similar intensity modulation scheme of the
DCS-BOTDR to modulate the long-short probe pulse
pair, but use a different approach to extract the BGS.
This experiment will focus on independent analysis to
effectively improve the BFS resolution while also
successfully reducing the measurement time.
2 PRINCIPLES
2.1 Real and Imaginary Spectrum of
DCS-BOTDR
In a conventional BOTDR system, the Brillouin
spectrum was extracted from the backscattered signal
in the frequency domain by applying the FFT.
Fundamentally, the FFT is an algorithm that
calculates fast discrete Fourier transform (DFT)
(Smith, 1997). The DFT converts the time domain
signal into a frequency domain that yields two
components; real and imaginary. Hence, the DCS-
BOTDR method introduces a cross-correlation
method by calculating the complex conjugate of both
components of the FFT to acquire the PSD.
Considering that both real and imaginary parts of the
FFT can work independently, the spectrum analysis
to compare three different spectra; conventional, real,
and imaginary was conducted based on the DCS-
BOTDR method.
Figure 1 provides an overview of the key steps
involved in this method, starting from the generation
of probe pulses to the computation of the differential
Brillouin spectrum. As illustrated, two probe pulses
are utilized which both probes have a long pulse
duration (𝑇
), but only Probe 1 includes a short pulse
duration (𝑇
), separated by an interval duration (𝑇
)
between and Probe 2 serves as a reference. Initially,
the backscattered signal in the time domain can be
expressed as 𝑏
𝑡
,𝑧
, where 𝑧 is the position in the
optical fiber and 𝑡
refers to the reference time. After
converting to the frequency domain by performing
the FFT, the backscattered signal will yield both real
and imaginary components, expressed as:
PHOTOPTICS 2025 - 13th International Conference on Photonics, Optics and Laser Technology
36
𝐵
𝑓
,𝑧
𝑅𝑒
𝐵
𝑓
,𝑧
𝐼𝑚
𝐵
𝑓
,𝑧
(1)
where 𝐵
𝑓,𝑧
represents the backscattered signal in
the frequency domain at the position 𝑧, 𝑅𝑒 refers to
the real part that corresponds to cosine components,
while 𝐼𝑚 refers to the imaginary part that
corresponds to the sine components. Then, cross-
correlation as depicted in Figure 1 involves
calculating the interaction between the backscattered
signals between Probe 1 ( 𝑏
𝑡
,𝑧
) and Probe 2
𝑏
𝑡
,𝑧
) in the frequency domain. This is computed
and described as follows:
(2)
(3)
Equation 2 and 3 represent the correlation
between real and imaginary components of the
backscattered signals from both probes. They also
signify the interaction of the two signals in the
frequency domain. These equations also yield the real
and imaginary part of the Brillouin spectrum.
“Subtraction” and “Differential Brillouin Spectrum”
columns in Figure 1 depict the subsequent step
computes the magnitude of the cross-spectrum to
determine the PSD of the cross-correlated signal in
the frequency domain. The magnitude of cross-
spectrum is also defined as the conventional spectrum
deployed in the DCS-BOTDR technique and it can be
calculated as:
𝐶
𝜏,𝑡
,𝑧
𝑅𝑒𝐶
𝜏,𝑡
,𝑧
𝐼𝑚𝐶
𝜏,𝑡
,𝑧
(4)
This magnitude combines both real and imaginary
parts and gives the measure of the PSD in the
frequency domain. The steps outlined in Figure 1
ensure that both components are utilized effectively,
leading to an improved understanding and accuracy
of the Brillouin spectrum.
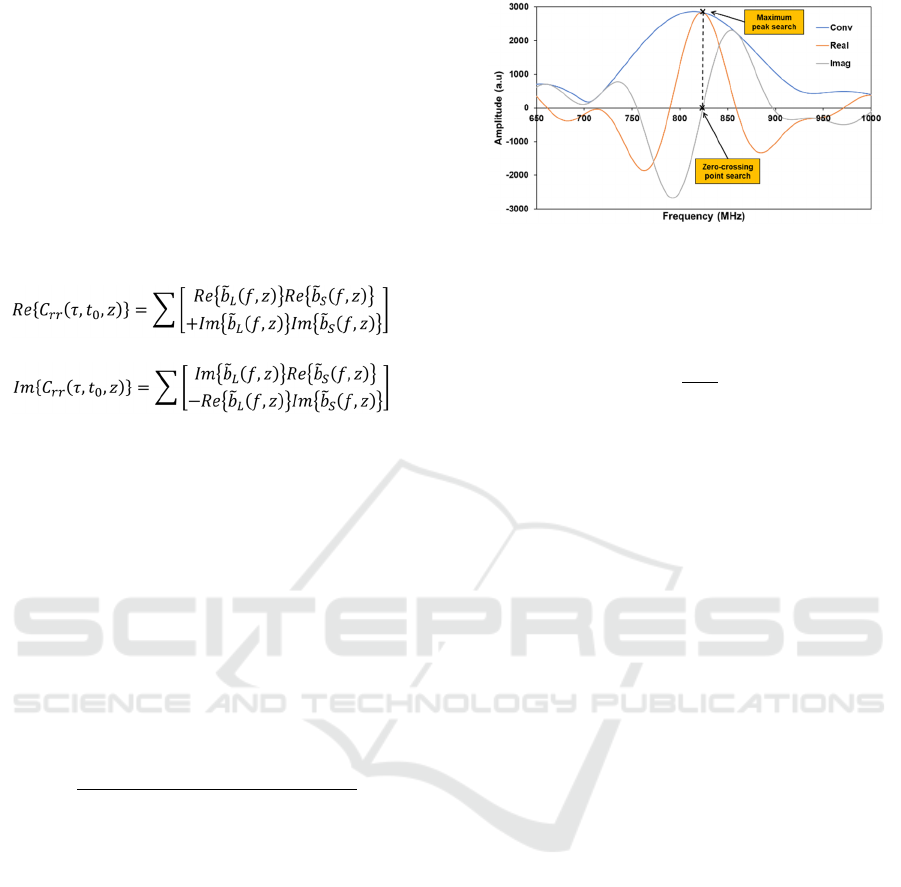
2.2 Zero-Crossing Point Search
To find the BFS for the imaginary spectrum, a zero-
crossing point search (ZCPS) is applied instead of a
maximum peak search. This is because the frequency
of the zero-crossing point for the imaginary spectrum
is equivalent to the frequency for the real and
conventional spectra (see Figure 2). The ZCPS is
adapted from Nonogaki et al. (2024) which
has proposed this method for a Brillouin optical time
Figure 2: BGS of real, imaginary, and conventional
spectrum.
domain analyzer (BOTDA) system. The BGS of the
imaginary part can be explained as:
𝑓
𝑏
𝑎
(5)
where
𝑎
refers to the slope of the linear regression
between the maximum and minimum values of the
BGS, and
𝑏
is the intercept of the linear
regression. The slope of the linear regression which
can be denoted as a gradient 𝑚 can also determine the
linearity between the BGS of heated and unheated
BGS which will be discussed in the next section.
3 EXPERIMENTAL ANALYSIS
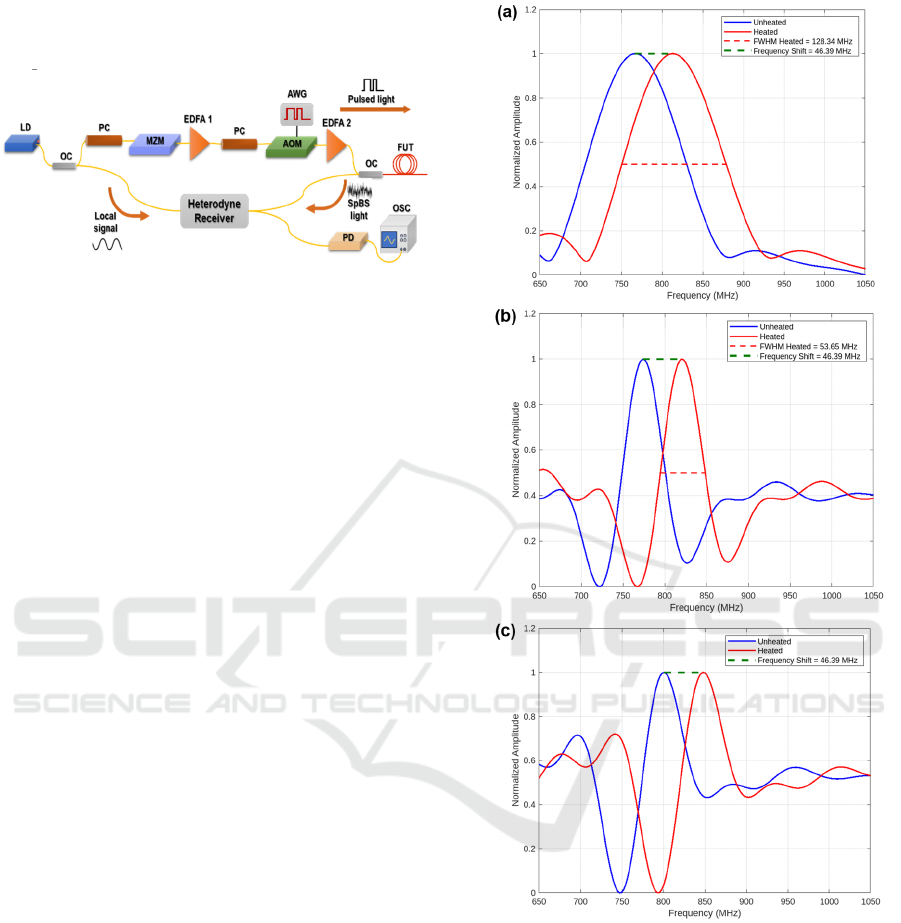
3.1 Experimental Setup
The configuration of the experimental setup is
depicted in Figure 3. Continuous light of 1550 nm
wavelength with 12 dBm input power was upshifted
and downshifted by frequency modulation scheme. A
synthesized signal generator (SSG) supplied a 10
GHz sinusoidal wave to a Mach-Zehnder modulator
(MZM) for frequency shift keying. Arbitrary
waveform generator (AWG) modulates the incoming
optical signal to generate the optical pulses as shown
in Figure 1. By using acousto-optic modulation
(AOM), optical pulses were generated via ON-OFF
keying modulation. Then, the AWG was set to
produce the desired electric pulses such that 𝑇
= 10
ns, 𝑇
= 4 ns, and 𝑇
= 2 ns. Two optical amplifiers
(EDFA 1 and EDFA 2) were incorporated into the
setup to compensate insertion loss, with input
currents of 180 mA and 80 mA respectively. The
overall output power detected by oscilloscope (OSC)
was measured to be 600 mW. The experiment was
carried out using a total fiber length of 1.2 km, with a
heated section placed inside a water bath
approximately 8 meters near the far end of the fiber,
at a fixed temperature of 70°C. The SpBS that
Independent Real and Imaginary Spectral Analysis for Improving the Brillouin Frequency Shift Resolution in the Differential
Cross-Spectrum BOTDR (DCS-BOTDR) Fiber Sensor
37
consists of both Brillouin gain and loss spectra in the
optical fiber were generated by the optical pulses for
temperature measurement.
Figure 3: Schematic experimental setup of DCS-BOTDR.
LD: laser diode, OC: optical coupler, PC; polarization
controller, MZM: Mach-Zehnder modulator, EDFA:
erbium-doped fiber amplifier, AOM: acousto-optic
modulator, AWG: arbitrary waveform generator, PD:
photodetector, OSC: oscillope, FUT: fiber-under-test,
SpBS: spontaneous Brillouin scattering.
3.2 Results and Analysis
Figure 4 shows three different Brillouin spectra; real,
imaginary, and conventional, acquired using the
proposed technique. The measurement was
monitored at 𝑧 = 1.2 km for both heated and unheated
fiber sections along the FUT. All Brillouin spectra
recorded the same frequency shift at around 46 MHz.
In comparison with the frequency shift, the spectral
bandwidth of the BGS calculated at full-width-half-
maximum (FWHM) shows an improvement
compared to the conventional one. As can be seen in
Figure 4 (a), the conventional spectrum of the heated
section has a broad spectrum width of 128 MHz. In
contrast, a narrower bandwidth of 53 MHz as
depicted in Figure 4 (b), was achieved when only the
real part of the FFT analysis was considered during
the spectral analysis of the time domain signal.
In most cases, the Brillouin spectrum typically
exhibits a Lorentzian line shape with a symmetrical
peak due to lifetime broadening, which makes it
possible to measure the FWHM (Antonacci et al.,
2013). Meanwhile, the imaginary spectrum usually
does not conform to a Lorentzian shape as evident in
Figure 4 (c) because it may exhibit multiple peaks,
unlike the real and conventional spectra.
Consequently, relying on the FWHM analysis for the
imaginary spectrum may increase inaccuracies in the
calculation that potentially affect the reliability of the
result. Another method to evaluate the imaginary
spectrum involves comparing the linearity of
Brillouin spectrum slopes between the heated and
unheated spectra.
Figure 4: Brillouin spectrum at the heated and unheated
section of 1 km for (a) conventional, (b) real, and (c)
imaginary spectrum.
Previously, Peng et al. (2022) conducted a
similar method known as double-slope assisted
BOTDR (DSA-BOTDR) to study the linear
dependence of the Brillouin spectrum on
temperature and evaluate the sensitivity of the
BOTDR system to temperature variations. Based on
Figure 4 (c), the unheated and heated spectra have
small differences in slopes, with values of 0.008 and
0.009 respectively. This difference suggests an
increased sensitivity to temperature changes and the
PHOTOPTICS 2025 - 13th International Conference on Photonics, Optics and Laser Technology
38
Brillouin spectrum shifted more rapidly under
heated conditions. The small difference in slopes
suggests that the system maintains stability and
consistency across different thermal conditions.
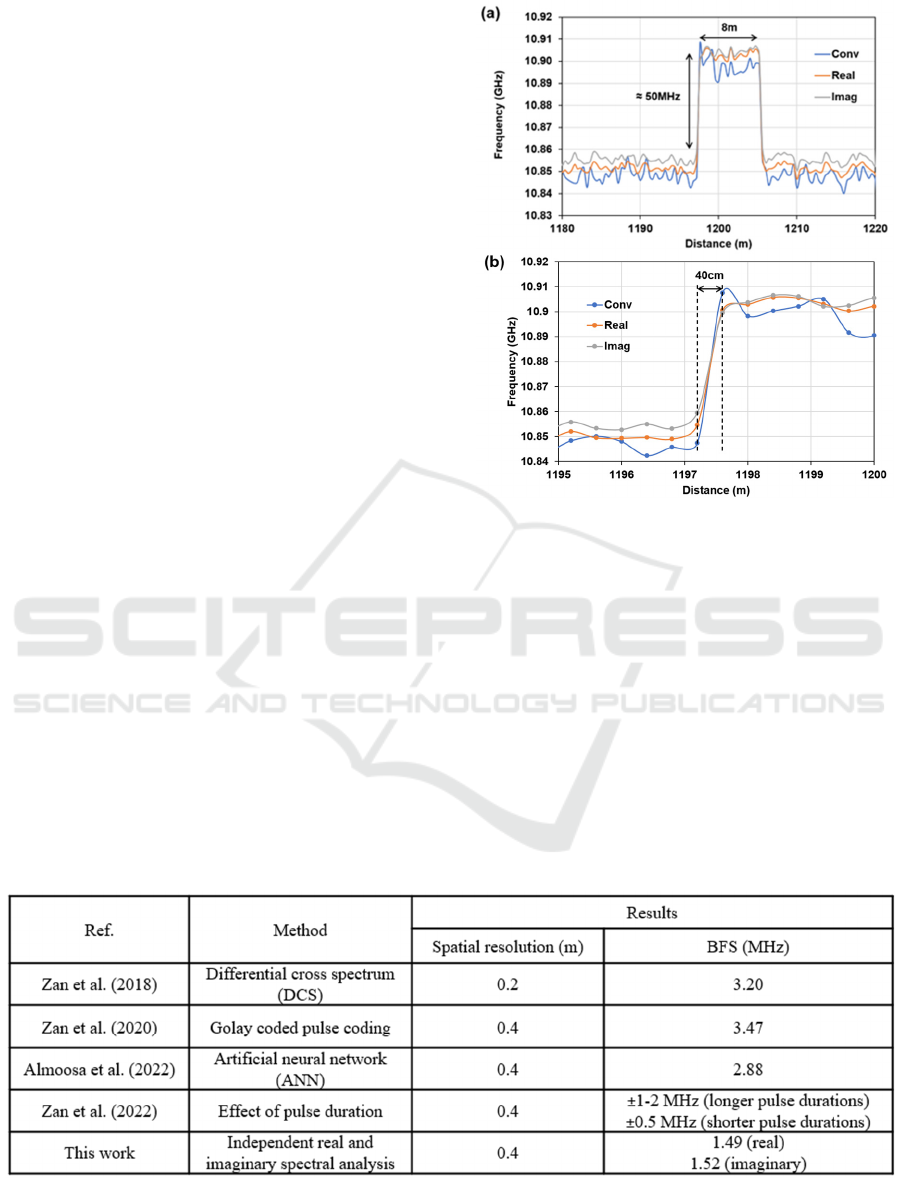
Figures 5 (a) and (b) show the BFS distribution
monitored at the 70°C heated section of the FUT.
From Figure 5 (a), it was found that the spatial
resolution analyzed at the 8 m fiber section was 40
cm and the BFS was approximately 50 MHz. By
calculating the standard deviation, the BFS
resolution can be determined more accurately,
thanks to the narrowed Brillouin spectrum of the real
components and the linear slope from the imaginary
component. The measured BFS resolutions for real,
imaginary, and conventional spectra were 1.49
MHz, 1.51 MHz, and 3.24 MHz, respectively. This
confirms that the BFS resolution can be improved
by employing independent real or imaginary
components for FFT analysis to extract the Brillouin
spectrum. Finally, the time taken to extract the
Brillouin spectrum from the backscattered signal
through FFT analysis was analyzed.
In our experiment, we averaged the data 20,000
times and conducted FFT analysis on a total of 576
BGS spectra, monitored from 1 km to the fiber end
for each type of spectrum (real, imaginary, and
conventional). The processing time required to
compute one BGS for the real, imaginary, and
conventional categories are 7.09s, 7.08s, and 7.21s,
respectively. Concentrating on the independent
computation of either the real or imaginary
components of the BGS for FFT analysis can
significantly reduce processing time. In comparison
with previous works, Table 1 shows the improvement
of the experimental results based on the spatial
resolution and BFS resolution.
Figure 5: BFS distribution comparison of real, imaginary,
and conventional spectrum. (a) Temperature distribution at
8 m heated section. (b) Spatial resolution of the BFS
distribution.
4 CONCLUSIONS
In this paper, we propose a technique to acquire the
Brillouin gain spectrum (BGS) by independently
analyzing the real and imaginary components of the
Brillouin backscattered signal. The experiment was
conducted using DCS-BOTDR intensity modulation
scheme to generate a probe pulse pair. The
Table 1: Performance specifications of different DCS-BOTDR schemes.
Independent Real and Imaginary Spectral Analysis for Improving the Brillouin Frequency Shift Resolution in the Differential
Cross-Spectrum BOTDR (DCS-BOTDR) Fiber Sensor
39

experiment results show that separating these
components enhanced the Brillouin frequency shift
(BFS) resolution, with the conventional spectrum
width improved from 128 MHz to 53 MHz using the
real spectrum. Additionally, temperature sensitivity
was demonstrated by comparing heated and unheated
imaginary spectra. A 50 MHz BFS shift, 40 cm spatial
resolution, and reduced processing time from 7.21s to
7.08s were achieved.
ACKNOWLEDGEMENTS
This research was supported by the Fundamental
Research Grant Scheme (FRGS) from the Ministry of
Higher Education of Malaysia (MOHE): Grant No.
FRGS/1/2023/TK07/UKM/02/2.
REFERENCES
Almoosa, A. S. K., Hamzah, A. E., Zan, M. S. D., Ibrahim,
M. F., Arsad, N., & Elgaud, M. M. (2022). Improving
the Brillouin frequency shift measurement resolution in
the Brillouin optical time domain reflectometry
(BOTDR) fiber sensor by artificial neural network
(ANN). Optical Fiber Technology, 70, 102860.
Antonacci, G., Foreman, M. R., Paterson, C., & Török, P.
(2013). Spectral broadening in Brillouin imaging.
Applied Physics Letters, 103(22).
Bao, X., Zhou, Z., & Wang, Y. (2021). Review: distributed
time-domain sensors based on Brillouin scattering and
FWM enhanced SBS for temperature, strain and
acoustic wave detection. PhotoniX, 2(1).
Horiguchi, T., Masui, Y., & Zan, M. S. D. (2019). Analysis
of Phase-Shift Pulse brillouin Optical Time-Domain
reflectometry. Sensors, 19(7), 1497.
Nonogaki, H., Sei, D., Zan, M. S. D., & Tanaka, Y. (2024).
Brillouin frequency shift measurement by zero-crossing
point search in virtually synthesized spectra of Brillouin
gain and loss. Applied Physics Express.
Peng, J., Lu, Y., Zhang, Y., Wu, Z., & Zhang, Z. (2022).
Double-Slope assisted brillouin optical time domain
reflectometry with linear regions merging. IEEE
Photonics Technology Letters, 34(15), 819–822.
Smith, S. W. (1997). The scientist and engineer’s guide to
digital signal processing. California Technical Pub.
Zan, M. S. D., Almoosa, A. S. K., Ibrahim, M. F., Elgaud,
M. M., Hamzah, A. E., Arsad, N., Mokhtar, M. H. H.,
& Bakar, A. a. A. (2022). The effect of pulse duration
on the Brillouin frequency shift accuracy in the
differential cross-spectrum BOTDR (DCS-BOTDR)
fiber sensor. Optical Fiber Technology, 72, 102977.
Zan, M. S. D., Masui, Y., & Horiguchi, T. (2018).
Differential Cross Spectrum Technique for Improving
the Spatial Resolution of BOTDR Sensor. In 2018 IEEE
7th International Conference on Photonics (ICP).
Zan, M. S. D., Mokhtar, M. H. H., Elgaud, M. M., Bakar,
A. a. A., Arsad, N., & Mahdi, M. A. (2020). Pulse
Coding Technique in Differential Cross-Spectrum
BOTDR for Improving the Brillouin Frequency
Accuracy and Spatial Resolution (pp. 11–12).
PHOTOPTICS 2025 - 13th International Conference on Photonics, Optics and Laser Technology
40
