
DNN Layers Features Reduction for Out-of-Distribution Detection
Mikha
¨
el Presley Kibinda-Moukengue
a
, Alexandre Baussard
b
and Pierre Beauseroy
c
Computer Science and Digital Society Laboratory (LIST3N), Universit
´
e de Technologie de Troyes, Troyes, France
Keywords:
Deep Neural Networks, Out-of-Distribution, Detection, Statistical Hypothesis Tests.
Abstract:
Decision-making in a number of industries, including environmental management, transportation, and public
health, is greatly aided by artificial intelligence systems. Nonetheless, to perform well, these systems requires
to follow some usage conditions. For instance, the data fed into a classification neural network must come
from the same distribution as the training data to maintain the performance measured during test. In practice,
however, this condition is not always met and not so easy to guarantee. In particular, for image recognition,
it’s possible to submit images that do not contain any learned classes and still receive a firm response from the
network. This paper presents an approach to out-of-distribution observation detection applied to deep neural
networks (DNNs) for image classification, called DNN Layers Features Reduction for Out-Of-Distribution
Detection (DROOD). The principle of DROOD is to construct a decision statistic by successively synthesizing
information from the features of all the intermediate layers of the classification network. The method is
adaptable to any DNN architecture and experiments show results that outperform reference methods.
1 INTRODUCTION
From data collection to results deployment, machine
learning models, particularly deep neural networks
(DNN), are increasingly used in image classification
tasks with remarkable performance. The traditional
use of these models requires the training and test sam-
ples to be drawn independently and identically dis-
tributed. In real-life applications, this condition is not
always satisfied. Thus, during inference, testing an
observation whose distribution is singular from the
distribution of the training data, also known as in-
distribution (ID), will produce random, erroneous, or
even overconfident predictions. Such observation is
called out-of-distribution (OOD). In recent years, sev-
eral approaches have been proposed to deal with this
problem. Many of them focus on OOD detection for
deep learning models (Lee et al., ), (Sastry and Oore,
), (Kaur et al., ). Two groups of OOD detection ap-
proaches can be defined: (i) integrated approaches
which directly integrate the detector when training
the model by modifying the network architecture or
by modifying the loss function (Malinin and Gales,
), (Winkens et al., ), (Zhang et al., ); (ii) post-hoc
approaches which integrate the detector during infer-
a
https://orcid.org/0009-0007-1455-6754
b
https://orcid.org/0000-0002-6693-4282
c
https://orcid.org/0000-0002-2883-1303
ence without modifying the weights of the trained net-
work (Lee et al., ), (Zisselman and Tamar, ), (Raghu-
ram et al., ). The integrated approach is inherently
computationally intensive, as it requires both calibrat-
ing the network weights and performing OOD detec-
tion simultaneously during training. The post-hoc ap-
proach can provide a significant advantage since it
doesn’t require retraining the network for detection.
This allows detection to be implemented and adjusted
without affecting the classifier’s performance. Several
works have applied OOD detection using information
from the last layer of the neural network (Hendrycks
and Gimpel, ), (Liu et al., ), (Sun and Li, ). This last
layer is very important in image classification tasks
because it is used to make the decision. It assigns a
class to the image based on the output probabilities for
a given input sample. These approaches have shown
that applying OOD detection on the last layer of the
neural network enables a good separation between in-
distribution and out-of-distribution ata. Other OOD
detection approaches take advantage of each layer of
the neural network (Dziedzic et al., ), (Li et al., ).
In DNN, each layer plays a distinct role in process-
ing data, and the extent of their contribution can vary
from one layer to another. Applying detection to the
outputs of each layer allows all the sensitivities and
crucial information of the data to be taken into ac-
count for robust decision-making.
70
Kibinda-Moukengue, M. P., Baussard, A. and Beauseroy, P.
DNN Layers Features Reduction for Out-of-Distribution Detection.
DOI: 10.5220/0013167400003905
In Proceedings of the 14th International Conference on Pattern Recognition Applications and Methods (ICPRAM 2025), pages 70-78
ISBN: 978-989-758-730-6; ISSN: 2184-4313
Copyright © 2025 by Paper published under CC license (CC BY-NC-ND 4.0)
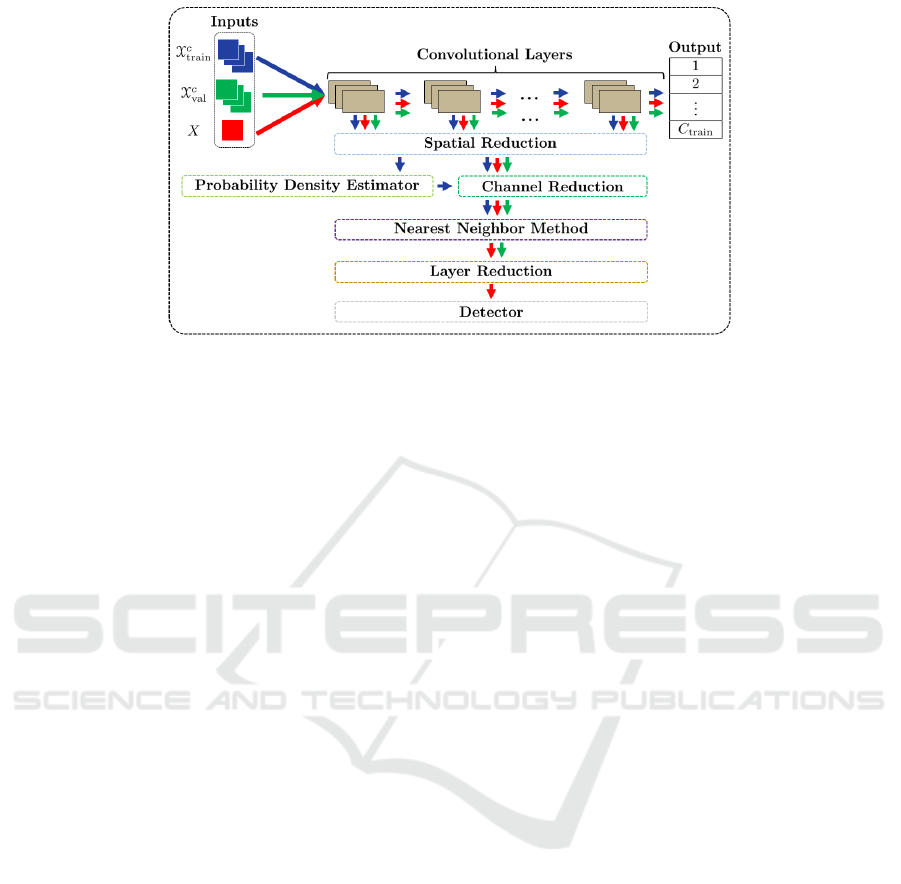
Figure 1: Overview of the DROOD approach for OOD detection in CNN classifiers. The blue arrows model the flow of the
training data, the green arrows the flow of the validation data and the red arrows the flow on any data to be tested. The main
steps of the DROOD approach are framed by dotted lines of different colors, also used in Figure 2, which details the DROOD
flow using the equations.
The literature shows a growing trend in OOD
detection methods that leverage decision statistics,
achieving notable performance improvements, as
seen with the MaSF (Max-Simes-Fisher) method
(Haroush et al., ). The proposed DNN Layers Fea-
tures Reduction for Out-Of-Distribution Detection
(DROOD) method is part of the post-hoc approach to
OOD detection. It can be applied to any pre-trained
neural network, as it requires only the extraction of
the features from all layers of the DNN to detect
OOD data. Similar to MaSF, DROOD conducts OOD
detection by applying decision statistics across each
layer of the DNN. DROOD uses these statistics to de-
termine the distance between elements within a space
that represents the class-conditional log-densities. In
Figure 1, the main steps of the DROOD approach
are depicted, using a convolutional neural network
(CNN) architecture (an equivalent diagram can be
drawn up for transformers).
Overall, the contributions in this paper can be
summarised as follows:
• We propose, for CNN classification models, to re-
duce each channel of each layer by estimating the
probability density of the pattern of the channel
input that fits best the trained convolutional fil-
ter. Equivalently, for vision transformer models,
we propose to reduce the image tokens of each
layer (or encoding block) by estimating the prob-
ability density of the image token pattern with the
strongest response. To reduce channels, assuming
their independence, we estimate their joint log-
distribution per layer.
• To characterize an image, we evaluate its class-
conditional log-probability density at each layer
of the network. The detection statistic is deduced,
in the obtained representation space, from the av-
erage nearest neighbors’ distances between the
test image and the training ones.
• Overall, the DROOD approach demonstrates
promising performance on out-of-distribution
datasets, both close to and far from the training
data distribution, outperforming the methods used
for comparison in this paper.
This paper is organized as follows: Section 2 re-
views recent advancements in out-of-distribution de-
tection. Section 3 describes the proposed DROOD
approach. Section 4 gives some implementation de-
tails and presents the experimental results on several
datasets and for several DNN classification models.
Finally, section 5 presents the conclusion and per-
spectives for future work.
2 RELATED WORK
Detecting out-of-distribution data is essential for en-
suring the safety and reliability of machine learn-
ing systems. Various methods address this challenge
based on how anomalies are defined. Effective OOD
detection requires detectors that can accurately re-
ject inputs that are singular to the training distribution
while accepting those within it.
Recently, advanced statistical methods for OOD
detection in deep neural networks have been devel-
oped. The MLOD (Multitesting-based Layer-wise
Out-of-Distribution Detection) approach (Li et al., )
is one the them. It extracts feature maps across dif-
ferent layers of a model, applies multiple statistical
DNN Layers Features Reduction for Out-of-Distribution Detection
71

hypothesis testing techniques to control the True Pos-
itive Rate (TPR) and computes p-values based on the
empirical distribution of the score function across dif-
ferent layers for decision-making. Another approach,
called p-DkNN (Dziedzic et al., ), performs the sta-
tistical tests on latent representations of a pre-trained
CNN model. p-DkNN is built on theoretical analy-
sis of Neyman-Pearson classification and combined
it with recent works in selective classification (reject
option). The main idea in this approach is to ab-
stain from predicting the out-of-distribution samples
and to maintain high precision on the in-distribution
datasets.
Among the various existing methods, we focused
on four for comparison in this paper, namely ODIN
(Liang et al., ), Mahalanobis (Lee et al., ), OpenPCS-
Class (Carvalho et al., ), and MaSF (Haroush et al.,
). ODIN primarily targets the behavior of the fi-
nal layer by modifying it and pre-processing the in-
put samples. The first modification involves adjust-
ing or controlling the distribution of the network’s
output probabilities, while the second focuses on as-
sessing the impact of the gradients calculated during
training on perturbations applied to the input samples.
The Mahalanobis detector is an approach that extracts
feature maps of the training data classes across the
layers of a pre-trained CNN, assuming these class-
conditional feature maps follow a Gaussian distribu-
tion to estimate their probability density. The detec-
tion score is then computed using the Mahalanobis
distance of each test sample with respect to the clos-
est class-conditional distribution. OpenPCS-Class ap-
plies principal component analysis (PCA) to project
the features of the model’s intermediate layers, as-
suming that the reduced features follow a Gaussian
distribution, and then computes the log-likelihood for
decision-making purposes. Finally, MaSF is based on
test statistics for OOD detection in CNN that used all
the intermediate layers features. The process consists
in spatial and channel reduction techniques to produce
statistics per layer, and these statistics are combined
to define a detection score. The statistical tests are
based on the Simes and Fisher tests.
The proposed DROOD approach is based on a
statistical framework similar to the MaSF and is de-
scribed in the next section. Note that we present the
DROOD method considering CNN-based classifica-
tion models, but this does not affect its generality
and it can easily be transposed to transformer mod-
els, which are also considered in the experiments.
3 PROPOSED APPROACH
This paper seeks to address the out-of-distribution de-
tection problem through the use of statistical hypoth-
esis testing. The hypothesis to be tested is as follows:
(
H
0
: X ∼ P
train
H
1
: X ≁ P
train
where P
train
represents the training distribution.
As illustrated in Figure 1, for CNN based clas-
sification models, the DROOD approach is an OOD
detection method that summarize the information
brought by all channels of a classification network in
a detection statistic. The statistic is build step by step
synthesising each channel then aggregating all chan-
nels synthesis by layer and finally bringing all the lay-
ers together in a single statistic to decide whether an
input image is in or out of P
train
. The proposed pro-
cess to obtain the final decision statistic, considered at
macro scale, is similar to MaSF but the nature of the
determined statistics is different and the assumptions
that underline the reduction process are also different.
Following Figure 1, the next sections provide ana-
lytical details of the DROOD steps. We can also refer
to Figure 2, which gives a detailed description of the
steps sequence, including the analytical expressions.
3.1 Preliminary Notations
Let X
train
= {(X
train
, y)} be the training set composed
of N
train
images drawn from C
train
classes and X
c
train
=
{(X
train
, y)|y = c} its restriction to class c. In the paper
X
c,i
train
denotes the i
th
image of X
c
train
with i from 1 to
n
c
train
, the cardinal of X
c
train
.
By extension, the validation samples gathered in
X
val
are drawn from the same distribution than the
training samples in X
train
and are referred as in-
distribution. The class labels in the two sets are the
same, so C
val
= C
train
. These sets are used to learn the
parameters of the DROOD method. Next, new images
are tested to decide whether they are in-distribution
or not. To keep similar notations the i
th
image of the
test set X
test
is noted X
c,i
test
, where c corresponds ini-
tially to the ”unknown” label. The DNN classification
model will predict the class c ∈ {1, ...,C
train
} (each
value corresponds to a given category) if the image
is detected as in-distribution otherwise the image is
out-of-distribution and the class c remain ”unkown”.
Also note that the so-called C
test
classes in the test
set (which are in fact unknown), are of course not all
the same as the C
train
classes in X
train
to unable out-
of-distribution performance analysis of the DROOD
approach.
ICPRAM 2025 - 14th International Conference on Pattern Recognition Applications and Methods
72
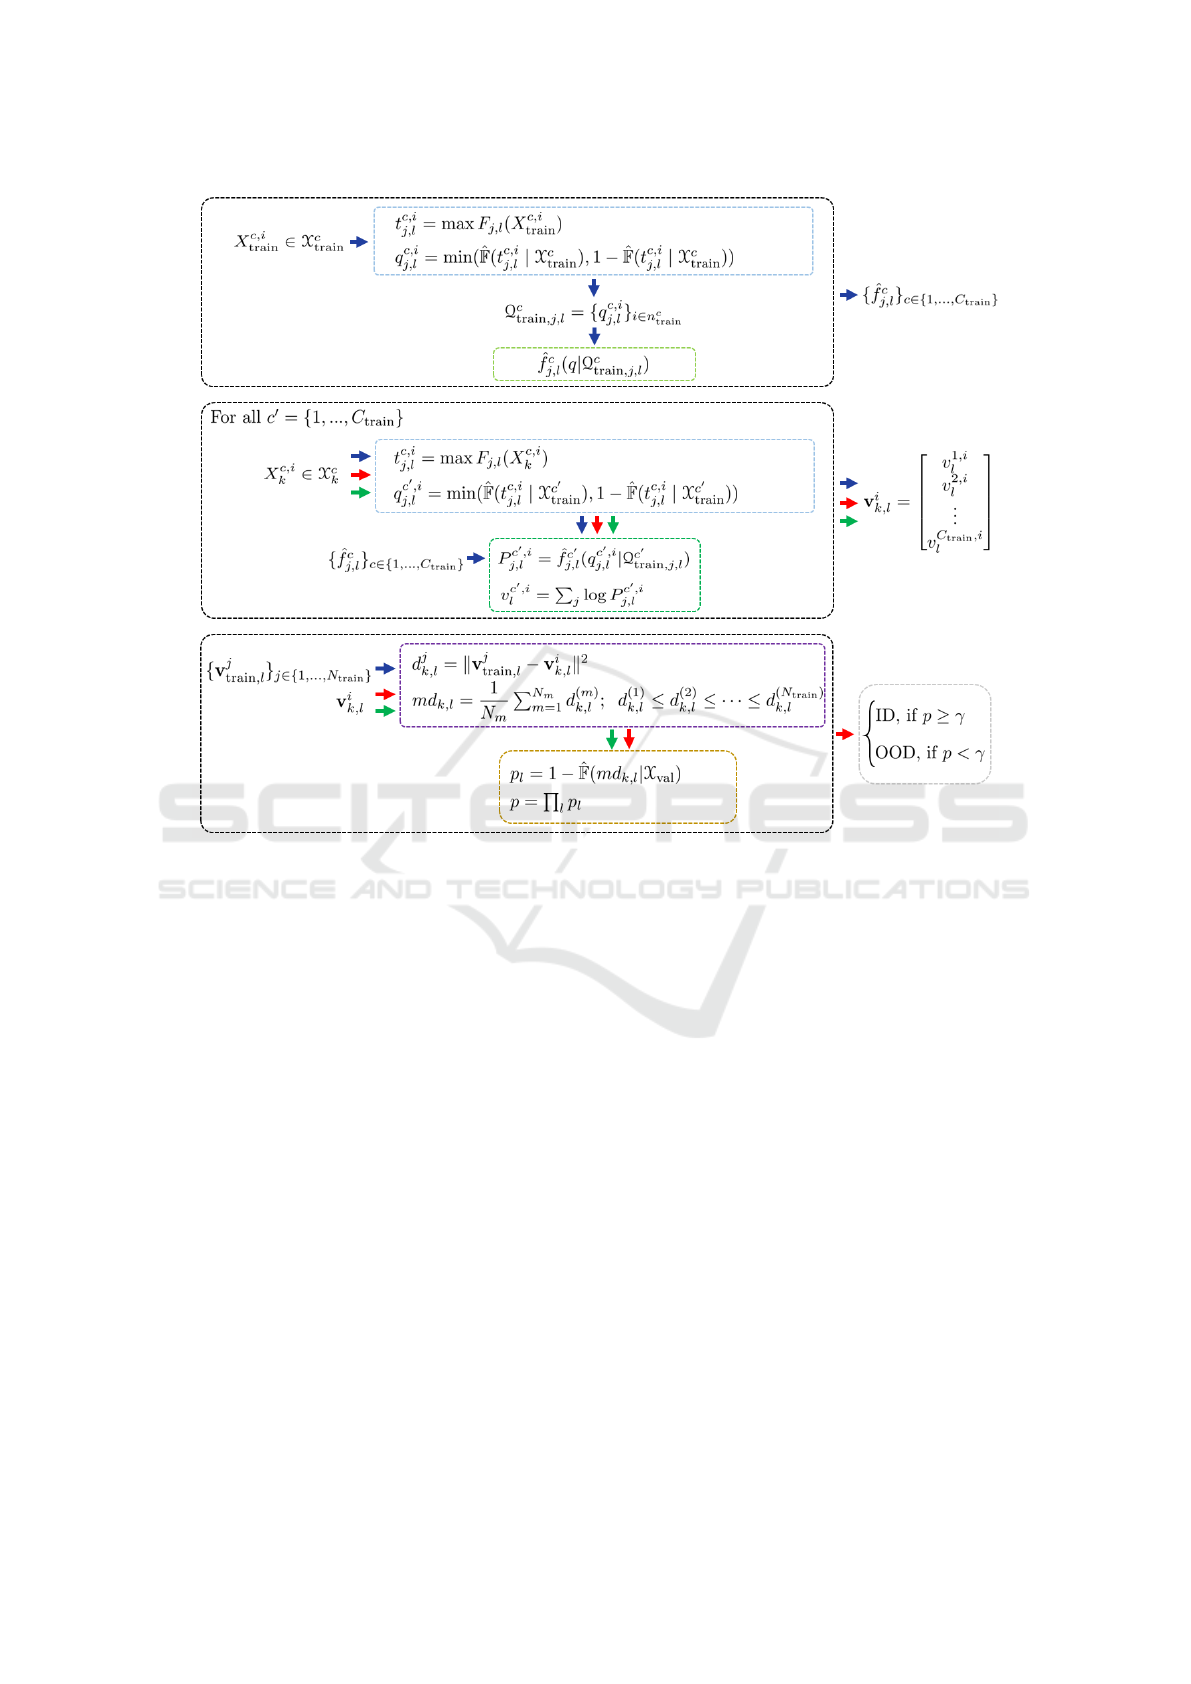
Figure 2: Details of the different steps in the DROOD approach. Frame colors correspond to those in Figure 1. Colored
arrows represent the data flow as shown in the Figure 1.
The main goal of OOD detection is to decide
whether an image X input in a given DNN classifi-
cation model is in-distribution or not. To this end, we
propose a method that use all the intermediate layers
features of the DNN. Typical DNN are composed of
L layers, and each layer l ∈ {1, ..., L} consists of n
l
channels. Let F
j,l
: X → R
w
l
×h
l
be the j-th channel in
the layer l. h
l
and w
l
refer to the size of the channels
in layer l.
3.2 Spatial Reduction
The first step of DROOD is to produce a statistic for
each channel at each layer (light blue frame in Fig-
ure 1 and in the two first black frames of Figure 2).
A spatial reduction is first applied to summarize the
information contained in each channel. Following
(Haroush et al., ) the maximum value is considered
for this purpose:
t
c,i
j,l
= max F
j,l
(X
c,i
k
).
t
c,i
j,l
corresponds to the largest response amplitude for
channel j at layer l and for the image i of the class
c in the set k = {train, val, test}. It relates to the idea
of adapted filters and can be interpreted as the value
at the position in the input features that fits best the
trained filter.
Next, the probability q
c
′
,i
j,l
, to obtained a more ex-
treme value of the statistic t
c
′
j,l
than the observed one
t
c,i
j,l
, is estimated for all classes c
′
. Each probability
captures how singular the obtained value is compared
to the distribution of t
c
′
j,l
for the images of class c
′
. It
can be formalized as:
q
c
′
,i
j,l
= min(
ˆ
F(t
c,i
j,l
| X
c
′
train
), 1 −
ˆ
F(t
c,i
j,l
| X
c
′
train
)),
where
ˆ
F() is the empirical cumulative distribution
function of t
c
′
j,l
determined using training samples
X
c
′
train
. Note that q
c
′
,i
j,l
can be interpreted as a p-value
in the context of a two-sided test.
3.3 Probability Density Estimator
To perform channel reduction, the density f
c
j,l
(q) for
each class c is needed (light green frame in Figure 1
DNN Layers Features Reduction for Out-of-Distribution Detection
73

and first black frame in Figure 2). Its Parzen estimator
ˆ
f
c
j,l
(q|Q
c
train, j,l
) based on the set Q
c
train, j,l
= {q
c,i
j,l
}
i∈n
c
train
is then determined using a Gaussian kernel and cross
validation parameter estimation. These estimators
{
ˆ
f
c
j,l
}
c∈{1,...,C
train
}
(outputs of the first black frame in
Figure 2) are used during channel reduction to esti-
mate conditional probability densities, as described in
next section.
3.4 Channel Reduction
As shown in the green frame in Figure 1 and in the
second black frame in Figure 2, the probability den-
sity for each class c
′
, P
c
′
,i
j,l
, of the input image X
c,i
k
,
k ∈ {train, val,test} is deduced for each channel us-
ing the estimators {
ˆ
f
c
′
j,l
}
c
′
∈{1,...,C
train
}
and the q
c
′
,i
j,l
as
P
c
′
,i
j,l
=
ˆ
f
c
′
j,l
(q
c
′
,i
j,l
|Q
c
′
train, j,l
).
Next, assuming channel independence, channel
reduction conditionally to a class c
′
is deduced by
computing the log-joint probability density of chan-
nels:
v
c
′
,i
l
=
∑
j
logP
c
′
,i
j,l
.
These log-joint conditional probabilities form a vec-
tor v
i
k,l
in a space S
l
of dimension C
train
, the number
of classes in the training set:
v
i
k,l
=
h
v
1,i
l
v
2,i
l
··· v
C
train
,i
l
i
T
,
where T stands for the transpose operator. Its coor-
dinates characterise how likely are jointly the most
prominent channels response conditionally to each
trained class.
3.5 Nearest Neighbor Method
Following channel reduction, outlier observations
should be far from the origin in S
l
. To evaluate how
far an observation lays from training ones, a nearest
neighbor method (purple frame in Figure 1 and in the
last black frame of Figure 2) is considered.
The mean euclidean distance, noted md
k,l
, be-
tween v
i
k,l
and the N
m
nearest training samples
{v
j
train,l
}
j∈N
train
, in S
l
, is determined. For j ∈ N
train
:
d
j
k,l
= ∥v
j
train,l
− v
i
k,l
∥
2
,
and
md
k,l
=
1
N
m
N
m
∑
m=1
d
(m)
k,l
,
where d
(1)
k,l
≤ d
(2)
k,l
≤ ··· ≤ d
(N
train
)
k,l
are the sorted dis-
tances to training neighbors. md
k,l
indicates how well
the input sample resembles N
m
training ones.
3.6 Layer Reduction
To obtain the detection statistics, we finally perform a
layer reduction (light orange frame in Figure 1 and in
the last black frame of Figure 2). To do so, the proba-
bility p
l
that the mean distance between one sample at
layer l and the training samples could be larger than
the obtained value md
k,l
is estimated for each layer
(p-value of md
k,l
) using empirical cumulative distri-
bution estimator:
p
l
= 1 −
ˆ
F(md
k,l
|X
val
).
To determine the empirical cumulative distribution,
we use the validation set X
val
to ensure the indepen-
dence of the obtained p-values with the training data.
The joint probability of mean distances for all lay-
ers p is computed assuming layer independence as the
product of p
l
for all l:
p =
L
∏
l=1
p
l
.
We can therefore note that the larger this final prob-
ability is the more likely the sample belongs to one
of the trained classes, leading to the detector defined
below.
3.7 Detector
To implement detection (light grey frame in Figure 1
and output of the third black frame in Figure 2), p is
compared to a threshold γ ∈ [0, 1] to decide whether
the image has to be classified or discarded. The de-
tector is defined as follows:
The tested image is:
(
ID, if p ≥ γ
OOD, if p < γ
4 EXPERIMENTS
This section describes the data, the DNN classifica-
tion models, the experiments and discusses the re-
sults. It should be noted that we carried out all the
simulations of the OOD methods used to compare
performance with DROOD.
4.1 Datasets
As generally considered for OOD experiments, five
datasets are used in this paper. CIFAR10 (Krizhevsky,
) is used as the in-distribution dataset. It consists of 10
classes and contains 50,000 train images, split in train
(40,000) and validation (10,000) sets, and 10,000 test
ICPRAM 2025 - 14th International Conference on Pattern Recognition Applications and Methods
74

images. This dataset is made up of natural images
with one dominant object per image such as vehicle,
animal, or boat.
The remaining four datasets are used as out-of-
distribution data. The Large-scale Scene UNderstand-
ing (LSUN) test dataset (Yu et al., ) contains 10,000
images with 10 classes representing different envi-
ronments, both natural and man-made. The Street
View House Numbers (SVHN) test dataset (Netzer
et al., ) contains 26,032 digits images (from 0 to
9), extracted from house numbers images captured
by Google Street View. The TinyImageNet (Le and
Yang, ) dataset, a subset of the larger ImageNet
dataset, containing 200 classes. The test set contains
10,000 images. Finally, the CIFAR100 test dataset
(Krizhevsky, ), which contains 10,000 images of 100
classes, is made up of natural images close to CI-
FAR10.
4.2 Model Architectures
The proposed DROOD method falls under post-
hoc out-of-distribution detection methods. In this
study, as classification models, we used two CNN:
ResNet34 (He et al., ) and DenseNet-BC (Huang
et al., ) and one transformer: the Vision Trans-
former (Dosovitskiy et al., ), referenced as ViT
1
).
All these models are trained on the CIFAR10 train-
ing set, the considered in-distribution dataset. These
models achieved good accuracy, reaching 0.9510 with
ResNet34, 0.9400 with DenseNet-BC and 0.9852
with ViT, on the CIFAR10 test set.
In the experiments, for MaSF and DROOD meth-
ods, the spatial reduction (or max operation) is ap-
plied to the channels at each layer of the CNN mod-
els. For the ViT model, this operation is performed
on all tokens, excluding the ”class token”, across the
transformer encoding layers. The ”class token” is ex-
cluded because it gathers information from the other
tokens within these encoding layers. Consequently,
we can expect the application of spatial reduction to
the remaining ”image tokens” to be equivalent to the
direct consideration of the ”class token”. However, in
this paper, we want to keep the flow exactly the same
as for the CNN models, for fair comparison. Note
that the MaSF method, initially developed for CNN
has been adapted to ViT.
The OpenPCS-Class method is originally applied
to the Vision Transformer architecture. For our exper-
imental evaluation, we have adapted this approach to
CNN architectures.
1
ViT weights have been uploaded from Hugging
Face web site: https://huggingface.co/nateraw/
vit-base-patch16-224-cifar10
The Mahalanobis approach was originally pro-
posed for CNN models. The code provided by the
authors cannot be used for the Vision Transformer
architecture, as it requires too much memory space.
Consequently, it is only used as comparison method
with the CNN models.
4.3 Evaluation Metrics
As generally considered, the following metrics are
used to evaluate the detection performance: the false
positive rate of the OOD data when the true posi-
tive rate of the ID data is 95%, denoted as FPR95;
the true positive rate of the ID data when the FPR of
the OOD data is 5%, referred to as TPR95; and the
area under the receiver operating characteristic curve
(AUC), which quantifies how well a detector can sep-
arate ID data from OOD data. In the tables, ↓ (or ↑)
indicates that lower (or higher) values are preferable,
while bold text highlights the best results in each row.
4.4 Experimental Results
All experimental results on the considered DNN
classification models (CNNs and transformers) are
summarized in Table 1 for ResNet34, Table 2 for
DenseNet-BC and Table 3 for ViT.
The hyperparameters of the method are the ker-
nels, the bandwidth of the kernels for estimating prob-
ability densities, the number of neighbours for cal-
culating the mean distance and the decision thresh-
old. For the probability density estimators, the chosen
kernels are Gaussians and their bandwidth has been
determined by cross-validation on the training data.
The choice of the number of neighbors Nm was de-
termined empirically. After experiments, we set the
Nm to 5 which gives the best results. The detec-
tion threshold γ has been chosen according to targeted
false alarm rate measured on validation set.
The detection performance of the DROOD ap-
proach is very good on both far-out-of-distribution
(LSUN, SVHN and TinyImageNet) and near-out-
of-distribution (CIFAR100) datasets, outperforming
most of the time the reference methods. Based on
these results, one can also note that OOD detection
performs better when using the ViT model.
In many OOD detection methods, CIFAR10 and
CIFAR100 are among the most difficult datasets to
evaluate, especially when one of these datasets is used
as an in-distribution, due to the close similarities of
some classes. Despite this, the DROOD approach
achieves the best performance in OOD detection for
all DNN considered, with CIFAR10 used as the ID set
and CIFAR100 as the OOD set.
DNN Layers Features Reduction for Out-of-Distribution Detection
75
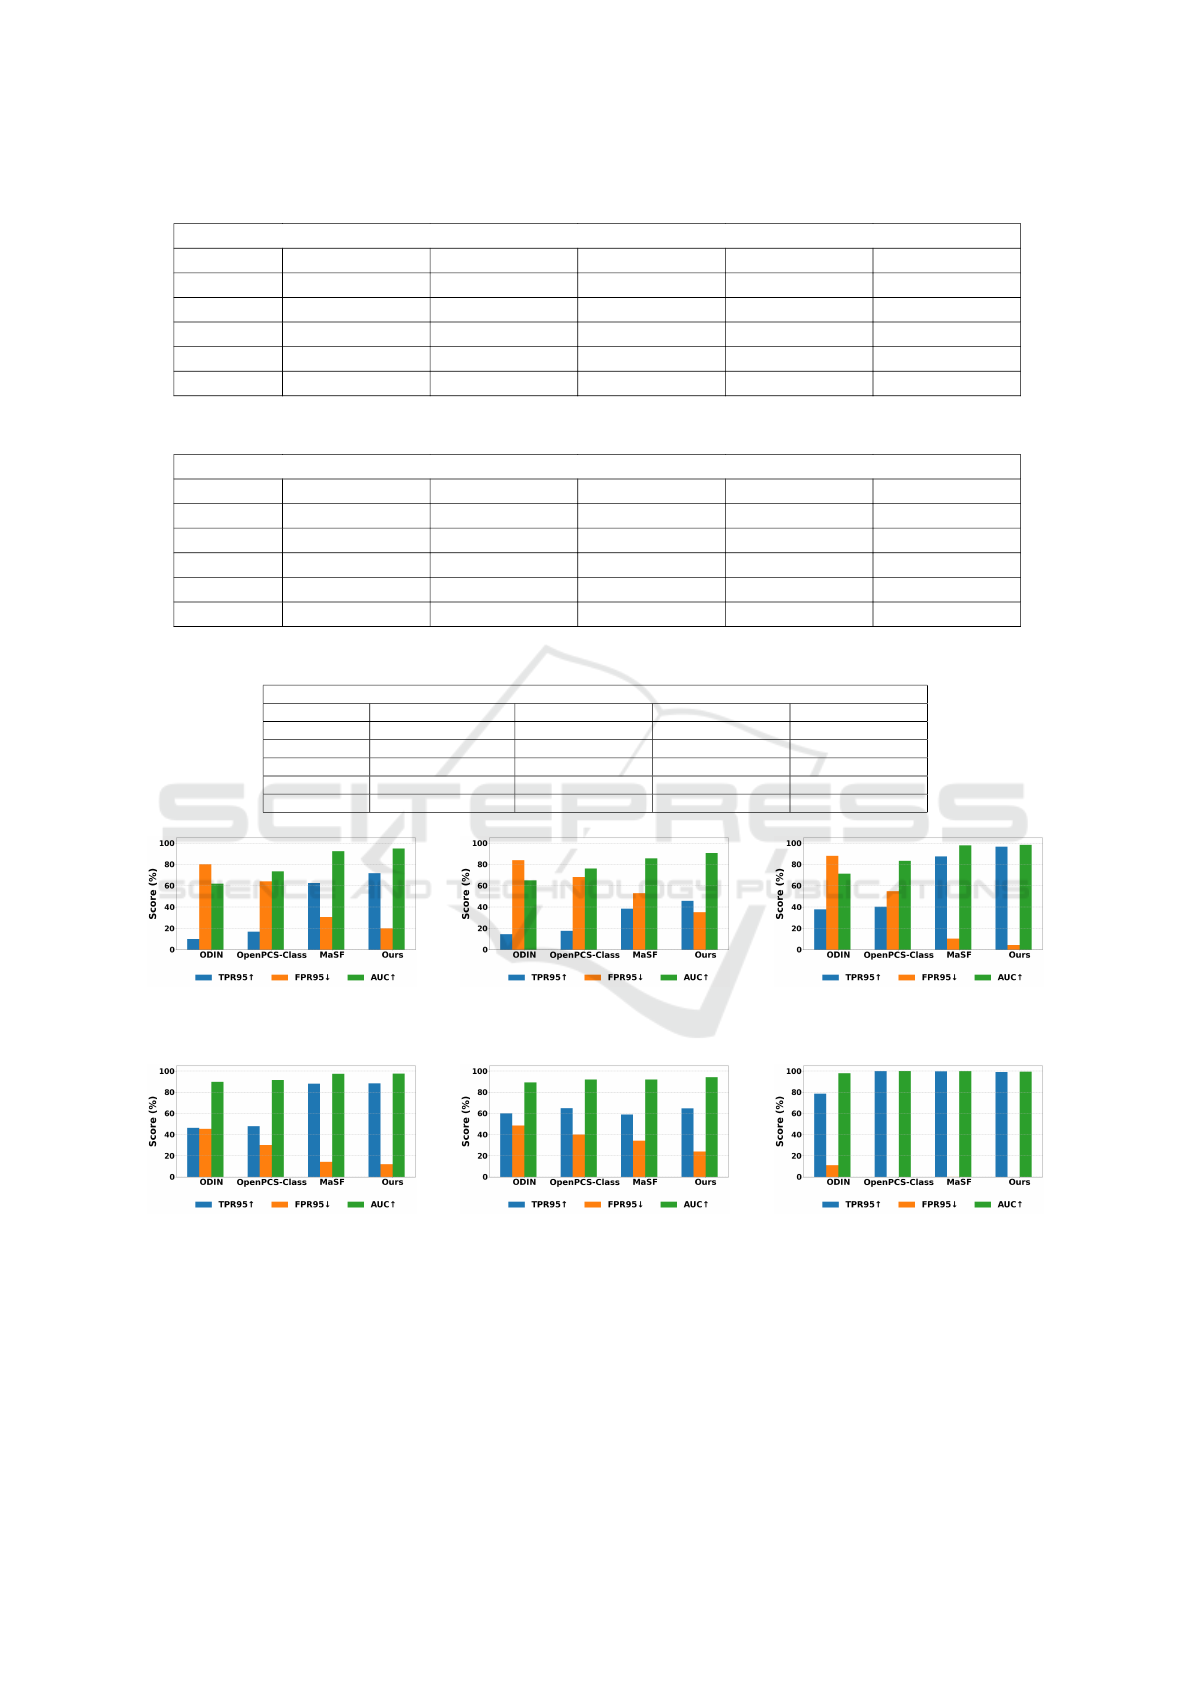
Table 1: Performance results using ResNet34.
TPR95↑ / FPR95↓ / AUC↑ (%)
OOD datasets ODIN Mahalanobis OpenPCS-Class MaSF Ours
CIFAR100 33.50 / 52.90 / 85.90 42.68 / 37.54 / 89.08 65.98 / 28.44 / 93.30 83.61 / 20.25 / 96.40 84.83 / 14.52 / 97.14
LSUN 92.90 / 8.50 / 98.60 92.17 / 7.18 / 98.34 98.76 / 0.09 / 99.40 99.73 / 0.19 / 99.81 99.91 / 0.01 / 99.91
SVHN 41.50 / 47.90 / 88.10 98.24 / 3.03 / 99.04 82.95 / 19.23 / 95.93 99.73 / 0.06 / 99.83 99.91 / 0.00 / 99.95
TinyImageNet 89.20 / 17.50 / 97.40 89.82 / 7.35 / 97.91 98.76 / 0.25 / 99.41 99.37 / 0.35 / 99.77 98.54 / 1.12 / 99.63
Average 64.27 / 31.70 / 92.50 80.72 / 13.77 / 96.09 86.61 / 12.00 / 97.01 95.61 / 5.21 / 98.95 95.79 / 3.91 / 99.15
Table 2: Performance results using DenseNet-BC.
TPR95↑ / FPR95↓ / AUC↑ (%)
OOD datasets ODIN Mahalanobis OpenPCS-Class MaSF Ours
CIFAR100 33.25 / 55.43 / 84.99 33.96 / 56.40 / 83.60 67.17 / 40.48 / 91.85 55.99 / 42.80 / 89.89 68.00 / 25.58 / 93.90
LSUN 91.00 / 10.15 / 98.07 90.23 / 7.66 / 98.06 85.85 / 27.58 / 95.65 99.61 / 0.14 / 99.86 99.98 / 0.00 / 99.98
SVHN 61.48 / 42.95 / 91.12 96.95 / 3.30 / 98.89 91.04 / 16.23 / 97.24 99.57 / 0.01 / 99.89 99.98 / 0.00 / 99.98
TinyImageNet 86.70 / 16.61 / 97.02 65.26 / 17.47 / 94.63 82.86 / 29.66 / 95.00 98.23 / 2.08 / 99.51 98.27 / 1.96 / 99.53
Average 68.10 / 31.28 / 92.80 71.60 / 21.20 / 93.79 81.73 / 28.48 / 94.93 88.35 / 11.25 / 97.28 91.55 / 6.88 / 98.34
Table 3: Performance results using ViT.
TPR95↑ / FPR95↓ / AUC↑ (%)
OOD datasets ODIN OpenPCS-Class MaSF Ours
CIFAR100 71.40 / 16.90 / 95.50 94.51 / 5.34 / 98.70 98.39 / 2.01 / 99.53 99.64 / 0.06 / 99.75
LSUN 93.10 / 6.00 / 98.60 99.75 / 0.15 / 99.80 99.92 / 0.00 / 99.95 99.71 / 0.00 / 99.83
SVHN 93.90 / 5.90 / 98.60 98.83 / 0.60 / 99.60 99.95/ 0.00 / 99.96 99.71 / 0.00 / 99.83
TinyImageNet 80.10 / 11.20 / 97.60 98.38 / 1.34 / 99.65 99.92 / 0.00 / 99.95 99.71 / 0.00 / 99.78
Average 84.62 / 10.00 / 97.57 97.86 / 1.85 / 99.43 99.54 / 0.50 / 99.84 99.69 / 0.01 / 99.79
(a) ResNet34 (b) DenseNet-BC (c) ViT
Figure 3: Performance results of the CIFAR100 ”bus” class.
(a) ResNet34 (b) DenseNet-BC (c) ViT
Figure 4: Performance results of the CIFAR100 ”cockroach” class.
Finally, we propose to focus on the ”bus” (Figure
3) and ”cockroach” (Figure 4) classes of CIFAR100.
The first one is very similar to CIFAR10 ”automo-
bile” class, while ”cockroach” is not close to any CI-
FAR10 classes. DROOD is particularly effective for
the ”bus” class detection, whatever the DNN model,
and outperforms reference methods. The ”cockroach”
class is perfectly detected by almost all methods, as
expected.
ICPRAM 2025 - 14th International Conference on Pattern Recognition Applications and Methods
76

5 CONCLUSION
The DROOD method is based on a statistical frame-
work for OOD detection. It is a successive syn-
thesis of statistics using all the features produced
by a DNN. The experimental study shows very
good detection performances compared to state-of-
the-art methods with two image classification net-
works based on CNNs and one based on transformers,
which also demonstrates its ability to perform what-
ever the model.
We observed variations in performance depend-
ing on the DNN chosen and the OOD method, which
seems in a certain way normal. However, some ex-
isting OOD detection methods appear to be linked
to specific neural network architectures, since perfor-
mances vary considerably when applied with others.
Experiments suggest that our DROOD detection ap-
proach is more robust than others.
As further work, It would be of course interesting
to test other distances than the Euclidean distance. As
mentioned above, in the transformer architecture, the
”class token” gathers information from the ”image to-
kens” across the transformer encoding layers for the
final classification task. One can therefore expect that
the max operation in MaSF and DROOD methods can
be effectively replaced by the use of this ”class to-
ken”. Finally, it would also be interesting to experi-
ment with this type of approach in other application
fields, such as audio analysis or image segmentation.
REFERENCES
Carvalho, T. M., Vellasco, M. M. B. R., and do Amaral, J.
F. M. Out-of-distribution detection in deep learning
models: A feature space-based approach. In Interna-
tional Joint Conference on Neural Networks, IJCNN,
Gold Coast, Australia, June 18-23, 2023, pages 1–7.
Dosovitskiy, A., Beyer, L., Kolesnikov, A., Weissenborn,
D., Zhai, X., Unterthiner, T., Dehghani, M., Minderer,
M., Heigold, G., Gelly, S., Uszkoreit, J., and Houlsby,
N. An image is worth 16x16 words: Transformers
for image recognition at scale. In International Con-
ference on Learning Representations, ICLR, May 3-7,
2021.
Dziedzic, A., Rabanser, S., Yaghini, M., Ale, A., Erdogdu,
M. A., and Papernot, N. p-dknn: Out-of-distribution
detection through statistical testing of deep represen-
tations. ArXiv, 2022.
Haroush, M., Frostig, T., Heller, R., and Soudry, D. A statis-
tical framework for efficient out of distribution detec-
tion in deep neural networks. In International Confer-
ence on Learning Representations, ICLR, April 25-29,
2022.
He, K., Zhang, X., Ren, S., and Sun, J. Deep residual
learning for image recognition. In IEEE Conference
on Computer Vision and Pattern Recognition, CVPR,
June 27-30, 2016, Las Vegas, NV, USA, pages 770–
778.
Hendrycks, D. and Gimpel, K. A baseline for detecting mis-
classified and out-of-distribution examples in neural
networks. In International Conference on Learning
Representations, ICLR, April 24-26, 2017, Toulon,
France.
Huang, G., Liu, Z., Van Der Maaten, L., and Weinberger,
K. Q. Densely connected convolutional networks.
In IEEE Conference on Computer Vision and Pattern
Recognition, CVPR, 2017, Honolulu, HI, USA, pages
2261–2269.
Kaur, R., Jha, S., Roy, A., Park, S., Dobriban, E., Sokol-
sky, O., and Lee, I. idecode: In-distribution equivari-
ance for conformal out-of-distribution detection. In
AAAI Conference on Artificial Intelligence, 2022,
volume 36, pages 7104–7114.
Krizhevsky, A. Learning multiple layers of features from
tiny images. Technical report, University of Toronto,
2009, Toronto, Ontario.
Le, Y. and Yang, X. Tiny imagenet visual recognition chal-
lenge. CS 231N, 2015, 7(7):3.
Lee, K., Lee, K., Lee, H., and Shin, J. A simple unified
framework for detecting out-of-distribution samples
and adversarial attacks. In Bengio, S., Wallach, H. M.,
Larochelle, H., Grauman, K., Cesa-Bianchi, N., and
Garnett, R., editors, Advances in Neural Information
Processing Systems 31: Annual Conference on Neural
Information Processing Systems, NeurIPS, December
3-8, 2018, Montr
´
eal, Canada.
Li, J., Li, S., Wang, S., Zeng, Y., Tan, F., and Xie,
C. Enhancing out-of-distribution detection with
multitesting-based layer-wise feature fusion. In IEEE
Conference on Artificial Intelligence, CAI, 25-27
June, 2024, Singapore, pages 510–517.
Liang, S., Li, Y., and Srikant, R. Enhancing the reliability
of out-of-distribution image detection in neural net-
works. In International Conference on Learning Rep-
resentations, ICLR, April 30 - May 3, 2018, Vancou-
ver, BC, Canada.
Liu, W., Wang, X., Owens, J., and Li, Y. Energy-based
out-of-distribution detection. In Larochelle, H., Ran-
zato, M., Hadsell, R., Balcan, M., and Lin, H., editors,
Advances in Neural Information Processing Systems,
2020, volume 33, pages 21464–21475.
Malinin, A. and Gales, M. Predictive uncertainty estimation
via prior networks. Advances in Neural Information
Processing Systems 31: Annual Conference on Neural
Information Processing Systems, NeurIPS, December
3-8, 2018, Montr
´
eal, Canada.
Netzer, Y., Wang, T., Coates, A., Bissacco, A., Wu, B., Ng,
A. Y., et al. Reading digits in natural images with
unsupervised feature learning. In NIPS workshop
on deep learning and unsupervised feature learning,
2011, Granada, page 4.
Raghuram, J., Chandrasekaran, V., Jha, S., and Banerjee,
S. A general framework for detecting anomalous in-
puts to dnn classifiers. In International Conference on
Machine Learning, ICML, 2021, pages 8764–8775.
DNN Layers Features Reduction for Out-of-Distribution Detection
77

Sastry, C. S. and Oore, S. Detecting out-of-distribution ex-
amples with gram matrices. In International Confer-
ence on Machine Learning, ICML, 2020, pages 8491–
8501.
Sun, Y. and Li, Y. DICE: leveraging sparsification for
out-of-distribution detection. In Avidan, S., Brostow,
G. J., Ciss
´
e, M., Farinella, G. M., and Hassner, T.,
editors, European Conference on Computer Vision,
ECCV, October 23-27, 2022, Tel Aviv, Proceedings,
Part XXIV, volume 13684, pages 691–708.
Winkens, J., Bunel, R., Guha Roy, A., Stanforth, R., Natara-
jan, V., Ledsam, J. R., MacWilliams, P., Kohli, P.,
Karthikesalingam, A., Kohl, S., Cemgil, T., Eslami, S.
M. A., and Ronneberger, O. Contrastive training for
improved out-of-distribution detection. arXiv, 2020.
Yu, F., Zhang, Y., Song, S., Seff, A., and Xiao, J. LSUN:
construction of a large-scale image dataset using deep
learning with humans in the loop. arXiv, 2015.
Zhang, H., Li, A., Guo, J., and Guo, Y. Hybrid models
for open set recognition. In European Conference on
Computer Vision, ECCV, August 23–28, 2020, Glas-
gow, UK, Proceedings, Part III 16, pages 102–117.
Zisselman, E. and Tamar, A. Deep residual flow for out of
distribution detection. In IEEE Conference on Com-
puter Vision and Pattern Recognition, CVPR, 2020,
pages 13994–14003.
ICPRAM 2025 - 14th International Conference on Pattern Recognition Applications and Methods
78
