
Occlusion Detection for Face Image Quality Assessment
Jacob Carnap
1 a
, Alexander Kurz
2 b
, Olaf Henniger
2 c
and Arjan Kuijper
1, 2 d
1
Technical University of Darmstadt, Department of Computer Science, Darmstadt, Germany
2
Fraunhofer Institute for Computer Graphics Research IGD, Darmstadt, Germany
Keywords:
Biometrics, Face Recognition, Face Image Quality Assessment.
Abstract:
The accuracy of 2D-image-based face recognition systems depends on the quality of the compared face im-
ages. One factor that affects the recognition accuracy is the occlusion of face regions, e.g., by opaque sun-
glasses or medical face masks. Being able to assess the quality of captured face images can be useful in
various scenarios, e.g., in a border entry/exit system. This paper discusses a method for detecting face oc-
clusions and for measuring the percentage of occlusion of a face using face segmentation and face landmark
estimation techniques. The method is applicable to arbitrary face images, not only to frontal or nearly frontal
face images. The method was evaluated by applying it to publicly available face image data sets and analyzing
the results obtained. The evaluation shows that the proposed method enables the effective detection of face
occlusions.
1 INTRODUCTION
The accuracy of a face recognition system depends
on the quality of the available images, where quality
means utility or usefulness for automatic face recog-
nition (ISO/IEC 29794-1, 2024). Assessing the qual-
ity of face images can be useful in various applica-
tions. Low-quality images can be discarded to reduce
the false non-match rate. This is particularly impor-
tant in large-scale systems such as entry/exit systems
for monitoring border crossings. Face image quality
assessment can also be used when verifying the com-
pliance of passport photographs.
Various factors influence whether a person can be
recognized in an image. These include the image res-
olution, underexposure and overexposure, the head
pose, and the degree of occlusion of the face. Occlu-
sions include hair, opaque sunglasses and any objects
in front of the face (such as medical face masks, hat
brims or hands). Beards, moustaches and eyebrows
are not considered as occlusions (ICAO, 2018). In
case of occlusions, the utility of the face image for
recognition decreases. Therefore, assessing the de-
gree of face occlusion can contribute to the overall
assessment of the quality of the face image and gives
a
https://orcid.org/0009-0007-8973-5749
b
https://orcid.org/0000-0001-6175-9203
c
https://orcid.org/0000-0003-2499-8613
d
https://orcid.org/0000-0002-6413-0061
actionable feedback to the user.
The contributions of this paper are:
1. To clarify the method to assess the percentage of
face occlusion such that it works on any face im-
age, not only on frontal and nearly frontal face
images (Section 3),
2. To evaluate the results of the proposed method on
customized and publicly available data sets (Sec-
tions 4 and 5),
3. To outline how to choose the maximum permis-
sible face occlusion for a biometric system (Sec-
tion 5.5).
2 RELATED WORK
A standard for how to calculate face image qual-
ity measures is under development (ISO/IEC FDIS
29794-5, 2024). Several state-of-the-art face im-
age quality assessment methods are available (Merkle
et al., 2022). To better understand face image quality
assessment, algorithms can currently be submitted to
NIST for comparative evaluation (Yang et al., 2024).
Just as the NFIQ (NIST Fingerprint Image Qual-
ity) software (Tabassi et al., 2021) has been es-
tablished as reference implementation for the stan-
dard for assessing the quality of fingerprint images
(ISO/IEC 29794-4, 2024), the OFIQ (Open Source
Carnap, J., Kurz, A., Henniger, O. and Kuijper, A.
Occlusion Detection for Face Image Quality Assessment.
DOI: 10.5220/0013168500003905
In Proceedings of the 14th International Conference on Pattern Recognition Applications and Methods (ICPRAM 2025), pages 657-664
ISBN: 978-989-758-730-6; ISSN: 2184-4313
Copyright © 2025 by Paper published under CC license (CC BY-NC-ND 4.0)
657
Face Image Quality) software (Merkle et al., 2024)
has been developed to serve as reference implementa-
tion for the emerging standard for assessing the qual-
ity of face images (ISO/IEC FDIS 29794-5, 2024). In
addition to an overall quality score, OFIQ returns a
vector of quality measures. The percentage of face
occlusion is included in the OFIQ output vector. We
use it as benchmark in our experiments.
3 PERCENTAGE OF FACE
OCCLUSION
3.1 Overview
For assessing the degree of face occlusion, this pa-
per adopts and advances the approach of the emerg-
ing standard (ISO/IEC FDIS 29794-5, 2024) and of
NIST’s face analysis technology evaluation (Yang
et al., 2024), calculating the percentage of occlusion
in the area between the eyebrows and the chin. The
forehead is excluded because it contains little identi-
fying information.
To measure the percentage of face occlusion, two
regions need to be determined: The face region of in-
terest and the part of it that is occluded. The face
region of interest is referred to as landmarked region
because it is determined using facial landmarks (see
Section 3.2). The part of the landmarked region that is
occluded is determined using a binary pixel-wise seg-
mentation map that indicates for each pixel whether it
belongs to the face or not (see Section 3.3).
3.2 Landmarked Region
Several state-of-the-art facial landmark estimators are
available (Merkle et al., 2022). We use the landmark
estimator skps (Lz, 2023) to estimate the positions of
facial landmarks. It takes a face bounding box as in-
put and estimates the positions of 98 landmarks that
outline the face, eyebrows, eyes, nose, and mouth. To
detect faces and to draw face bounding boxes, many
face detectors are available (Merkle et al., 2022). We
use a modified version of the YOLO network (Red-
mon et al., 2016), trained to recognize faces (hpc203,
2024).
The facial landmarks form the basis for determin-
ing the landmarked region. The emerging standard
(ISO/IEC FDIS 29794-5, 2024) suggests computing
the convex hull of the landmarks. In mathematical
terms, the boundary of the convex hull of a set of
landmarks is the simple closed curve with minimum
perimeter containing all landmarks. This works well
for frontal and nearly frontal face images. For non-
frontal face images, however, the convex hull of the
landmarks can include portions of the background,
which is not intended. To avoid this, we draw a con-
cave polygon connecting the landmarks on the face
contour and on the upper boundaries of the eyebrows
and consider all pixels inside and on this concave
polygon as landmarked region.
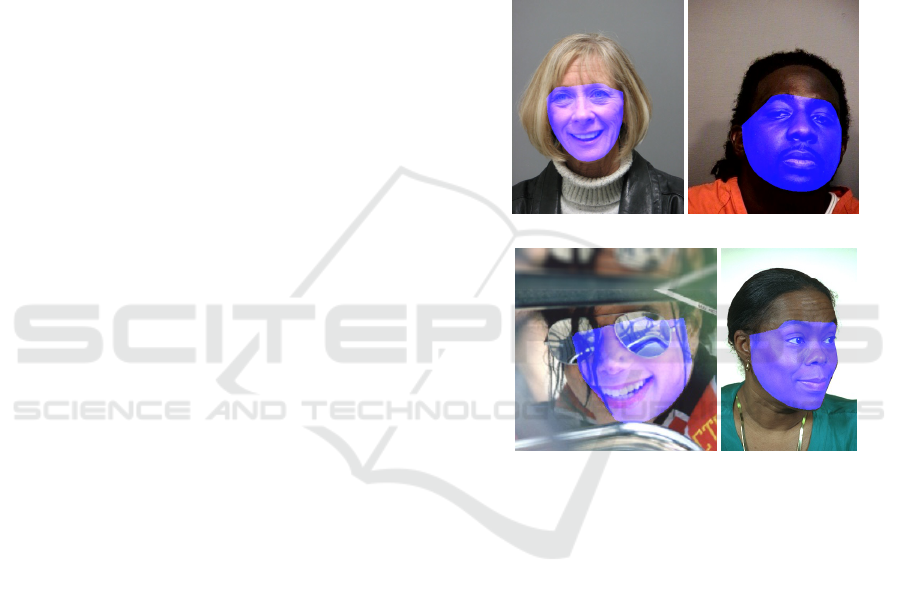
Figure 1 shows examples of landmarked regions
determined using the proposed method, including
both very good and faulty results. The landmarked
region in Fig. 1c on a heavily occluded face is faulty.
(a) (b)
(c) (d)
Figure 1: Landmarked regions determined using skps,
marked in blue on the original face image.
3.3 Face Segmentation Map
Several state-of-the-art face segmentation methods
are available (Merkle et al., 2022). We adopted
the face segmentation approach face3d0725 (Yin and
Chen, 2022), which is recommended in the emerg-
ing standard (ISO/IEC FDIS 29794-5, 2024) and also
used in OFIQ (Merkle et al., 2024). The method
utilizes an alignment technique based on facial land-
marks, resizing the image to a resolution of 256 ×256
pixels. The model generates a pixel-wise binary seg-
mentation map of the face image. As desired, hair
hanging over the face is counted as occlusion, while
facial features such as beards, mustaches, and eye-
brows are not. Side whiskers, however, are counted
as occlusions. Also, glasses are counted as occlusion
even if the frame is neither extremely thick nor oc-
ICPRAM 2025 - 14th International Conference on Pattern Recognition Applications and Methods
658
cluding the eyes. This deviates from the requirements
(ICAO, 2018; ISO/IEC 19794-5, 2011). The baseline
model is structured on a ResNet-18 backbone, follow-
ing the U-Net architecture, and trained using a binary
cross-entropy loss combined with online hard exam-
ple mining.
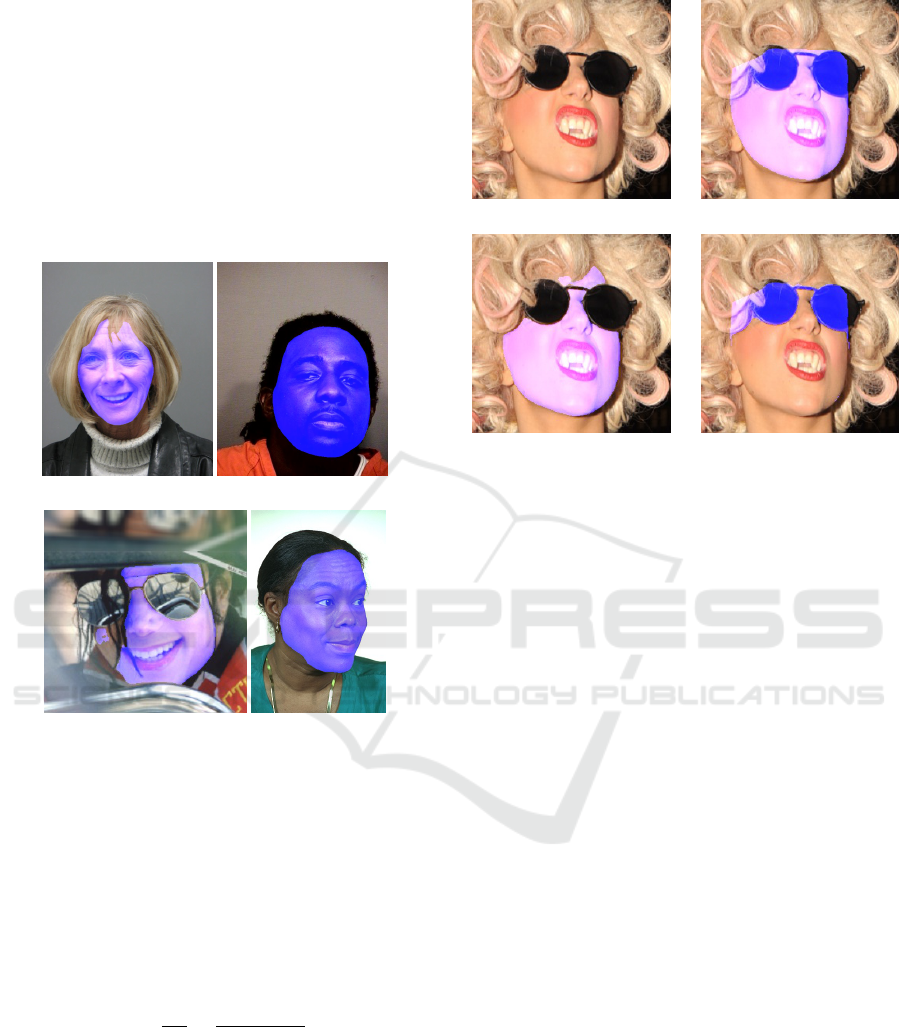
Figure 2 shows examples of segmentation maps.
While the segmentation maps are very accurate in
general, image Fig. 2c highlights an imperfection,
where the segmentation model struggles to accurately
capture the left side of the face.
(a) (b)
(c) (d)
Figure 2: Face segmentation maps marked in blue on the
original face image.
3.4 Occluded Region
Let F be the landmarked region, S the segmentation
map containing the face pixels that are not occluded,
and O = F − F ∩ S the area within the face that is
occluded. Then the percentage of occlusion α is the
ratio of |O| to |F| (ISO/IEC FDIS 29794-5, 2024):
α =
|O|
|F|
=
|F − F ∩ S|
|F|
(1)
The output is a value between 0 and 1. |Y| represents
the number of pixels in an image region Y , i.e., the
area of that region.
Figure 3 shows the relevant face regions. The per-
centage of face occlusion in the example is calculated
to be 28.9 %.
(a) Face image. (b) Landmarked region F.
(c) Segmentation map S. (d) Occluded region O.
Figure 3: Examples of the regions used in Eq. (1), marked
in blue on the original face image.
3.5 Sources of Errors
There are various reasons that can cause a deviation of
the determined value from the expected value. Such
deviations in the context of face occlusion can occur
due to a faulty landmarked region (see Section 3.2)
or due to a faulty face segmentation map (see Sec-
tion 3.3).
An issue occurs at the boundaries of the regions.
Even if there is no occlusion and both the landmarked
region and the segmentation map contain no signifi-
cant errors, a small percentage of occlusion can still
be measured. This happens when the face contour of
the segmentation map is placed more centrally than
the landmarked region. An example is the left side
of the face image in Fig. 4. Although no occlu-
sion is evident on the left side, a minor occlusion is
mistakenly detected due to the deviation between the
landmarked region and the segmentation map. Ap-
proaches to solve this problem include rounding to
fewer decimal places, introducing a threshold above
which occlusion is counted, or automatic downsizing
of the landmarked region.
Another issue that deserves attention is the po-
tential for varying interpretations of the underlying
definitions. For instance, opaque lenses of glasses
are supposed to count as occlusion while transparent
lenses do not. However, the criteria for distinguishing
between opaque and transparent lenses are not explic-
itly defined. This makes it challenging to differentiate
between both and leaves room for interpretations.
Occlusion Detection for Face Image Quality Assessment
659
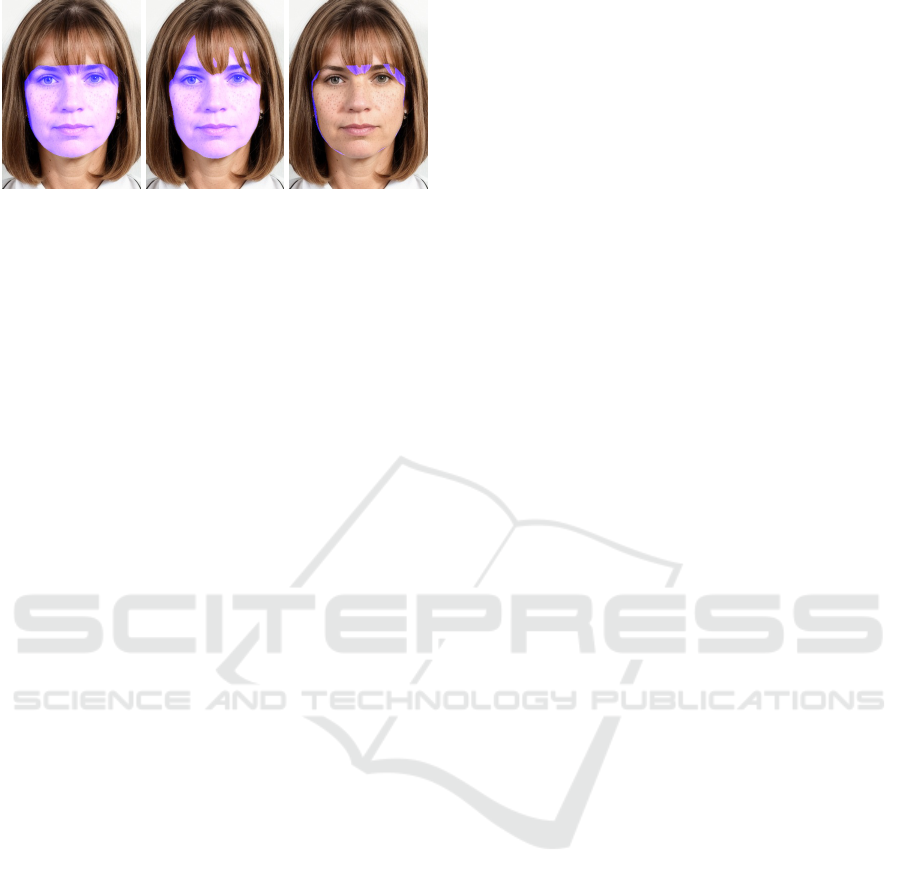
(a) Landmarked
region F.
(b) Segmentation
map S.
(c) Occluded
region O.
Figure 4: Example of the issue occurring at the boundaries
of the regions.
4 EXPERIMENTAL SETUP
4.1 Face Image Data Sets
For evaluating the performance of the presented
method, we use the following face image data sets,
which are publicly available for research purposes:
• Caltech Occluded Faces in the Wild (COFW) data
set (Burgos-Artizzu et al., 2022): We chose this
data set because baseline segmentation maps (Yin
and Chen, 2022) and 68 baseline landmarks (Ghi-
asi and Fowlkes, 2015) are given for 507 images
from this data set. From these baselines, we cal-
culated baseline values for the percentage of face
occlusion, using Eq. (1).
• ONOT data set (Di Domenico et al., 2024): This
data set is a collection of synthetic high-quality,
well-controlled images with frontal pose, neu-
tral expression, uniform background as well as
no occlusion as required for enrolment (ISO/IEC
19794-5, 2011). We chose this data set because it
contains face images known to be without occlu-
sion.
• EURECOM’s Kinect face data set (Min et al.,
2014): We chose this data set because it contains
both, ICAO-compliant reference face images and
face images that are occluded but otherwise of
high quality. It includes face images of 52 sub-
jects (14 females, 38 males) obtained using a mul-
timodal Kinect device. Data was captured in two
sessions approximately half a month apart. Each
session included face images of each subject in
nine states: neutral facial expression, smile, open
mouth, left profile, right profile, eyes occluded by
sunglasses, mouth occluded by hand, half of the
face occluded by paper, and lights on.
4.2 Face Comparisons
To evaluate the effect of face occlusions on face com-
parison scores, we compared 2D face images from
EURECOM’s Kinect face data set (Min et al., 2014).
As reference images, we used 52 face images from the
first session that show a neutral facial expression. As
probe images, we used 208 mated face images from
the second session: unoccluded face images as well as
face images partially occluded by sunglasses, a hand
or a sheet of paper, all showing a neutral facial ex-
pression. All images were taken under the same, very
good capture conditions, only the occlusion varied.
For feature extraction, we used ArcFace (Deng
et al., 2019), an open-source deep-learning-based face
feature extraction algorithm implemented in Python.
This algorithm aims at obtaining highly discrimina-
tive face embeddings for automatic face recognition
by incorporating margins in the loss function. For
comparing two face feature vectors, we calculated
their cosine similarity as similarity score in the range
from -1 to 1 (the more similar, the higher). Cosine
similarity measures the similarity of the orientation
of two feature vectors regardless of their magnitude.
ArcFace is designed to give best results with cosine
similarity.
5 EXPERIMENTAL RESULTS
5.1 Images with Known Occlusion
The evaluation metrics for face images with known
occlusion are aligned with those used by NIST in
their evaluation of special image defect detection al-
gorithms (Yang et al., 2024). However, the test data
set is different because NIST uses a sequestered data
set.
The COFW baseline values for the percentage of
face occlusion are used to evaluate the validity of the
presented method for calculating the percentage of
occlusion. In Fig. 5, for each of the 507 images a
point is plotted. The x coordinate corresponds to the
baseline value considered to be the ground truth of
the percentage of face occlusion. The y coordinate
corresponds to the value estimated by the presented
method. The line y = x represents the optimal agree-
ment. The closer the estimated value is to the baseline
value, the closer the plotted point is to the line y = x.
While our method achieved a mean absolute error
of 3.91 percentage points, OFIQ achieved a mean ab-
solute error of 3.86 percentage points in the same data
set. For images with known occlusion, both OFIQ and
ICPRAM 2025 - 14th International Conference on Pattern Recognition Applications and Methods
660
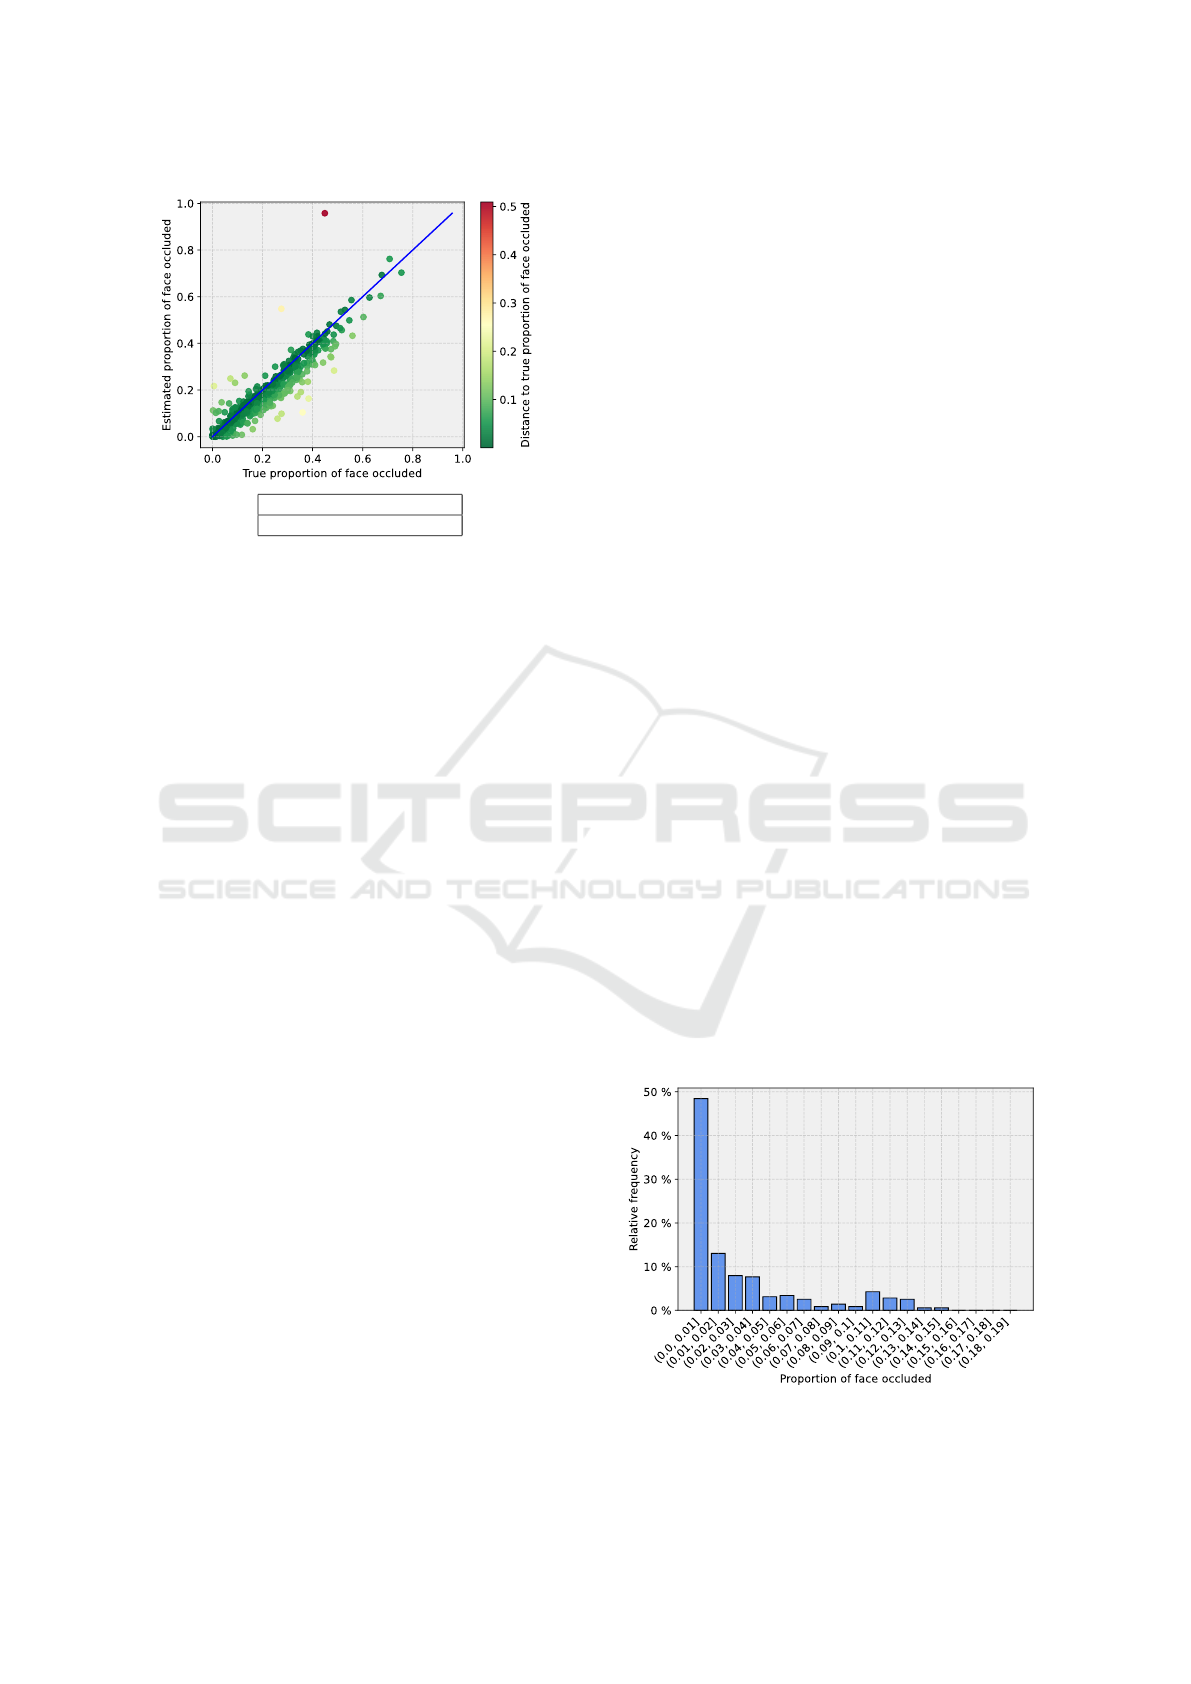
Mean absolute error
3.9066 percentage points
Figure 5: Estimated vs. baseline percentage of occlusion.
The blue line represents perfect agreement.
our method slightly underestimate the presence of oc-
clusion.
An earlier version of the proposed method using
another occlusion segmentation model (Nirkin et al.,
2018) has been submitted to NIST’s special image de-
fect detection evaluation, in the category of face oc-
clusion detection when the forehead is excluded. It
achieved the best results so far, along with the OFIQ
software, which achieved the same mean absolute er-
ror value. Switching to the occlusion segmentation
model face3d0725 (Yin and Chen, 2022) improved
the mean absolute error of our method in the COFW
data set by more than 3 percentage points.
5.2 Face Images Without Occlusion
To test how well the proposed method recognizes the
absence of occlusions, we selected face images com-
pliant to the requirements for passport photographs
(ICAO, 2018). This goes beyond NIST’s evaluation
(Yang et al., 2024) and helps setting a face occlu-
sion threshold for unoccluded face images (see Sec-
tion 5.5).
We selected 353 such images from the ONOT data
set. The selected images show the face frontally, well-
lit, and without any occlusion. Therefore, we ex-
pected the percentage of occlusion to be 0. However,
as discussed in Section 3.5, this is not always the case.
Figure 6 shows the histogram of the calculated values
for the 353 face images without occlusion. It can be
seen that in about 50 % of the images, an occlusion of
less than 1 % is calculated.
The mean absolute error of our method is just
above 2.85 percentage points. OFIQ achieved an
mean absolute error of 2.83 percentage points in the
same data set. The main source of error was the pres-
ence of eyeglasses, resulting in up to 14.6 % face oc-
clusion. The spike of error caused by the presence of
glasses is also observable in Fig. 6. Additionally, a
slight deviation from no occlusion is caused by hair
covering the eyebrows or the side of the face. This
is observable in Fig. 4, which shows an image of the
ONOT data set.
5.3 Face Images with Eyeglasses
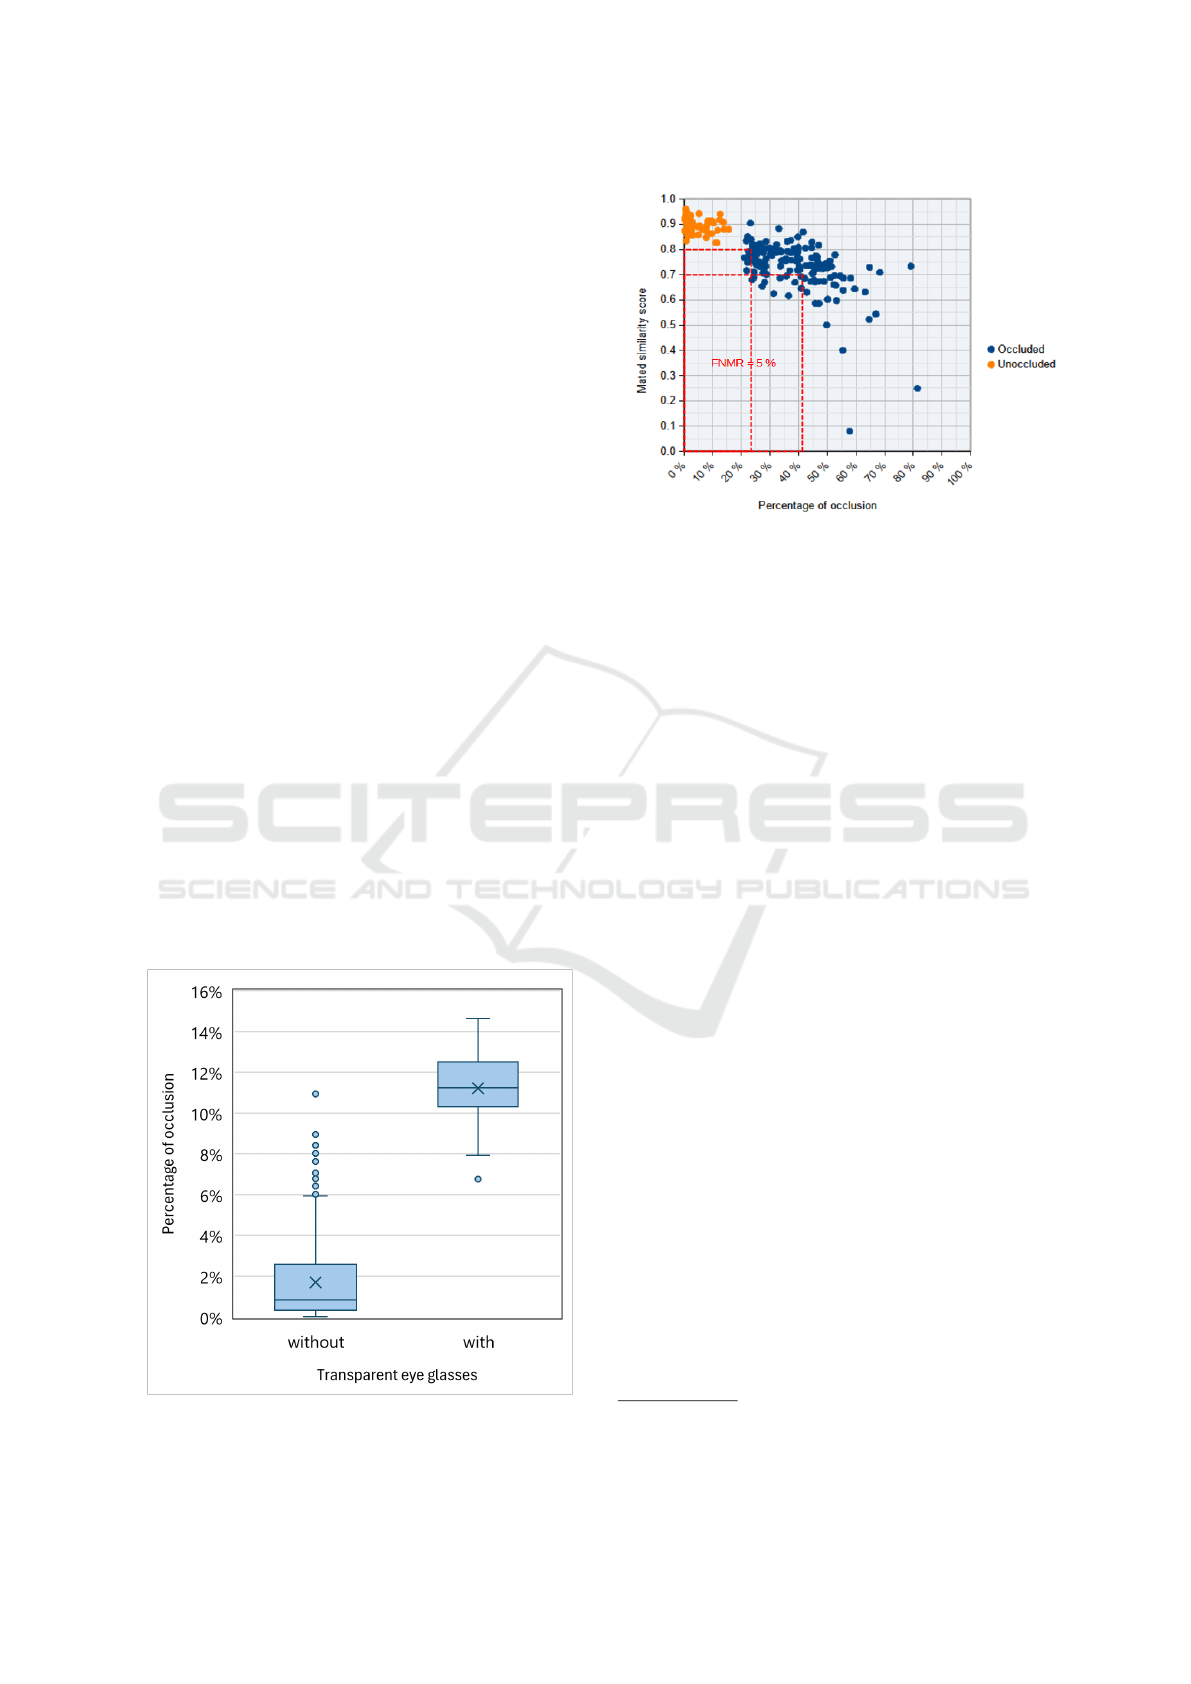
Figure 7 is a box and whisker plot showing the
distributions of the percentages of face occlusion
in the ONOT data set for 43 face images with
and 310 without transparent eyeglasses. A box is
drawn between the first and third quartiles with a
line in between marking the second quartile (median
value); crosses represent mean values. Whiskers are
drawn at the greatest/smallest percentage of occlusion
smaller/greater than 1,5 times the inter-quartile range
(between the first and third quartiles) above/below the
third/first quartile. Scores beyond the whiskers are
outliers. Figure 7 shows that the measured percentage
of face occlusion is considerably higher when eye-
glasses are worn.
At a 95 % confidence level, a two-sample t-test
shows that the difference between the mean values in
Fig. 7 is statistically significant. There is, however, no
statistically significant difference between the mean
values of the overall OFIQ quality scores for wearers
of eyeglasses and for people who do not wear glasses.
5.4 Comparison with OFIQ
When using face images with known occlusion and
when using face images without occlusion, a simi-
lar behaviour of OFIQ and the presented method was
observed. We had expected differently. Both meth-
ods utilize the same occlusion segmentation model
Figure 6: Histogram of percentages of occlusion measured
in unoccluded face images.
Occlusion Detection for Face Image Quality Assessment
661
face3d0725 (Yin and Chen, 2022), but OFIQ, as ref-
erence implementation of the draft standard (ISO/IEC
FDIS 29794-5, 2024), uses the OpenCV function con-
vexHull when calculating the landmarked region. The
similar behaviour of OFIQ and the presented method
leads us to suspect that the OpenCV function convex-
Hull does not return the convex hull in mathematical
terms but the contour around the landmarks. OFIQ
behaves as if the landmarked region is based on the
possibly concave polygon along the face contour.
5.5 Face Occlusion Thresholds
How much face occlusion is admissible depends on
the use case. The emerging standard (ISO/IEC FDIS
29794-5, 2024) considers three use cases:
1. Acquisition of reference face images for machine
readable travel documents (MRTDs),
2. Acquisition of reference face images for other
systems (e.g., entry/exit system),
3. Acquisition of probe face images for instanta-
neous recognition.
For use case 1 concerning passport photographs,
ICAO prohibits face occlusions except in specific
exceptional cases (ICAO, 2018). For use case 2
concerning system enrolment, weaker requirements
(ISO/IEC 19794-5, 2011) apply (European Commis-
sion, 2019), but occlusions are not permitted either.
Both documents (ICAO, 2018; ISO/IEC 19794-5,
2011) allow subjects to wear eyeglasses with trans-
parent lenses not occluding the eyes. That is why we
count face images with transparent eyeglasses in the
Figure 7: Percentage of occlusion for unoccluded face im-
ages with and without transparent eyeglasses.
Figure 8: Mated similarity score vs. percentage of occlusion
scatterplot.
unoccluded category. Given the fact that some occlu-
sion may be measured even in unoccluded face im-
ages (see Fig. 6) and to avoid bias against wearers of
eyeglasses, a discard threshold of about 15 % mea-
sured face occlusion should be chosen.
For use case 3 concerning probe images for in-
stantaneous recognition, the question arises as to how
much occlusion would be permissible without ex-
ceeding a given FNMR target. Figure 8 shows the re-
lationship between the percentage of occlusion of the
probe images from the Kinect face data set and their
mated similarity scores. Percentage of occlusion and
mated similarity score appear to be negatively cor-
related. The orange data points in Fig. 8 also show
that occlusions caused by transparent eyeglasses have
no noticeable negative effect on the mated similarity
scores of face images that are otherwise of high qual-
ity. In the given data set, in general, the sunglasses
cause less occlusion than a hand or a sheet of paper
partially occluding the face.
The maximum permissible percentage of face
occlusion for the probe images depends on the
application-specific decision threshold. For instance,
let the target FNMR be 5 % or less
1
and the decision
threshold be a similarity score value of 0.8 in Fig. 8,
then frontal probe images with a percentage of face
occlusion of 23.85 % or more should be discarded and
recaptured to be able to meet the target FNMR. If the
decision threshold is more relaxed, e.g., at a similar-
ity score value of 0.7, then face images would need
to be discarded and recaptured only if the percentage
of occlusion exceeds 40.9 %. The lower the required
similarity, the higher the admissible percentage of oc-
clusion.
Be aware that the error rates of a specific biomet-
1
Best practice guideline for automated border control is
an FRR of at most 5 % at an FAR of 0.1 % (Frontex, 2015).
ICPRAM 2025 - 14th International Conference on Pattern Recognition Applications and Methods
662

ric system depend on its input data and that the choice
of thresholds depends on the costs of false accepts and
false rejects. To set operational thresholds, the exper-
iment should be run with commercial face compari-
son algorithms and more, operational face image data.
Real-world probe images differ not only in terms of
face occlusion but may exhibit other irregularities at
the same time.
6 CONCLUSIONS
Drawing on state-of-the-art face landmark estimation
and face segmentation methods, a C++ implementa-
tion to determine the percentage of face occlusion was
developed. When forming the landmarked region, a
concave polygon along the face contour landmarks is
used instead of the convex hull proposed in (ISO/IEC
FDIS 29794-5, 2024). For faces showing other than
frontal or near-frontal poses, a convex hull of the land-
marks incorrectly includes parts of the background.
The proposed method is applicable to any image on
which a face can be detected, not only to frontal or
near-frontal face images. The experiments in Sec-
tion 5 show that the presented method and OFIQ
achieve very similar results. This suggests that OFIQ
does not use the convex hull in mathematical terms
either but the possibly concave polygon bounded by
the face contour.
Both, the presented method and OFIQ, use the
same face segmentation model, which counts the
frame of transparent eyeglasses as occlusion. To
avoid bias against the demographic group of wearers
of glasses, a discard threshold of almost 20 % mea-
sured face occlusion should be chosen. As this allows
unwanted face occlusions to be ignored, it may be bet-
ter to retrain the occlusion segmentation model not to
count transparent eyeglasses as occlusions.
Some issues in the underlying face landmark es-
timation and face segmentation software have been
identified in Section 3.5. Because of the observable
continuous improvement of such algorithms (Merkle
et al., 2022), it can be expected that these issues will
be alleviated over time.
The proposed approach can be extended to other
face image quality components defined in the emerg-
ing standard (ISO/IEC FDIS 29794-5, 2024): The
measurement of overexposure and underexposure can
be restricted to the unoccluded landmarked region,
and the face segmentation map can be used to check
for the visibility of the eyes and the presence of sun-
glasses and to determine the percentage of mouth oc-
clusion. Satisfactory results were also achieved in
NIST’s evaluation for these quality components.
ACKNOWLEDGEMENTS
This research work has been funded by the German
Federal Ministry of Education and Research and the
Hessian Ministry of Higher Education, Research, Sci-
ence and the Arts within their joint support of the
National Research Center for Applied Cybersecurity
ATHENE.
REFERENCES
Burgos-Artizzu, X., Perona, P., and Dollar, P. (2022). Cal-
tech occluded faces in the wild (COFW). https://doi.
org/10.22002/D1.20099.
Deng, J., Guo, J., Xue, N., and Zafeiriou, S. (2019). Ar-
cFace: Additive angular margin loss for deep face
recognition. In IEEE Conf. on Computer Vision and
Pattern Recognition (CVPR).
Di Domenico, N., Borghi, G., Franco, A., Maltoni, D., et al.
(2024). ONOT: a high-quality ICAO-compliant syn-
thetic mugshot dataset. In 18
th
IEEE International
Conference on Automatic Face and Gesture Recogni-
tion (FG).
European Commission (2019). Commission Implementing
Decision (EU) 2019/329 of 25 February 2019 laying
down the specifications for the quality, resolution and
use of fingerprints and facial image for biometric ver-
ification and identification in the Entry/Exit System
(EES).
Frontex (2015). Best practice technical guidelines for auto-
mated border control (ABC) systems. Frontex Tech-
nical Report.
Ghiasi, G. and Fowlkes, C. (2015). Occlusion coherence:
Detecting and localizing occluded faces. https://doi.
org/10.48550/arXiv.1506.08347.
hpc203 (2024). hpc203/yolov8-face-landmarks-
opencv-dnn. https://github.com/hpc203/
yolov8-face-landmarks-opencv-dnn.
ICAO (2018). Portrait quality (reference facial im-
ages for MRTD). ICAO Technical Report.
https://www.icao.int/Security/FAL/TRIP/Documents/
TR-PortraitQualityv1.0.pdf.
ISO/IEC 19794-5 (2011). Information technology – Bio-
metric data interchange formats – Part 5: Face image
data. International Standard ISO/IEC 19794-5.
ISO/IEC 29794-1 (2024). Information technology – Bio-
metric sample quality – Part 1: Framework. Interna-
tional Standard ISO/IEC 29794-1.
ISO/IEC 29794-4 (2024). Information technology – Bio-
metric sample quality – Part 4: Finger image data. In-
ternational Standard ISO/IEC 29794-4.
ISO/IEC FDIS 29794-5 (2024). Information technology
– Biometric sample quality – Part 5: Face image
data. Final Draft International Standard ISO/IEC
FDIS 29794-5.
Lz (2023). 610265158/peppa pig face landmark: new base
line. https://doi.org/10.5281/zenodo.7894492.
Occlusion Detection for Face Image Quality Assessment
663

Merkle, J., Rathgeb, C., Herdeanu, B., Tams, B., Lou, D.-
P., D
¨
orsch, A., Schaubert, M., Dehen, J., Chen, L.,
Yin, X., Huang, D., Stratmann, A., Ginzler, M., Grim-
mer, M., and Busch, C. (2024). Open Source Facial
Image Quality (OFIQ) – Implementation and eval-
uation of algorithms. https://github.com/BSI-OFIQ/
OFIQ-Project/tree/main/doc/reports.
Merkle, J., Rathgeb, C., Tams, B., Lou, D.-P., D
¨
orsch, A.,
and Drozdowski, P. (2022). State of the art of quality
assessment of facial images. https://doi.org/10.48550/
arXiv.2211.08030.
Min, R., Kose, N., and Dugelay, J.-L. (2014). Kinect-
FaceDB: A kinect database for face recognition. IEEE
Trans. on Systems, Man, and Cybernetics: Systems,
44(11):1534–1548.
Nirkin, Y., Masi, I., Tuan, A., Hassner, T., and Medioni,
G. (2018). On face segmentation, face swapping, and
face perception. In 13
th
IEEE Int. Conf. on Automatic
Face & Gesture Recognition (FG), pages 98–105.
Redmon, J., Divvala, S., Girshick, R., and Farhadi, A.
(2016). You Only Look Once: Unified, Real-Time
Object Detection. In Proceedings of the IEEE Con-
ference on Computer Vision and Pattern Recognition,
pages 779–788.
Tabassi, E., Olsen, M., Bausinger, O., Busch, C., Figlarz,
A., Fiumara, G., Henniger, O., Merkle, J., Ruhland,
T., Schiel, C., and Schwaiger, M. (2021). NFIQ 2.0 –
NIST fingerprint image quality. NIST IR 8382, NIST.
Yang, J., Grother, P., Ngan, M., Hanaoka, K., and Hom, A.
(2024). Face analysis technology evaluation (FATE) –
Part 11: Face image quality vector assessment: Spe-
cific image defect detection. NIST IR 8485, NIST.
Yin, X. and Chen, L. (2022). FaceOcc: A diverse, high-
quality face occlusion dataset for human face extrac-
tion. In Treatment and Analysis of the Information
Methods and Applications (TAIMA).
ICPRAM 2025 - 14th International Conference on Pattern Recognition Applications and Methods
664
