
MuSt-NeRF: A Multi-Stage NeRF Pipeline to Enhance Novel View
Synthesis
Sudarshan Raghavan Iyengar
a
, Subash Sharma
b
and Patrick Vandewalle
c
EAVISE, ESAT-PSI, KU Leuven, Belgium
{sudarshan.iyengar, patrick.vandewalle}@kuleuven.be
Keywords:
Neural Radiance Fields, Novel-View Synthesis, 3D Reconstruction, Depth Priors, View-Dependent Effects.
Abstract:
Neural Radiance Fields (NeRFs) have emerged as a powerful technique for novel view synthesis, but ac-
curately capturing both intricate geometry and complex view-dependent effects, especially in challenging
real-world scenes, remains a limitation of existing methods. This work presents MuSt-NeRF, a novel multi-
stage pipeline designed to enhance the fidelity and robustness of NeRF-based reconstructions. The approach
strategically chains complementary NeRF architectures, organized into two stages: a depth-guided stage that
establishes a robust geometric foundation, followed by a refinement stage that enhances details and accu-
rately renders view-dependent effects. Crucially, MuSt-NeRF allows flexible stage ordering, enabling either
geometry-first or photometry-first reconstruction based on scene characteristics and desired outcomes. Exper-
iments on diverse datasets, including synthetic scenes and complex indoor environments from the ScanNet
dataset, demonstrate that MuSt-NeRF consistently outperforms single-stage NeRF and 3D Gaussian Splat-
ting methods, achieving higher scores on established metrics like PSNR, SSIM, and LPIPS, while producing
visually superior reconstructions. MuSt-NeRF’s flexibility and robust performance make it a promising ap-
proach for high-fidelity novel view synthesis in complex, real-world scenes. The code is made available at
https://github.com/sudarshan-iyengar/MuSt-NeRF.
1 INTRODUCTION
Reconstructing 3D scenes from a set of images and
synthesizing photorealistic novel views is a long-
standing challenge in computer vision, with applica-
tions in virtual/augmented reality, robotics, and med-
ical imaging (Manni et al., 2021; Lee et al., 2022;
Yang et al., 2024).
Neural Radiance Fields (NeRFs) (Mildenhall
et al., 2020) have significantly advanced novel view
synthesis by representing scenes using a multi-layer
perceptron (MLP) that maps 3D locations and view-
ing directions to color and density, enabling the ren-
dering of photorealistic novel views via differentiable
volume rendering.
Despite advancements, NeRFs unfortunately suf-
fer from several drawbacks. Reconstructing accurate
geometry from sparse views can lead to artifacts like
fogginess and floaters, as traditional NeRF training
primarily relies on photometric consistency, which is
a
https://orcid.org/0009-0003-4046-4969
b
https://orcid.org/0009-0004-1025-460X
c
https://orcid.org/0000-0002-7106-8024
insufficient to disambiguate between different geome-
tries yielding the same image. Furthermore, repre-
senting glossy surfaces and specular reflections ac-
curately is difficult due to the high degree of varia-
tion in appearance even with small changes in view-
point. Existing methods (Wei et al., 2021; Shafiei
et al., 2021; Tancik et al., 2022; Barron et al., 2021;
Martin-Brualla et al., 2021) often address these chal-
lenges individually, creating a need for more holistic
solutions.
To address these limitations, we introduce MuSt-
NeRF, a multi-stage NeRF pipeline that combines
the strengths of complementary NeRF architectures
within a flexible, multi-stage framework. By combin-
ing a depth-guided geometric foundation stage with a
photometric refinement stage, MuSt-NeRF achieves
robust performance even with sparse inputs while
capturing high-fidelity reflections and handling un-
bounded scenes. This two-stage approach, with its
adaptable geometry-first and photometry-first work-
flows, allows for optimized performance based on
scene characteristics. Our key contributions through
this paper are threefold:
1. A novel two-stage NeRF architecture capable of
Iyengar, S. R., Sharma, S. and Vandewalle, P.
MuSt-NeRF: A Multi-Stage NeRF Pipeline to Enhance Novel View Synthesis.
DOI: 10.5220/0013169100003912
Paper published under CC license (CC BY-NC-ND 4.0)
In Proceedings of the 20th International Joint Conference on Computer Vision, Imaging and Computer Graphics Theory and Applications (VISIGRAPP 2025) - Volume 2: VISAPP, pages
563-573
ISBN: 978-989-758-728-3; ISSN: 2184-4321
Proceedings Copyright © 2025 by SCITEPRESS – Science and Technology Publications, Lda.
563

handling various scene types, including those with
unbounded elements, complex lighting, and a mix
of diffuse and specular materials.
2. A flexible pipeline design that supports both
geometry-first and photometry-first execution,
adapting to varying scene characteristics.
3. A new composite score metric that com-
bines PSNR, SSIM, and LPIPS to provide a
perceptually-aligned evaluation of rendering qual-
ity. This composite score is used to refine regions
of the scene requiring additional photometric or
geometric detail.
2 RELATED WORK
2.1 Neural Radiance Fields
Neural Radiance Fields use neural networks to rep-
resent a 3D scene as a continuous function. This
function, parameterized by a multi-layer perceptron
(MLP), takes as input the 3D location x = (x, y, z)
and 2D viewing direction (θ, φ) and outputs the radi-
ance c = (R, G, B) and volume density σ at that point
and viewing direction (Mildenhall et al., 2020). The
NeRF MLP learns to map 5D input coordinates to
the corresponding radiance and volume density val-
ues. This can be represented as follows:
F
Θ
: (x, d) → (c, σ) (1)
More precisely, positional encoding is applied at
the input to the MLP to be able to represent high fre-
quency details more accurately by mapping the inputs
to higher degree Fourier features. However, this is
omitted from the equation for simplicity.
To render a novel view, NeRF casts a ray r(t) =
o + td (where o is the camera origin, d is the ray di-
rection, and t is the distance along the ray) through
each pixel into the scene. The color c(r) and volume
density σ(r) are then computed at 3D points r sam-
pled along each ray. These sampled values are inte-
grated within the near and far bounds [t
n
,t
f
] using the
volume rendering equations:
T (t) = e
−
R
t
t
n
σ(r(s))ds
(2)
C(r) =
Z
t
f
t
n
T (t) · σ(r(t)) · c(r(t), d)dt (3)
In practice, the integral is computed in its dis-
cretized form using stratified and hierarchical sam-
pling.
This rendering process, while capable of generat-
ing high-quality images, presents several limitations.
Specifically, NeRF requires a large number of input
views for accurate reconstructions, struggles with un-
bounded scenes, and can exhibit difficulties capturing
view-dependent effects, particularly specular reflec-
tions.
2.2 Enhancing NeRF - Addressing Its
Core Limitations
Several extensions to the original NeRF model have
been proposed to address these limitations (Rabby
and Zhang, 2023; Gao et al., 2023; Dellaert and Yen-
Chen, 2021). A key aspect for improving geometric
robustness and enabling training with sparse views is
the incorporation of depth information. Dense Depth
Priors NeRF (Roessle et al., 2022) leverages read-
ily available depth information from Structure-from-
Motion (SfM) pipelines, using a depth completion
network based on ResNet-18 to generate dense depth
and uncertainty maps from sparse point clouds. These
maps then guide ray sampling during training and are
incorporated into a depth loss term, improving geo-
metric accuracy and reducing reliance on dense input
views. MuSt-NeRF employs a similar depth-guided
strategy in its initial stage to build a strong geomet-
ric foundation, which is the goal of the first stage of
MuSt-NeRF.
Handling unbounded scenes is another significant
challenge as it implies that content in the scene can
lie at arbitrarily far distances (theoretically tending to
infinity). The key challenges in applying NeRF-like
models to unbounded scenes are finding an effective
way to parameterize the 3D space and finding effi-
cient ray sampling strategies. Mip-NeRF 360 (Bar-
ron et al., 2022) addresses these in two ways: Firstly,
they introduce a non-linear scene parameterization
that maps 3D coordinates onto a bounded sphere, con-
tracting objects that are farther away towards the cen-
ter, leaving the objects closer and near the center rela-
tively unchanged. Secondly, rather than a single MLP
being trained, MipNeRF-360 uses two MLPs: a Pro-
posal MLP which predicts solely volume density, and
a NeRF MLP which predicts both volume density and
radiance. The Proposal MLP is a smaller and faster
MLP that is evaluated multiple times in order to gen-
erate a coarse representation of the scene’s density
distribution and is then used to guide the NeRF MLP’s
sampling process by informing it of the regions that
are likely to contain surfaces. MuSt-NeRF incorpo-
rates these strategies within its photometric refine-
ment stage, enabling the representation of unbounded
scenes. However, unlike Mip-NeRF 360, MuSt-NeRF
VISAPP 2025 - 20th International Conference on Computer Vision Theory and Applications
564

also explicitly addresses view-dependent effects, fur-
ther enhancing realism.
View-dependent effects, particularly specular and
glossy reflections, significantly impact the realism of
novel views. Ref-NeRF (Verbin et al., 2021) tackles
this challenge by explicitly modeling reflected radi-
ance using a combination of viewing directions and
surface normals. It utilizes an Integrated Directional
Encoder (IDE) to capture a distribution of reflection
directions and disentangles diffuse and specular com-
ponents. While Ref-NeRF demonstrates improve-
ments in reflection rendering, it can still be computa-
tionally demanding, particularly when combined with
techniques for unbounded scenes. MuSt-NeRF in-
tegrates the reflection modeling capabilities of Ref-
NeRF into its refinement stage. Crucially, by building
on the geometrically robust foundation established in
the initial stage, MuSt-NeRF mitigates the computa-
tional burden and data requirements typically associ-
ated with high-fidelity reflection rendering. This com-
bination enables efficient and realistic novel view syn-
thesis even with sparse views and complex lighting.
3 METHOD
Our goal is to synthesize photorealistic novel views
of a real-world scene given N input images and their
corresponding camera poses, obtained via COLMAP
(Sch
¨
onberger and Frahm, 2016). MuSt-NeRF
achieves this through two chained NeRF stages, in-
tegrating the strengths of recent NeRF advancements.
A depth-guided initial stage builds a strong geomet-
ric foundation, which is then refined by a photomet-
ric refinement stage. This two-stage approach, with
flexible stage ordering (geometry-first or photometry-
first), enhances the quality of novel view synthesis.
3.1 Stage 1: Geometric Foundation
This stage focuses on establishing a robust geometric
representation of the scene, even from a sparse set of
input images. For this, we leverage depth information
to guide the NeRF optimization.
First, we obtain camera poses and construct a
sparse point cloud using SfM via COLMAP. In the
absence of ground truth depth maps, we utilize the
sparse point cloud generated by COLMAP and em-
ploy a ResNet18-based depth completion network
(Roessle et al., 2022) to generate dense depth maps
z(r) and corresponding uncertainty maps s(r). The
depth maps guide ray sampling during training, con-
centrating samples in regions with higher object like-
lihood, as indicated by the depth map and uncertainty
estimate. This depth-guided sampling enhances geo-
metric accuracy, especially with sparse view inputs.
The Stage 1 NeRF MLP is trained using a com-
bination of loss functions designed to leverage both
photometric information from the RGB images and
geometric constraints from the dense depth maps.
The total loss function is proposed as a weighted lin-
ear combination of the color and depth losses, where
λ is a hyperparameter that can be tuned to determine
the weight given to the depth loss:
L = L
color
(r) + λ · L
depth
(r) (4)
L
color
=
ˆ
C(r) −C(r)
2
2
(5)
L
depth
=
(
log
ˆs(r)
2
+
(ˆz(r)−z(r))
2
ˆs(r)
2
if α
0 otherwise
(6)
where α =
|
ˆz(r) − z(r)
|
> s(r) ∨ ˆs(r) > s(r).
L
color
is a standard loss based on the difference
between the rendered and ground truth RGB colors.
L
depth
uses the Gaussian Negative Log-Likelihood
(GNLL) loss to penalize the model in the following
conditions: if the predicted depth ˆz(r) differs from
the target depth z(r) by more than the target’s uncer-
tainty/standard deviation s(r), or if the predicted un-
certainty ˆs(r) exceeds s(r). In such cases, the GNLL
loss is used; otherwise, the loss is zero.
We evaluate the rendered test views using a com-
posite score (range 0-1) based on three metrics,
PSNR, SSIM, and LPIPS:
C = w
PSNR
·
PSNR
PSNR
max
+ w
SSIM
· SSIM
+ w
LPIPS
· (1 − LPIPS) (7)
Test images with a composite score below a
threshold (see Section 4.1), along with their neighbor-
ing views, are passed to Stage 2 for refinement. This
selection strategy ensures that challenging regions, in-
cluding those near poorly reconstructed areas, receive
additional attention in the refinement stage. The ar-
chitecture can be seen in Figure 1.
3.2 Stage 2: Photometric Refinement
Building upon the geometric foundation established
in Stage 1, this stage refines the scene representa-
tion by focusing on high-fidelity rendering of view-
dependent effects, particularly specular reflections,
MuSt-NeRF: A Multi-Stage NeRF Pipeline to Enhance Novel View Synthesis
565
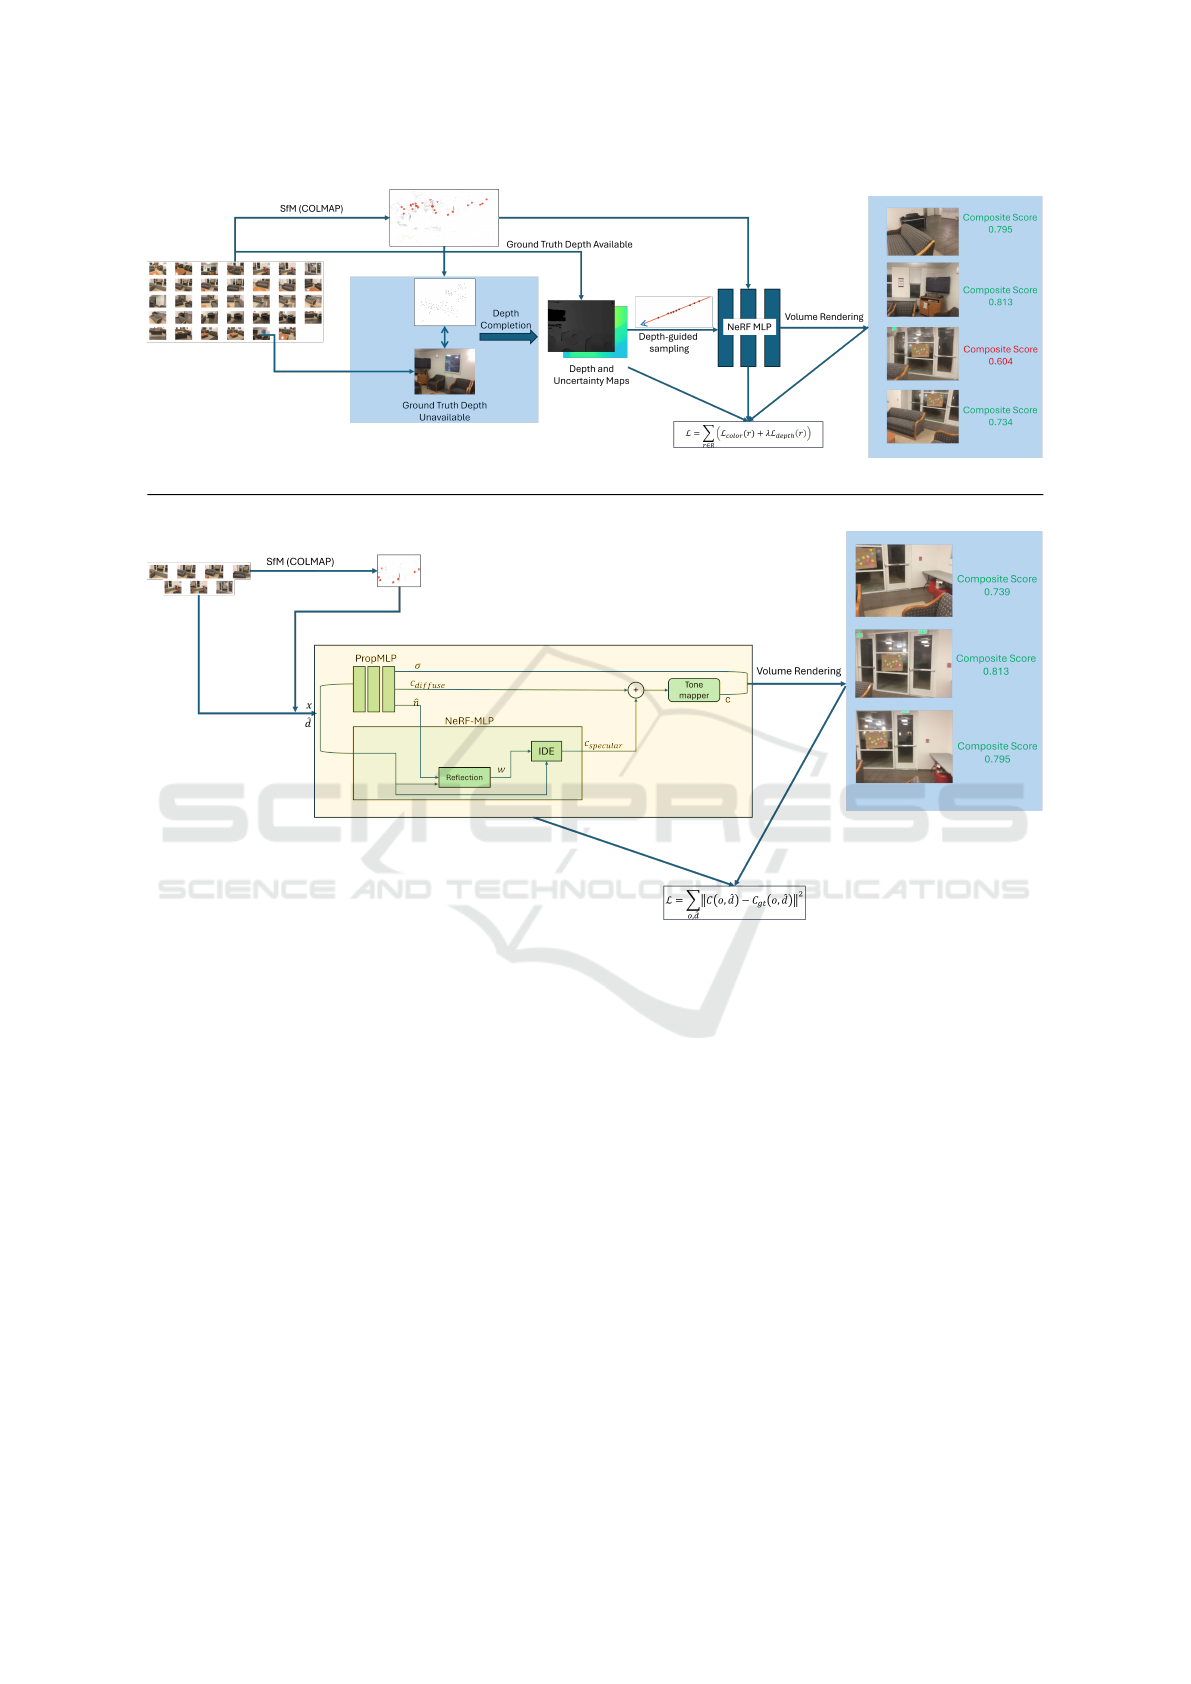
Figure 1: The proposed MuSt-NeRF architecture with Stage 1 on top and Stage 2 below. Stage 1 performs a depth-guided
reconstruction using either available ground truth depth maps or depth-completed maps from COLMAP sparse point clouds.
Stage 2 performs a photometric-driven reconstruction with a focus on unbounded elements and view-dependent effects.
and handling unbounded scenes. We achieve this by
integrating and extending the principles of Mip-NeRF
360 (Barron et al., 2022) and Ref-NeRF (Verbin et al.,
2021).
To effectively handle unbounded scenes, we incor-
porate core elements of Mip-NeRF 360. Specifically,
we use a non-linear scene parameterization, which
maps scene coordinates onto a unit sphere. This pa-
rameterization improves the representation of distant
objects by contracting them towards the origin while
preserving the relative positions of nearby points. We
also employ online distillation by splitting the MLP
into a proposal MLP and a NeRF MLP. The proposal
MLP’s density predictions guide the hierarchical sam-
pling of the NeRF MLP, i.e., more samples are taken
in regions where the proposal MLP predicts higher
volume density. This concentrates rendering effort
on regions likely to contain surfaces, improving ef-
ficiency, especially in unbounded scenes.
The NeRF MLP, however, also incorporates key
elements to more faithfully represent specular reflec-
tions. In addition to the view direction, which tra-
ditional NeRF models use, we incorporate predicted
surface normals
ˆ
n to the NeRF MLP. The combina-
tion of surface normals and view direction enables the
explicit modeling of reflected radiance, which is piv-
otal in obtaining realistic specular reflections. This
is achieved by using an Integrated Directional En-
coder (Verbin et al., 2021). This encodes a distri-
bution of reflection directions, accounting for surface
roughness, allowing the model to effectively represent
a wide range of material properties, from diffuse to
highly specular. The IDE processes
ˆ
n, x and d, out-
putting a specular color c
s
. The specular color from
the IDE is then combined with the diffuse color from
the proposal MLP using a weighted linear combina-
tion, which acts as a tone mapper, to get the final color
ˆ
c.
VISAPP 2025 - 20th International Conference on Computer Vision Theory and Applications
566
The Stage 2 architecture, comprising the proposal
and NeRF MLPs described above, is trained using a
photometric loss:
L
color
=
ˆ
C(r) −C(r)
2
2
. (8)
We also include a regularizer on normals, as done
in Ref-NeRF, that penalizes normals oriented away
from the camera for samples along the ray that con-
tribute to the final color. This regularizer term en-
forces volume density to concentrate around surfaces,
helping to resolve “foggy” artifacts often seen near
reflective surfaces in NeRF outputs.
3.3 Integrating Multi-Stage Outputs
MuSt-NeRF combines the outputs of its two stages
to generate the final novel view renderings, includ-
ing a dynamic walkthrough. Due to coordinate sys-
tems varying between the stages, we present a method
to align the two, to ensure proper integration of the
stages.
Walkthrough Generation. We generate walk-
throughs by rendering novel views along smooth cam-
era trajectories created using B-spline interpolation.
Key images from the input set define the desired path,
and intermediate poses are generated via B-spline in-
terpolation between these key images. Finally, we
render novel views from each of these interpolated
poses, creating a sequence of images that forms the
walkthrough. We empirically observed that a B-spline
of degree 1 with 5 to 10 interpolated poses between
each pair of key images provides a balance between
fine-grained control and efficient computation.
Coordinate System Alignment. After generating a
walkthrough with Stage 1 poses, some novel views,
particularly those spatially close to regions requiring
refinement, may still exhibit artifacts. To address this,
we then re-render these views using the trained Stage
2 model.
Since Stage 1 and Stage 2 use different subsets
of the original image set as input to COLMAP, their
respective coordinate systems are misaligned. There-
fore, to obtain an image from an identical pose, we
must first align the coordinate systems before render-
ing.
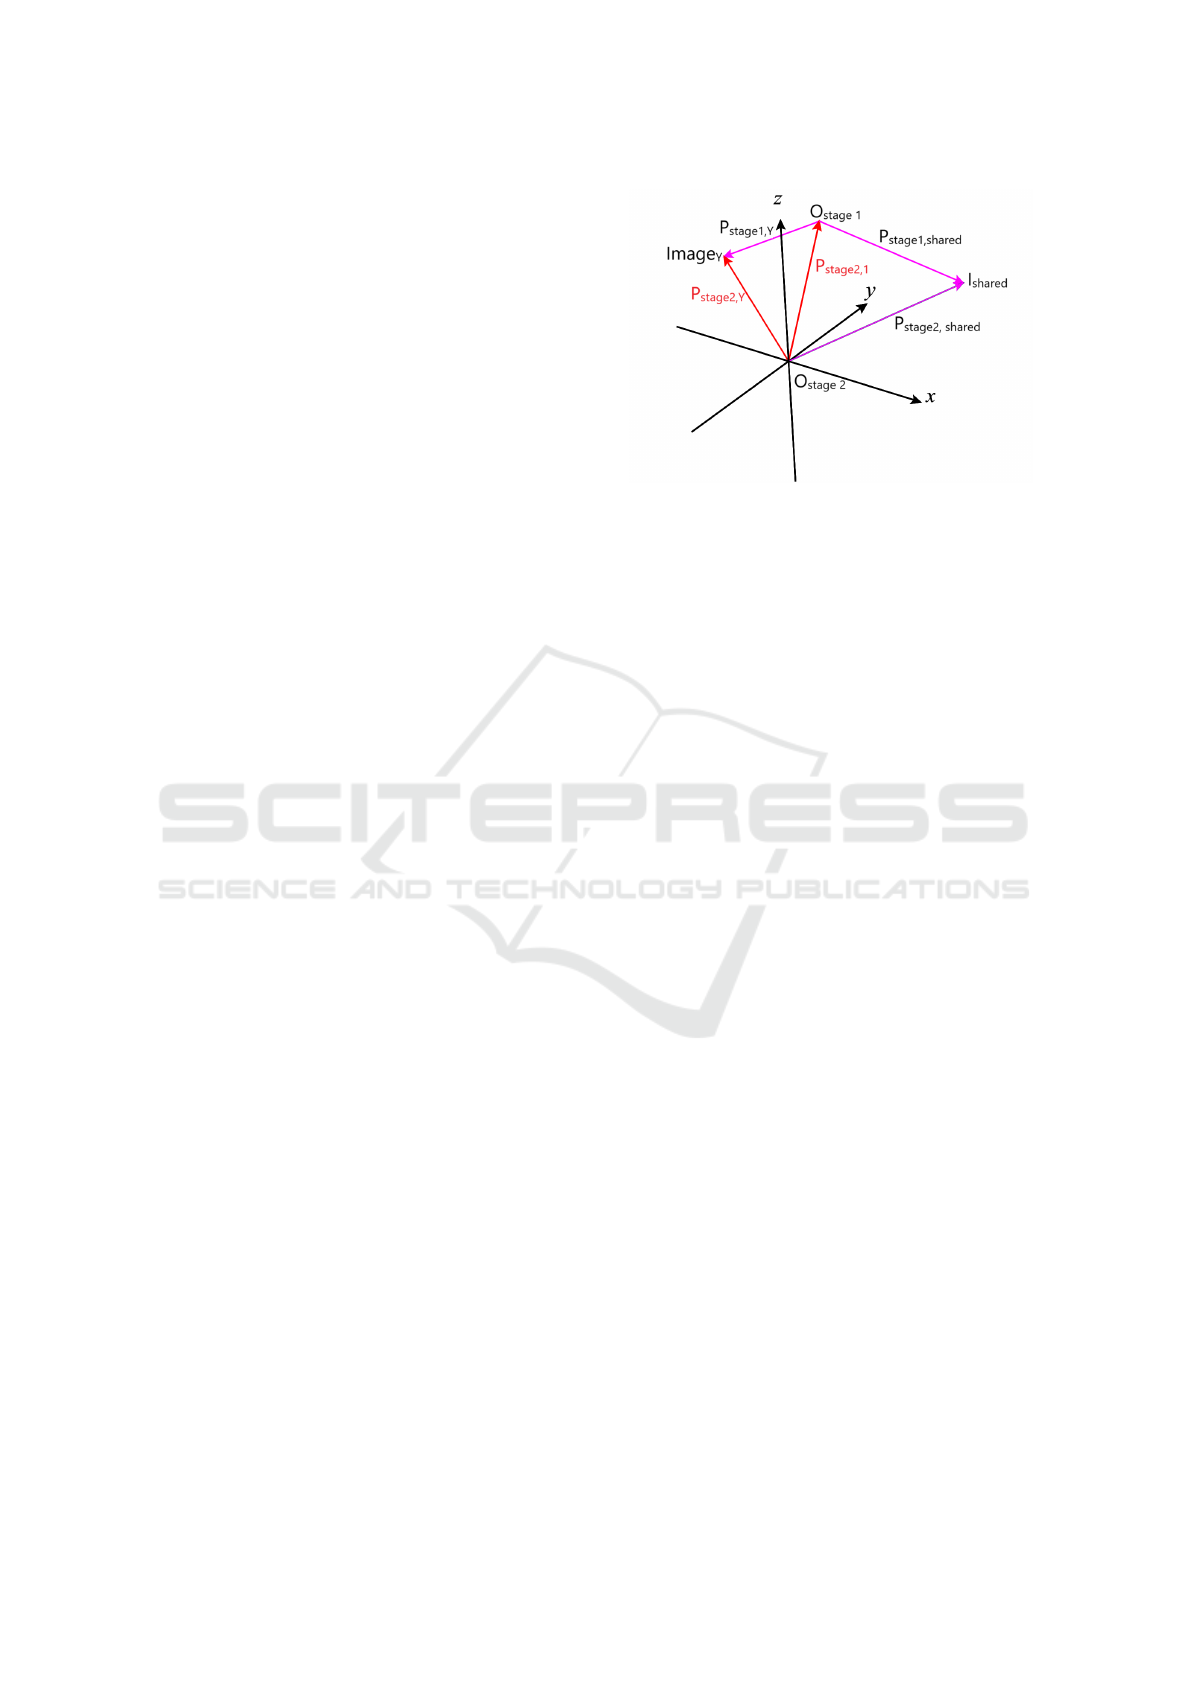
Our alignment method uses a shared image,
present in the input sets of both stages (I
shared
), as a
common reference. This image is typically chosen as
the test image from Stage 1 which did not meet the
quality threshold from the first stage.
Let P
stage1,shared
and P
stage2,shared
be the camera
poses of I
shared
in the Stage 1 and Stage 2 coordinate
systems, respectively. The transformation that aligns
Figure 2: Coordinate System Alignment. The diagram il-
lustrates the relationship between the Stage 1 and Stage 2
coordinate systems.
the Stage 1 coordinate system to the Stage 2 coordi-
nate system can be computed as:
P
stage2,1
= P
stage2,shared
· (P
stage1,shared
)
−1
(9)
This transformation is then used to map a novel
view pose P
stage1,Y
from the Stage 1 coordinate sys-
tem to its Stage 2 equivalent as follows:
P
stage2,Y
= P
stage2,1
· (P
stage1,Y
) (10)
3.4 Bi-Directionality of MuSt-NeRF
A key feature of MuSt-NeRF is its flexibility in ex-
ecution order. The pipeline can operate in either a
standard geometry-first or a reversed photometry-first
mode, adapting to different scene characteristics.
Standard Pipeline (Geometry-First). In this mode,
Stage 1 (Geometric Foundation) is executed first, fol-
lowed by Stage 2 (Photometric Refinement). This
approach prioritizes establishing a strong geometric
base before refining details and view-dependent ef-
fects. It is particularly well-suited for scenes where
accurate geometry is paramount, or when working
with sparse input views where a robust initial recon-
struction is essential. It also improves the rendering
of challenging lighting conditions since the geometry
is robust.
Reversed Pipeline (Photometry-First). In this
mode, Stage 2 (Photometric Refinement) precedes
Stage 1 (Geometric Foundation). This approach pri-
oritizes the accurate capture of lighting, reflections,
and view-dependent effects. The geometric inaccura-
cies or inconsistencies stemming from such an archi-
tecture can then be rectified through Stage 1. This is
beneficial for scenes where fine details and accurate
MuSt-NeRF: A Multi-Stage NeRF Pipeline to Enhance Novel View Synthesis
567

rendering of complex lighting are of primary impor-
tance, even at the potential cost of some initial geo-
metric inaccuracies that Stage 1 can often rectify.
The optimal choice between the standard and re-
versed pipelines depends on the specific scene prop-
erties and rendering priorities, as demonstrated in our
experiments.
4 EXPERIMENTS
4.1 Implementation Details
Experimental Configurations. To ensure meaning-
ful comparisons, the configurations for each experi-
ment were kept consistent. All experiments were per-
formed on a system equipped with an NVIDIA RTX
2080 Super GPU with 8 GB of VRAM. An overview
of the most important configurations can be found in
Table 1.
Evaluation Metrics. We evaluate the quality of
novel view renderings using three established metrics
commonly employed in the NeRF literature: PSNR,
SSIM, and LPIPS. In addition to these individual met-
rics, we also use a composite score, defined in Equa-
tion (7), with values for w
PSNR
, w
SSIM
, w
LPIPS
, and
PSNR
max
set to 0.20, 0.35, 0.45, and 35 dB, respec-
tively. These weights prioritize perceptually aligned
metrics (LPIPS and SSIM) over purely pixel-based
comparisons (PSNR), reflecting human visual percep-
tion of scene similarity. A threshold on this compos-
ite score is used to determine if an image from Stage
1 needs to be refined in Stage 2. This threshold was
experimentally set to 0.7, based on qualitative assess-
ment of rendered image quality: images with com-
posite scores below 0.7 exhibited noticeable artifacts
and were deemed unsatisfactory.
4.2 Results and Analysis
We evaluate MuSt-NeRF on increasingly complex
scenes. Preliminary experiments validate the ef-
fectiveness of our Stage 2 photometric refinement,
while also highlighting the need for a multi-stage
Table 1: Overview of the fundamental configurations used
in MuSt-NeRF experiments.
Parameter Stage 1 Stage 2
Number of Epochs 200k 400k
Batch size 1024 512
MLP layers 8 Prop, NeRF: 4,8
Neurons per layer 256 Prop, NeRF: 256,512
Image resolution (px) 624x468 624x468
approach. Subsequent experiments on challenging
ScanNet scenes then demonstrate the performance of
the full MuSt-NeRF pipeline, comparing the standard
and reversed configurations.
4.2.1 Preliminary Experiments
These experiments isolate and evaluate the Stage 2
architecture, demonstrating its ability to handle both
unbounded scenes and specular reflections, while also
motivating the need for a multi-stage approach. We
use the following datasets:
Mip-NeRF 360 (Materials, Vasedeck): The Ma-
terials scene features round balls of diverse material
properties under controlled lighting, enabling assess-
ment of specular reflection capture. The Vasedeck
scene is a real-world capture of flowers, primarily
exhibiting diffuse reflections, allowing us to evaluate
performance on real-world data with simpler lighting.
Custom Dataset (Plant on Table, Room): The
Plant on Table scene combines diffuse and specu-
lar reflections with unbounded elements (background
visible through glass). The Room scene (real-world,
smartphone, inside-out) provides a more challenging
test with complex geometry and lighting.
Table 2 presents the quantitative results of these
experiments, comparing MuSt-NeRF Stage 2 with
Mip-NeRF 360.
The preliminary experiments evaluate MuSt-
NeRF Stage 2 on increasingly complex outside-in
scenes. Beginning with the synthetic Materials scene,
we observe that MuSt-NeRF Stage 2 accurately ren-
ders specular highlights, achieving an average com-
posite score of over 0.9 (Table 2, Figure 3). Through
the Vasedeck scene, we see that MuSt-NeRF Stage 2
is able to handle real-world scenes, performing com-
parably to the Mip-NeRF 360 implementation. The
subsequent experiment on the Plant on Table scene
further confirms MuSt-NeRF Stage 2’s ability to han-
dle unbounded elements as well as specular and dif-
fuse reflections. It is important to note here that each
of the test images scored higher than the threshold of
0.7 in these three experiments.
Based on these results, we evaluate Stage 2 on
the Room scene, which is an inside-out scenario. We
observe that here too, MuSt-NeRF Stage 2 performs
better than Mip-NeRF 360 on average (Table 2), and
is able to capture reflections effectively (Figure 4).
However, we also observe some geometric inaccura-
cies, especially in regions with high depth variation
and with limited overlapping viewpoints between im-
ages. It is in these regions that the composite score
of MuSt-NeRF is lower than the threshold (Table 3).
These limitations, arising from Stage 2’s purely pho-
tometric nature, emphasize the need for a geometri-
VISAPP 2025 - 20th International Conference on Computer Vision Theory and Applications
568
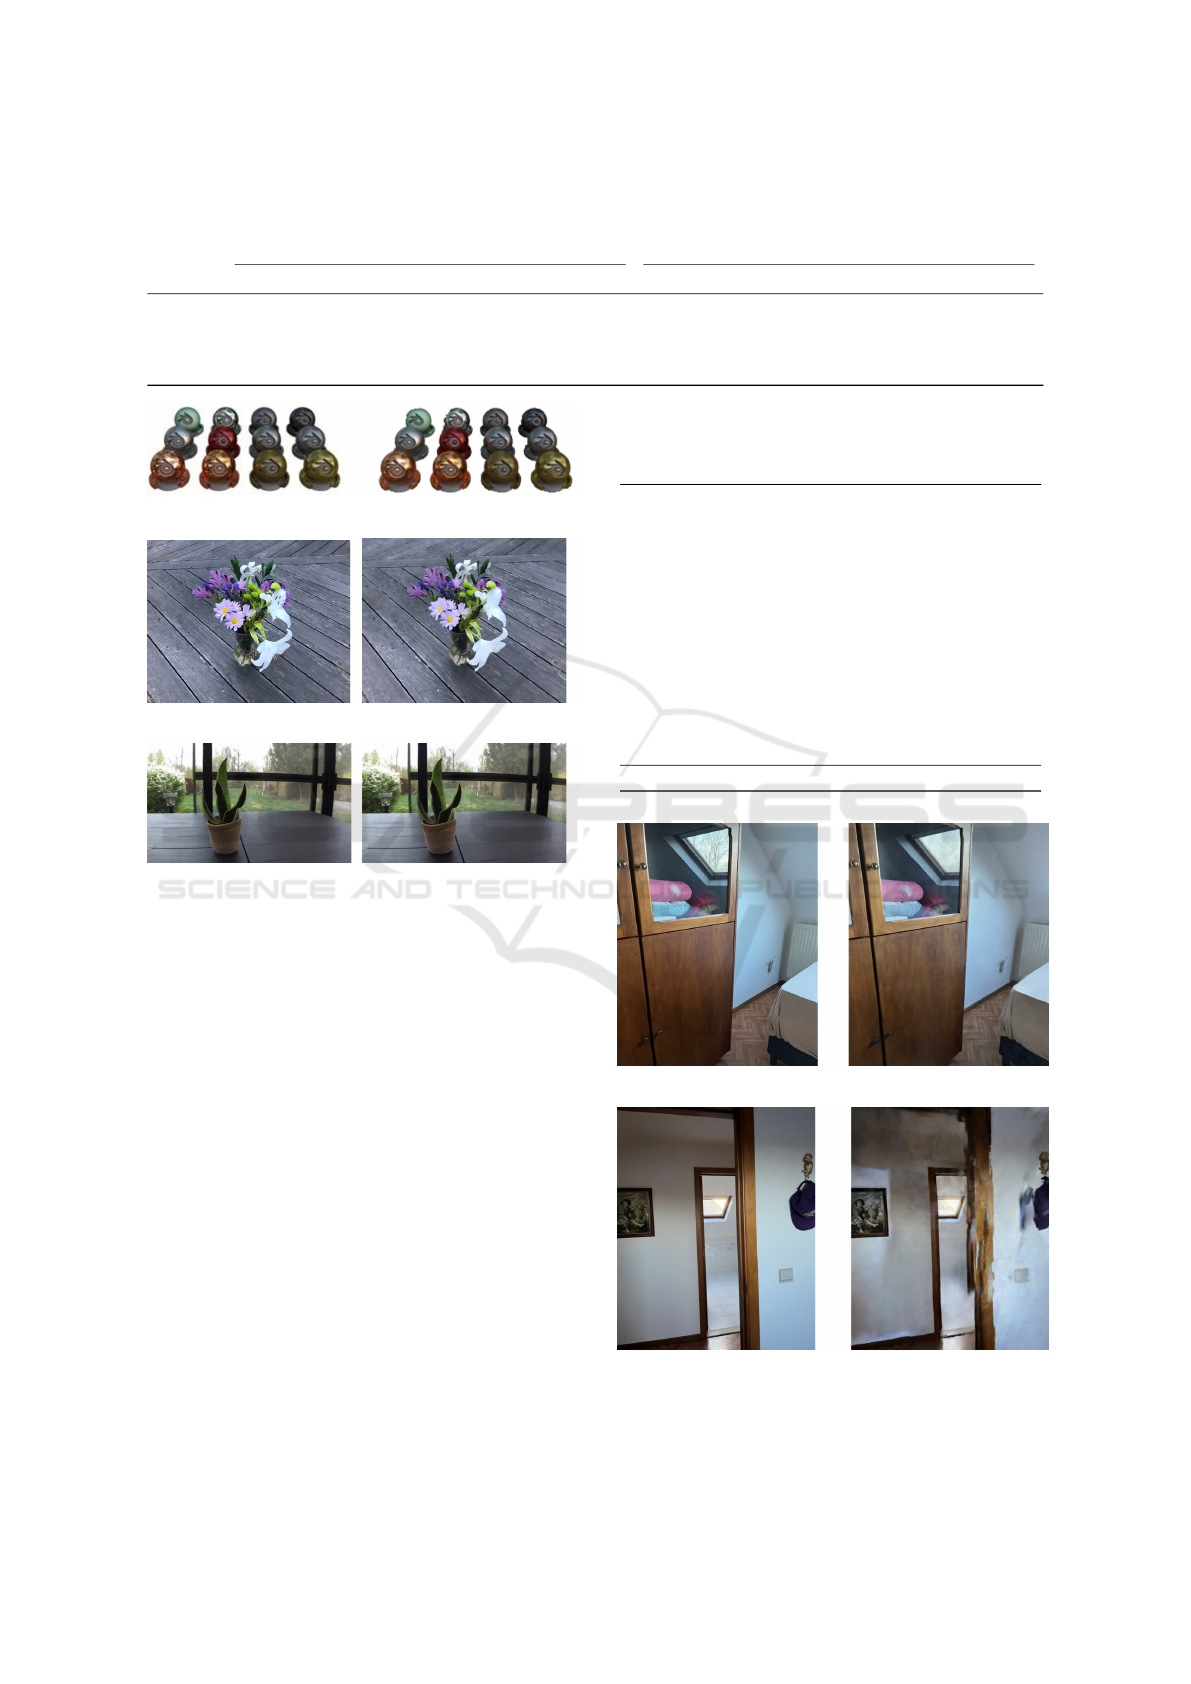
Table 2: Quantitative Results of the Preliminary Experiments - Performance Comparison between Mip-NeRF 360 and MuSt-
NeRF Stage 2.
Mip-NeRF 360 MuSt-NeRF Stage 2
Scene SSIM ↑ PSNR ↑ LPIPS ↓ Composite Score ↑ SSIM ↑ PSNR ↑ LPIPS ↓ Composite Score ↑
Materials 0.897 26.905 0.093 0.876 0.961 27.301 0.029 0.929
Vasedeck 0.793 24.592 0.189 0.783 0.723 24.409 0.205 0.750
Plant 0.742 25.108 0.255 0.738 0.757 24.905 0.249 0.746
Room 0.738 25.674 0.234 0.750 0.830 26.102 0.210 0.795
(a) Ground Truth Synthesized
(b) Ground Truth Synthesized
(c) Ground Truth Synthesized
Figure 3: Preliminary Experiments: a- Materials, b-
Vasedeck, c- Plant. Zoom in for a clearer view.
cally robust foundation, i.e., Stage 1 of MuSt-NeRF,
and the subsequent evaluation of our full pipeline.
4.2.2 ScanNet Experiments
Building upon the insights from our preliminary ex-
periments, we now evaluate the full MuSt-NeRF
pipeline (Stages 1 and 2) on five diverse scenes from
the ScanNet dataset (Dai et al., 2017). The provided
RGB-D images of real-world indoor environments
enable us to assess performance on complex, real-
istic data while leveraging ground truth depth. Fur-
thermore, we investigate the necessity of ground truth
depth by comparing performance using both ground
truth and depth-completed maps (derived from sparse
point clouds, as shown in Stage 1 of Figure 1).
The selected scenes exhibit varied characteris-
tics, including challenging lighting conditions, com-
plex geometry, and varying object density: Scene
708 (dimly lit), Scene 710 (small, densely clut-
tered), Scene 738 (hotel room with unbounded el-
Table 3: Quantitative Evaluation Results of the Inside-Out
Room scene.
IMAGE SSIM ↑ PSNR ↑ LPIPS ↓ Composite Score ↑
1 0.781 21.012 0.278 0.718
2 0.882 23.372 0.111 0.843
3 0.866 26.441 0.165 0.830
4 0.927 27.690 0.089 0.893
5 0.807 26.320 0.247 0.772
6 0.861 26.390 0.135 0.842
7 0.930 30.609 0.071 0.918
8 0.857 24.451 0.186 0.806
9 0.924 30.509 0.081 0.911
10 0.878 27.618 0.159 0.844
11 0.870 27.682 0.146 0.847
12 0.720 24.792 0.432 0.650
13 0.854 28.526 0.181 0.830
14 0.757 18.791 0.260 0.705
15 0.784 27.045 0.286 0.750
16 0.585 26.389 0.536 0.564
Average 0.830 26.102 0.210 0.795
(a) Ground Truth Synthesized
(b) Ground Truth Synthesized
Figure 4: Preliminary Experiments - Room Scene: a- Ren-
dered image with a high composite score, b- Rendered im-
age scoring below the threshold. Zoom in for a clearer view.
MuSt-NeRF: A Multi-Stage NeRF Pipeline to Enhance Novel View Synthesis
569

Table 4: Quantitative Results of the ScanNet Experiments - Performance Comparison among Mip-NeRF 360, 3D Gaussian
Splatting, and MuSt-NeRF.
Mip-NeRF 360 3D Gaussian Splatting MuSt-NeRF
Scene SSIM ↑ PSNR ↑ LPIPS ↓ Composite Score ↑ SSIM ↑ PSNR ↑ LPIPS ↓ Composite Score ↑ SSIM ↑ PSNR ↑ LPIPS ↓ Composite Score ↑
Scene 708 0.752 25.101 0.274 0.733 0.746 21.022 0.315 0.689 0.846 27.208 0.180 0.821
Scene 710 0.750 22.704 0.214 0.746 0.727 18.700 0.436 0.615 0.788 24.336 0.185 0.782
Scene 758 0.845 26.403 0.119 0.843 0.816 23.373 0.364 0.705 0.857 26.698 0.128 0.845
Scene 781 0.803 25.487 0.252 0.763 0.706 18.406 0.311 0.662 0.826 26.872 0.159 0.821
Table 5: Quantitative Results on ScanNet Scenes - Compar-
ison of the Standard and Reversed Pipelines of MuSt-NeRF.
The optimal choice for each scene is highlighted in bold.
Scene Configuration SSIM ↑ PSNR ↑ LPIPS ↓ Composite Score ↑
Scene 708 Standard 0.846 27.208 0.180 0.821
Reversed 0.796 25.617 0.238 0.768
Scene 710 Standard 0.783 20.497 0.207 0.748
Reversed 0.788 24.336 0.185 0.782
Scene 738 Standard
No refinement
0.706 19.427 0.192 0.722
Reversed - - - -
Scene 758 Standard 0.808 21.962 0.160 0.786
Reversed 0.857 26.698 0.128 0.845
Scene 781 Standard 0.776 22.829 0.175 0.773
Reversed 0.826 26.872 0.159 0.821
ements), Scene 758 (medium-sized room with sim-
ple lighting), and Scene 781 (large room with com-
plex lighting and specular reflections). We compare
the performance of both the standard (geometry-first)
and reversed (photometry-first) MuSt-NeRF configu-
rations with Mip-NeRF 360 and 3D Gaussian Splat-
ting (Kerbl et al., 2023). The results of the ScanNet
experiments are shown in Table 4, Table 5 and Fig-
ure 6. The results highlight four main findings of the
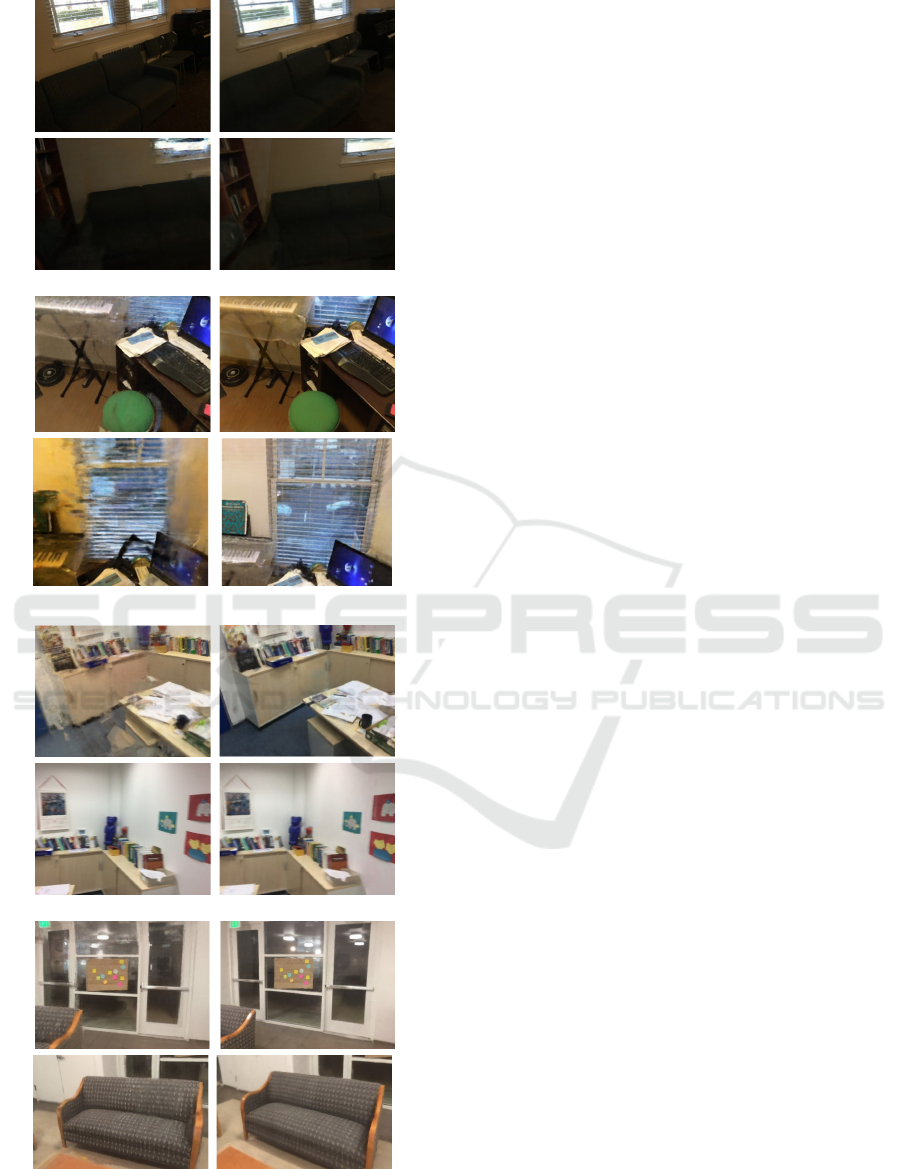
MuSt-NeRF architecture.
Benefits of Multi-Stage Refinement. The most
compelling finding from our ScanNet experiments is
the consistent and significant improvement achieved
through multi-stage refinement. In both the standard
and reversed pipelines, the refinement stage effec-
tively leverages the strengths of one stage to miti-
gate the weaknesses of the other, leading to clearly
enhanced performance, as seen through Table 4 and
Table 5.
In the standard pipeline, we see that the NeRF
model is not able to capture details of the piano (Scene
710), books (Scene 758) or model reflections from
multiple light sources (Scene 781) accurately. The re-
finement stage of the standard pipeline excels at mod-
eling specifically these, leading to an improvement in
the composite score as well as in visual comparisons
(Figure 6).
Similarly, in the reverse pipeline, we see that the
photometric reconstruction incorrectly infers the ge-
ometry of the open blinds (Scene 710). The depth-
guided training in the refinement stage corrects this
error, resulting in a more accurate and visually con-
vincing representation. Again, the composite scores
and visual comparisons highlight the enhanced per-
formance achieved through multi-stage refinement.
When comparing Mip-NeRF 360 and 3D Gaus-
sian Splatting to MuSt-NeRF, we see that MuSt-NeRF
consistently outperforms the two 360 across all four
scenes, with the most prominent difference being
in low-lighting scenes (Scene 708) and large scenes
(Scene 781) where the benefits of the geometry-
guided stage is most strongly observed. It is essen-
tial to note that each test image for each of the ex-
periments exceeded the composite score threshold af-
ter the entire MuSt-NeRF pipeline, a benchmark that
Mip-NeRF 360 and, especially, 3D Gaussian Splat-
ting failed to meet consistently. The underperfor-
mance of 3D Gaussian Splatting can likely be at-
tributed to the limited number of input images and
the resulting sparsity of the point clouds generated
for these scenes. This sparsity leads to insufficient
overlap between Gaussians, hindering their ability to
blend smoothly and produce high-quality reconstruc-
tions.
Influence of Lighting and Scene Character-
istics. Lighting conditions and scene complex-
ity significantly impact the relative performance of
the standard and reversed pipelines. The standard
(geometry-first) pipeline demonstrates greater robust-
ness in challenging lighting, particularly in the dimly
lit Scene 708 (Table 5). The reversed (photometry-
first) pipeline excels in scenes with complex light-
ing and specular reflections, such as Scene 781 (Ta-
ble 5). Scenes with simpler lighting and geometry,
like Scene 758, show very similar performance with
both configurations. These observations demonstrate
MuSt-NeRF’s adaptability: the choice of pipeline can
VISAPP 2025 - 20th International Conference on Computer Vision Theory and Applications
570
be tailored to the scene’s specific characteristics and
rendering priorities. The depth guidance in Stage 1
of the standard pipeline provides a strong geometric
prior, which is beneficial in dimly lit scenes, whereas
prioritizing photometric refinement by performing the
reversed pipeline allows for more accurate capture of
complex lighting.
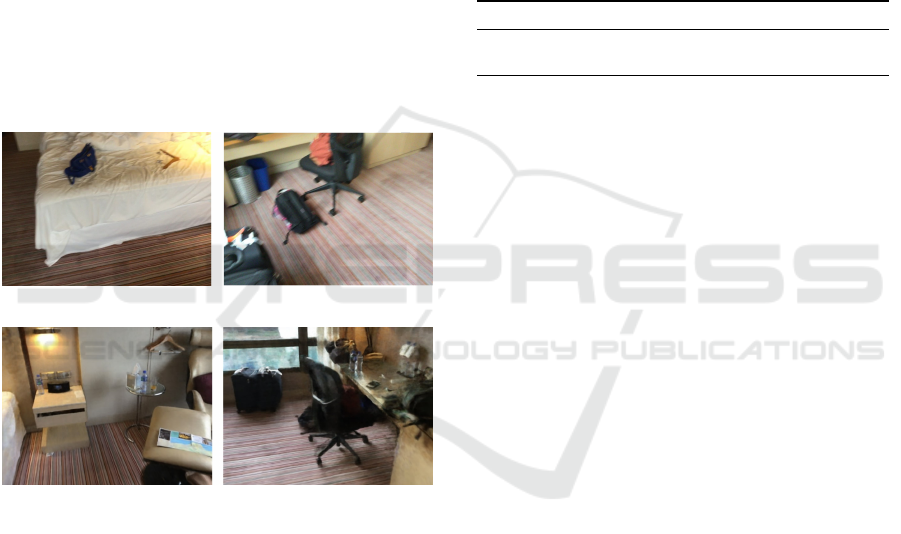
Influence of Image Quality. We also analyze
how variations in image quality affect MuSt-NeRF.
Scene 738 of the ScanNet dataset contains several
blurry images (see Figure 5). The lack of sharpness
hampers COLMAP’s ability to extract features and
estimate poses accurately, leading to incomplete or
erroneous pose information. In Scene 738, COLMAP
failed to find sufficient poses for images in regions
rendered poorly during Stage 1, preventing subse-
quent Stage 2 refinement. In the reversed pipeline for
the same scene, COLMAP was only able to extract 4
poses from a set of 67 images, which is inadequate for
reliable training of the Stage 2 architecture (Table 5).
(a) Example blurry images from the dataset.
(b) Rendered image with the highest and lowest composite
scores respectively.
Figure 5: Scene 738 - Blurry images from the dataset, best,
and worst-scoring synthesized images.
There is an additional issue that poor image qual-
ity presents. Even if COLMAP successfully extracts
poses from these images, the NeRF model’s learning
process is negatively impacted. The model will learn
the inherent blurriness present in the training images,
leading to suboptimal novel view synthesis. The ren-
dered outputs will inherit this blurriness, even in re-
gions where sharper details could potentially be re-
covered with higher-quality input images. This high-
lights the importance of high-quality input images for
optimal performance and the data-driven nature of
NeRF-based approaches.
Sufficiency of Depth-Completed Maps. To val-
idate the influence of depth map quality on MuSt-
NeRF, we conducted supplementary experiments
comparing performance with ground truth depth maps
against performance with depth-completed maps.
Specifically, we evaluated ScanNet scenes 738 and
758 using the standard (geometry-first) MuSt-NeRF
configuration with ground truth depth obtained di-
rectly from the ScanNet dataset. These results com-
plement our primary ScanNet experiments (Tables 4
and 5), which utilized depth-completed maps derived
from sparse point clouds. The comparative findings
are presented below.
Table 6: Comparison of Composite Scores using Ground
Truth and Depth-Completed Maps.
Scene True Depth Map ↑ Depth-Completed Map ↑
738 0.724 0.722
758 0.780 0.786
These experiments reveal comparable perfor-
mance between ground truth depth maps and depth-
completed maps in Stage 1 of MuSt-NeRF (Table 6).
This suggests that the depth completion network pro-
duces depth estimates that are sufficiently precise to
guide the geometric reconstruction effectively. Con-
sequently, it also points to the practical versatility of
MuSt-NeRF, as it is not dependent on the availability
of RGB-D data for optimal performance.
5 CONCLUSION
In this work, we presented MuSt-NeRF, a novel two-
stage NeRF pipeline that enhances novel view synthe-
sis by addressing the challenges of unbounded scenes,
complex lighting, and view-dependent effects, par-
ticularly specular reflections. MuSt-NeRF combines
a depth-guided geometric foundation stage with a
photometric refinement stage, integrating and extend-
ing principles from Mip-NeRF 360 and Ref-NeRF.
Our approach provides flexibility by supporting both
geometry-first and photometry-first execution modes,
allowing users to adapt the pipeline to different scene
characteristics and rendering priorities.
Our experiments on a variety of scenes, includ-
ing synthetic data, real-world captures, and challeng-
ing indoor environments from the ScanNet dataset,
demonstrated the effectiveness of MuSt-NeRF. We
showed that our two-stage approach consistently out-
performs the single-stage Mip-NeRF 360 baseline.
The preliminary experiments validated the photomet-
ric refinement stage’s capabilities in capturing com-
plex lighting, reflections and handling unbounded el-
ements, showcasing the strengths of our combined
MuSt-NeRF: A Multi-Stage NeRF Pipeline to Enhance Novel View Synthesis
571
(a) Scene 708.
(b) Scene 710.
(c) Scene 758.
(d) Scene 781.
Figure 6: ScanNet Experiments: Top pair per scene shows
the standard pipeline before and after refinement, while the
bottom pair shows the reverse pipeline.
Mip-NeRF 360 and Ref-NeRF architecture, while the
ScanNet experiments highlighted the benefits of our
full pipeline, including the importance of the depth-
guided stage for geometric robustness, the flexibil-
ity of both the standard and reverse pipeline con-
figurations, and MuSt-NeRF’s robustness to varia-
tions in lighting conditions. Furthermore, the re-
sults indicated that the choice between the standard
and reversed pipelines depends on scene properties:
the standard pipeline excels in low-light scenarios
and in scens with limited views, while the reversed
pipeline is better suited for scenes with complex re-
flections and fine details where photometric accuracy
is paramount. Potential future work includes evalu-
ating MuSt-NeRF on a wider variety of scene types,
such as outdoor environments or scenes with trans-
parent objects and benchmarking against newer NeRF
and Gaussian Splatting variants.
REFERENCES
Barron, J. T., Mildenhall, B., Tancik, M., Hedman, P.,
Martin-Brualla, R., and Srinivasan, P. P. (2021). Mip-
NeRF: A Multiscale Representation for Anti-Aliasing
Neural Radiance Fields. arXiv:2103.13415.
Barron, J. T., Mildenhall, B., Verbin, D., Srinivasan, P. P.,
and Hedman, P. (2022). Mip-nerf 360: Unbounded
anti-aliased neural radiance fields.
Dai, A., Chang, A. X., Savva, M., Halber, M., Funkhouser,
T., and Nießner, M. (2017). Scannet: Richly-
annotated 3d reconstructions of indoor scenes.
Dellaert, F. and Yen-Chen, L. (2021). Neural volume ren-
dering: Nerf and beyond.
Gao, K., Gao, Y., He, H., Lu, D., Xu, L., and Li, J. (2023).
Nerf: Neural radiance field in 3d vision, a comprehen-
sive review.
Kerbl, B., Kopanas, G., Leimk
¨
uhler, T., and Drettakis,
G. (2023). 3d gaussian splatting for real-time radi-
ance field rendering. ACM Transactions on Graphics,
42(4).
Lee, S., Chen, L., Wang, J., Liniger, A., Kumar, S., and
Yu, F. (2022). Uncertainty Guided Policy for Ac-
tive Robotic 3D Reconstruction Using Neural Radi-
ance Fields. IEEE Robotics and Automation Let-
ters, 7(4):12070–12077. Conference Name: IEEE
Robotics and Automation Letters.
Manni, A., Oriti, D., Sanna, A., De Pace, F., and Manuri,
F. (2021). Snap2cad: 3D indoor environment recon-
struction for AR/VR applications using a smartphone
device. Computers & Graphics, 100:116–124.
Martin-Brualla, R., Radwan, N., Sajjadi, M. S. M., Barron,
J. T., Dosovitskiy, A., and Duckworth, D. (2021). Nerf
in the wild: Neural radiance fields for unconstrained
photo collections.
Mildenhall, B., Srinivasan, P. P., Tancik, M., Barron, J. T.,
Ramamoorthi, R., and Ng, R. (2020). NeRF: Rep-
VISAPP 2025 - 20th International Conference on Computer Vision Theory and Applications
572

resenting Scenes as Neural Radiance Fields for View
Synthesis. arXiv:2003.08934 [cs].
Rabby, A. S. A. and Zhang, C. (2023). Beyondpixels: A
comprehensive review of the evolution of neural radi-
ance fields. arXiv e-prints, pages arXiv–2306.
Roessle, B., Barron, J. T., Mildenhall, B., Srinivasan, P. P.,
and Nießner, M. (2022). Dense depth priors for neural
radiance fields from sparse input views.
Sch
¨
onberger, J. L. and Frahm, J.-M. (2016). Structure-
from-motion revisited. In Conference on Computer
Vision and Pattern Recognition (CVPR).
Shafiei, M., Bi, S., Li, Z., Liaudanskas, A., Ortiz-Cayon,
R., and Ramamoorthi, R. (2021). Learning Neural
Transmittance for Efficient Rendering of Reflectance
Fields. arXiv:2110.13272.
Tancik, M., Casser, V., Yan, X., Pradhan, S., Mildenhall,
B., Srinivasan, P. P., Barron, J. T., and Kretzschmar,
H. (2022). Block-NeRF: Scalable Large Scene Neural
View Synthesis. arXiv:2202.05263 version: 1.
Verbin, D., Hedman, P., Mildenhall, B., Zickler, T., Barron,
J. T., and Srinivasan, P. P. (2021). Ref-nerf: Structured
view-dependent appearance for neural radiance fields.
Wei, Y., Liu, S., Rao, Y., Zhao, W., Lu, J., and Zhou, J.
(2021). NerfingMVS: Guided Optimization of Neu-
ral Radiance Fields for Indoor Multi-view Stereo.
arXiv:2109.01129.
Yang, Z., Dai, J., and Pan, J. (2024). 3D reconstruction from
endoscopy images: A survey. Computers in Biology
and Medicine, 175:108546.
MuSt-NeRF: A Multi-Stage NeRF Pipeline to Enhance Novel View Synthesis
573
