
Multi-Scale Probabilistic Score Fusion for Enhancing Alzheimer’s
Disease Detection Using EEG
Maxime Bedoin
1
, Bernadette Dorizzi
1
, Jérôme Boudy
1
, Kiyoka Kinugawa
2
and Nesma Houmani
1
1
Télécom SudParis, Institut Polytechnique de Paris, 91120 Palaiseau, France
2
Sorbonne Universite, CNRS, UMR Biological Adaptation and Aging, AP-HP, Charles Foix Hospital,
F-94200 Ivry-sur-Seine, France
Keywords:
EEG Signals, Functional Connectivity, Epoch Duration, Score Fusion, Frequency Bands, Alzheimer’s Disease.
Abstract:
In this work, we propose a fusion approach to analyze EEG signals for the discrimination between patients
with Subjective Cognitive Impairment (SCI) and patients suffering from Alzheimer’s Disease (AD). In this
framework, we analyze EEG signals at different epoch durations, following a multi-scale procedure, and in
different frequency bands, using Phase-Lag Index (PLI) and Dynamic Time Warping (DTW) for functional
connectivity measurement. Experiments show that our fusion approach leads to an improvement of classifica-
tion results, reaching an AUC of 0.902 with PLI, and 0.894 with DTW; whereas we obtain an AUC of 0.845
with PLI and 0.801 with DTW when computing connectivity on the entire signal, as usually done in the lit-
erature. Furthermore, with the additional fusion of the scores obtained at different frequency bands, we reach
the best performance with both PLI (AUC=0.95, Accuracy=91%) and DTW (AUC=0.98, Accuracy=95%).
Finally, we investigate the generalization capability of our proposal on a test set. We found that our fusion
scheme allows obtaining better classification results comparatively to when we consider the entire signal to
compute functional connectivity.
1 INTRODUCTION
Dementia encompasses a group of disorders caused
by the progressive dysfunction and death of brain
cells. It affects memory, language, executive func-
tions and other abilities, beyond what is considered a
normal age-related change, with a significant impact
on daily functioning.
The diagnosis of dementia relies on a series of
clinical tests, including neurological tests and med-
ical recordings. Neuroimaging techniques, such as
Magnetic Resonance Imaging and Positron Emis-
sion Tomography Scanner are also used to assess the
brain damage. These imaging tools are costly, non-
portable, necessitate a hospital setting and the pro-
cedure can be complex and stressful for the patient.
Moreover, they are unsuitable to follow-up the ongo-
ing brain dynamics.
Electroencephalography (EEG) is a relatively
low-cost and non-invasive neuroimaging technique
that can be used either at clinical or home-based set-
ting. EEG allows capturing brain dynamics with
excellent time resolution in the millisecond range,
which provides valuable insights into the brain’s func-
tioning. EEG brainwaves reflect the collective electri-
cal impulses generated by the synchronized firing of
neurons in the brain. These brainwaves manifest as
rhythmic oscillations, typically categorized into sev-
eral frequency bands; each associated with specific
cognitive states and mental activities.
Alzheimer’s disease (AD) is the most prevalent
form of dementia, accounting for as much as 70% of
all dementia cases (Castellani et al., 2010). It is esti-
mated that 25 million people worldwide in 2010 were
affected by AD. This figure will continue to grow, es-
pecially in Western countries as the world’s popula-
tion continues to age (Castellani et al., 2010), thus
entailing high health care costs and a considerable hu-
man toll.
AD is characterized by progressive and irre-
versible brain damage. Disease progression typically
spans over several years to decades. First, at the pre-
symptomatic stage, the person has no symptom of AD
and appears normal and unaffected, but AD-related
changes are already taking place in the brain (Bossers
et al., 2010). At the preclinical stage, the person
may go through cognitive impairment and changes,
but that are not detectable with standard tests yet.
Bedoin, M., Dorizzi, B., Boudy, J., Kinugawa, K., Houmani and N.
Multi-Scale Probabilistic Score Fusion for Enhancing Alzheimer’s Disease Detection Using EEG.
DOI: 10.5220/0013169700003911
In Proceedings of the 18th International Joint Conference on Biomedical Engineering Systems and Technologies (BIOSTEC 2025) - Volume 1, pages 741-751
ISBN: 978-989-758-731-3; ISSN: 2184-4305
Copyright © 2025 by Paper published under CC license (CC BY-NC-ND 4.0)
741

As there is no evidence of objective cognitive im-
pairment, this condition is called “Subjective Cogni-
tive Impairment" (SCI) (Dubois et al., 2009). Scien-
tific community shows an increasing interest to this
stage because of evidence of its association with an
increased risk of future objective cognitive decline.
Then, the patient may transition to Mild Cognitive
Impairment (MCI) stage, on which memory and cog-
nitive deficits start to be noticeable and measurable
on cognitive tests. The patient then progresses to the
Mild AD stage with notable cognitive deficits. These
deficits continue to worsen in moderate and end-stage
disease (Alz, 2024). There can be variations in the
progression of AD and the precise symptoms can vary
between patients.
Many studies have exploited resting-state EEG for
AD diagnosis based on functional connectivity anal-
ysis, since AD is considered as a disconnection syn-
drome (Cassani et al., 2018). Various measures have
been proposed to quantify functional connectivity,
among them Phase-Lag Index (Abazid et al., 2021;
Kasakawa et al., 2016; Stam et al., 2007), Phase Co-
herence (Dauwels et al., 2010b), Mean Square Coher-
ence (Dauwels et al., 2010a), and Mutual Information
(Abazid et al., 2021; Jeong et al., 2001). Functional
connectivity values are computed pairwise between
EEG signals. To analyze them, the common paradigm
in the literature is to average the connectivity values
per EEG electrode, or to group the electrodes into re-
gions and to average the connectivity values per re-
gion (Dauwels et al., 2010b; Houmani et al., 2021).
The resulting average values are then used as EEG-
based features for AD detection, either in a statistical
analysis or a model-based classification.
Given that the EEG signal is not stationary, it
is usually segmented into epochs to calculate con-
nectivity. The use of epochs for the extraction of
EEG markers and their subsequent averaging across
epochs has been shown to finely characterize con-
nectivity; thereby enhancing the classification perfor-
mance. However, a review of the literature reveals
a considerable variability in the length of the EEG
epochs employed in different studies (Cassani et al.,
2018): from even less than one second (Knyazeva
et al., 2010) to 30 seconds (Lee et al., 2010). The
number of epochs used for EEG analysis also varies
substantially in the literature (Cassani et al., 2018).
Some studies analyze only one epoch (Abazid et al.,
2021) but others can analyze as much as 200 per pa-
tient (Knyazeva et al., 2010). This is especially ob-
served in research works exploiting deep learning al-
gorithms. Generally, there is no explanation about
the choice of the epoch duration and the number of
epochs. Furthermore, the length of the entire EEG
signal employed is seldom specified in the literature,
which may give the impression that this parameter has
a limited impact on the results. All theses facts col-
lectively contribute to the variability and the inconsis-
tency of the results presented across studies.
To our knowledge, no study in the literature has
investigated the impact of signal duration and varia-
tion in the epoch duration on the classification per-
formance. In this work, we aim at filling this gap.
First, by studying the impact of varying EEG epoch
duration on the classification of SCI and AD patients,
based on functional connectivity. Second, by propos-
ing a novel multi-scale fusion approach for EEG anal-
ysis combining classification score outputs derived
from data analysis at different epoch durations. We
investigate the effectiveness of our proposal using two
alternative connectivity measures: Phase-Lag Index
that is frequently used in the literature for AD diagno-
sis, and Dynamic Time Warping that allows two sig-
nals to be dynamically matched following their tem-
poral variations (Karamzadeh et al., 2013). Further-
more, we propose to evaluate our fusion approach per
frequency band and then by fusing them.
2 MATERIAL AND METHODS
2.1 Database Description
The cohort used to conduct this study is composed
of resting-state EEG data of 32 SCI patients and 46
probable AD patients, acquired in a clinical setting at
Charles-Foix Hospital (Ivry-sur-Seine, France). This
retrospective study was approved by the institutional
review board of the local Ethics Committee Paris 6
and the Ethics Committee of Sorbonne University
(N°CER-2021-064).
The patients who complained of memory
impairment were referred to the outpatient memory
clinic of the hospital to undergo a battery of clinica-
l tests for brain disorders. The diagnosis was
set through a comprehensive clinical assessment,
including neuroimaging, interviews, psychometric
findings and neuro-psychological tests, in agreement
with the standard diagnostic criteria: NINDS, DSM-
IV, Jessen criteria for SCI (Jessen et al., 2014). It is
noteworthy that EEG was not included in the battery
of tests used to establish the diagnosis. Patients
with epilepsy were excluded from the study. Table
1 reports demographic and clinical characteristics of
patients included in the study.
EEG signals were recorded at rest with eyes
closed during 20 minutes at a frequency sampling
of 256 Hz, by taking care that the patients were not
BIOSIGNALS 2025 - 18th International Conference on Bio-inspired Systems and Signal Processing
742
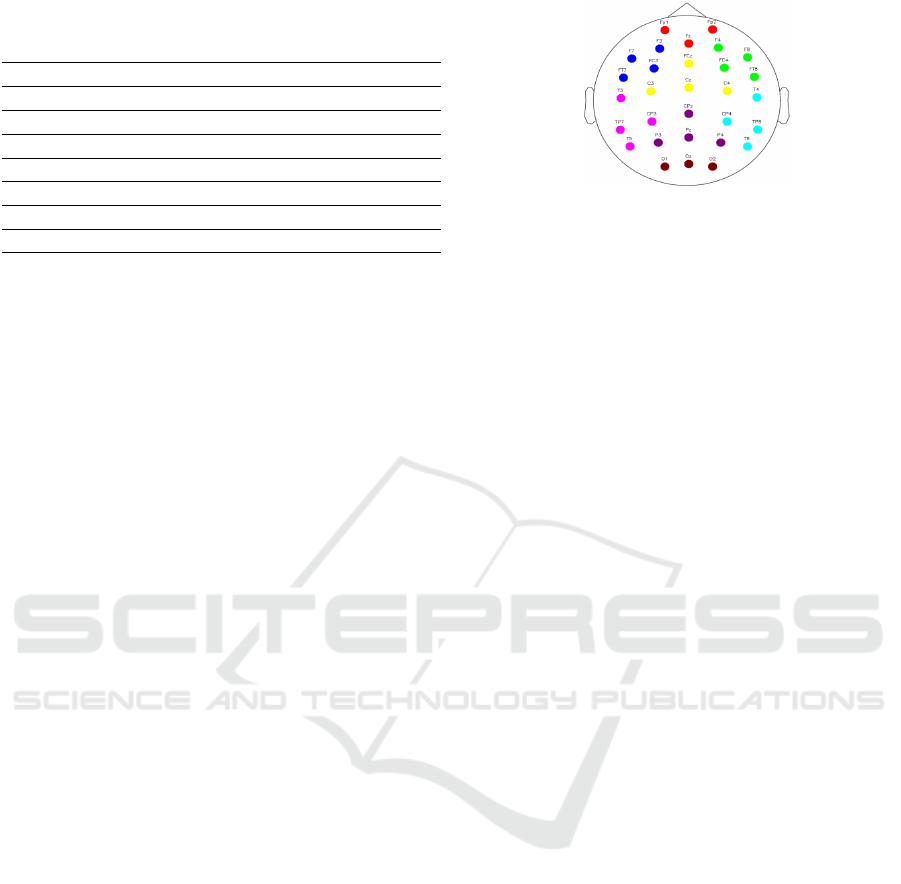
Table 1: Clinical characteristics of the cohort. MMSE:
Mini-Mental State Examination; SD: Standard Deviation.
SCI (n=32) AD (n=46)
Age (mean ± SD) 68.2 ± 10.4 82.0 ± 8.6
Female (%) 81.8% 67.4%
MMSE (mean ± SD) 28.3 ± 1.6 19.0 ± 5.6
Benzodiazepin use (%) 4 (18.2%) 10 (22.7%)
Antidepressant use (%) 5 (16.0%) 18 (39.1%)
Neuroleptic use (%) 0 (0.0%) 5 (11.0%)
Hypnotic use (%) 5 (15.6%) 8 (17.4%)
falling asleep. Thirteen electrodes were used, placed
on the scalp according to the 10-20 international sys-
tem: Fp1, Fp2, F7, F3, Fz, F4, F8, FT7, FC3, FC7,
FC4, FT8, T3, C3, Cz, C4, T4, TP7, CP3, CPz, CP4,
TP8, T5, P3, Pz, P4, T6, O1, Oz, and O2.
Then, EEG signals were visually inspected to
discard the parts of the signals presenting artifacts
(eye movements, eye blinks, muscular activity, instru-
mental noise etc.). Thereby, continuous signals of 20
seconds, free from artifacts, were then kept for the
study. The obtained 20s-signals were then band-pass
filtered with a third-order Butterworth filter in the fre-
quency range (1-30 Hz), as well as in the four con-
ventional frequency bands: delta (1-4 Hz), theta (4-8
Hz), alpha (8-12 Hz) and beta (12-30 Hz).
2.2 Methodology
In this work, we investigate the impact of varying
EEG epoch duration on the discrimination of AD
from SCI patients based on connectivity. To this end,
we first segment the entire 20s EEG signal of each
patient into epochs of different durations: 10s, 5s,
and 2s. Therefore, for each patient, we obtain vari-
ous EEG signals of different durations, i.e. the entire
signal of length 20s, two epochs of 10s, four epochs
of 5s and ten epochs of 2s.
Then, for each of these four time configurations,
we compute functional connectivity (FC) between
pairs of EEG signals, aggregated into eight regions.
Figure 1 displays such regions: frontal/prefrontal
(Fp1, Fp2, Fz), frontal left (F7, F3, FT7, FC3), frontal
right (F4, F8, FC4, FT8), central (FCz, C3, CZ, C4),
temporal left (T3, TP7, CP3, T5), temporal right (T4,
CP4, TP8, T6), parietal (P3, Pz, P4), and occipital
(O1, Oz, O2) regions.
To estimate the connectivity of one region, we av-
erage the FC values computed between the pairs of
EEG signals associated to such region. For instance,
for the frontal/prefrontal region, we average the con-
nectivity values computed between Fp1 and Fp2, Fp1
and Fz, Fp2 and Fz. We also estimate the inter-
Figure 1: The 30 electrodes aggregated into 8 regions.
regions connectivity by averaging the connectivity
values computed between all pairs of EEG signals as-
sociated to such regions. For instance, for the con-
nectivity between the prefrontal/frontal region and the
occipital one, we take the mean of the connectivity
values calculated between Fp1 and O1, Fp1 and Oz,
Fp1 and O2, Fp2 and O1, Fp2 and Oz, Fp2 and O2,
Fz and O1, Fz and Oz, Fz and O2.
Finally, for each patient, each frequency band and
each time configuration, we obtain a feature vector
containing 36 average connectivity values, including
8 intra-region connectivity values and 28 inter-regions
connectivity values.
To discriminate between SCI and AD patients,
we use a Support Vector Machine (SVM) classifier
(Campbell and Ying, 2011), considering only the
most relevant features as inputs. These features are
selected, from the total of 36 features, using the For-
ward Orthogonal Regression (OFR) method (Stop-
piglia et al., 2003), to reduce the dimension of the in-
put feature vector for the classifier. Classification per-
formance is assessed on a development set, and then
on a test set with the objective of evaluating the ro-
bustness of the proposed multi-scale fusion approach.
To validate our fusion approach, we exploit
two FC measures relying on different mathemati-
cal concepts, namely Phase-Lag Index and Dynamic
Time Warping distance.
2.3 Connectivity Measurement
2.3.1 Phase-Lag Index (PLI)
It is computed between pairs of EEG signals as fol-
lows (Stam et al., 2007):
PLI = | < sign(∆Φ(t
k
)) > | (1)
where, |.| represents the absolute value, 〈.〉 indicates
the mean (over index k), “sign” denotes the signum
function that discards phase difference of 0 mod π
and ∆Φ(t
k
) is the phase difference between two time
series at time t
k
.
Multi-Scale Probabilistic Score Fusion for Enhancing Alzheimer’s Disease Detection Using EEG
743

PLI quantifies the asymmetry of the distribution
of instantaneous phase differences between two sig-
nals, around zero mod π. If both signals are perfectly
phase-locked at a value of ∆Φ, the resulting PLI value
equals to 1. If both signals are either not coupled or
are coupled with a phase difference centered at ap-
proximately 0 mod π, the PLI value will be close to 0.
Intuitively, PLI allows quantifying the non-zero lags
between two signals.
2.3.2 Dynamic Time Warping (DTW)
DTW distance (Senin, 2008) is an elastic matching
metric that quantifies the dissimilarity between two
time series showing a potential temporal drift. DTW
reflects the amount of warping required to align two
signals. It relies on finding the best warping path to
match two signals by minimizing the cumulative dis-
tance between the assigned points in the two signals.
The computation of DTW distance between two
EEG signals S
1
and S
2
of length N, consists in a re-
cursive construction of the cost matrix, as follows:
DTW [i, j] = (S
1
[i]−S
2
[ j])
2
+
min(DTW [i −1, j],
DTW [i, j − 1],
DTW [i − 1, j − 1])
(2)
where, i and j are the time points for which we
compute the DTW .
By design, the last computed value at coordinates
(N, N) corresponds to the DTW value between the
two signals. In order to optimize the aforementioned
procedure for DTW calculation, it is sufficient to
search the optimal path close to the main diagonal of
the cost matrix, by applying a warping window. This
corresponds to limiting the shifting that is allowed be-
tween matched observations of the two EEG signals.
In this work, we used a Sakoe-Chiba band constraint
(Sakoe and Chiba, 1978), with a warping window size
fixed to six.
2.4 Performance Assessment Protocol
Classification was performed with a multivariate
SVM, using only the most relevant features as men-
tioned earlier. The performance is assessed according
to a consistent protocol: we generate 10 random sam-
plings of the whole database, considering 22 SCI and
28 AD patients for the development set, 10 SCI and
18 AD for the test set.
For each of the 10 samplings, we follow the
methodology outlined in Figure 2 for each frequency
band and each time configuration. More precisely,
Figure 2: Experimental protocol for classification perfor-
mance assessment.
on the development set, we first select the most rel-
evant features among the computed 36 features, using
the OFR method and random probe technique (Stop-
piglia et al., 2003). The OFR allows ranking all the
features (the original variables) in decreasing order of
relevance. The random probe serves as a decision cri-
terion to select the most pertinent features: we dis-
card all features that are ranked after the probe, which
is a realization of random variable considered as an
additional feature. Therefore, the number of selected
features differs for each time and frequency band con-
figuration.
Then, for each time configuration and frequency
band, we perform a 10-folds SVM classifier with
RBF kernel, and estimate the posterior probabilitie-
s of AD and SCI epochs using Platt’s estimation
method (Platt, 2000). Note that each patient has all
his/her EEG epochs in the same fold, in order to over-
come the issue of bias when evaluating the classifi-
cation performance. Consequently, for each patient
in the development set, we obtain one SVM proba-
bilistic score associated to the 20s-signal, two SVM
probabilistic scores associated to two 10s-epochs,
four scores for the 5s-epochs, and ten scores of the
2s-epochs.
Classification performance is evaluated for each
time configuration, separately, and then when fusing
the SVM output scores obtained at different epoch du-
rations.
On the test set, we assess the classification per-
formance using the SVM model trained on the
development set, considering the relevant features se-
lected with the OFR method on the whole develop-
ment set.
3 EXPERIMENTAL RESULTS
First, we present the results obtained on the develop-
ment set in a progressive manner. More specifi-
cally, we present the classification results of SCI and
AD epochs independently of the patient, for each
time configuration (i.e. 20s-signal, 10s-epochs, 5s-
epochs and 2s-epochs). Hence, we analyze the per-
formance with four individual systems. Then, we ana-
lyze the classification results of SCI and AD patients,
by averaging for each patient the SVM probabilistic
BIOSIGNALS 2025 - 18th International Conference on Bio-inspired Systems and Signal Processing
744

Table 2: AUC values on the development set using PLI and
DTW to discriminate AD from SCI epochs, considering the
four time configurations.
Frequency Epoch PLI DTW
[1-30]Hz
20s 0.706 0.801
10s 0.604 0.782
5s 0.603 0.765
2s 0.583 0.708
Delta
20s 0.544 0.751
10s 0.608 0.738
5s 0.579 0.746
2s 0.543 0.720
Theta
20s 0.766 0.762
10s 0.633 0.759
5s 0.610 0.744
2s 0.587 0.686
Alpha
20s 0.845 0.671
10s 0.683 0.667
5s 0.631 0.674
2s 0.590 0.623
Beta
20s 0.642 0.755
10s 0.652 0.777
5s 0.633 0.789
2s 0.563 0.770
output scores obtained on his/her EEG epochs, and
that for each time configuration. After that, we eval-
uate the classification of SCI and AD patients when
fusing with a simple average, per patient, the SVM
scores associated to his/her epochs of different dura-
tions. Finally, on the test set, we assess the general-
ization capability of our fusion scheme, after training
an SVM model on the entire development set.
3.1 Classification of SCI and AD Epochs
Table 2 summarizes the classification performance in
terms of AUC (Area Under The Curve) when discrim-
inating AD from SCI epochs with PLI and DTW. Re-
sults are given per frequency range, for each individ-
ual system (i.e. each time configuration). Each epoch
was assigned to the class label of the corresponding
patient.
Results indicate a good classification performance
when estimating the PLI overall the 20s-signal for all
frequency bands, except delta band. Also, we ob-
serve that the performance is degraded progressively
when computing the PLI on shorter epochs, from 10s-
epochs, 5s-epochs and then 2s-epochs.
When using DTW to quantify FC, we observe
that there is not distinctive trend in performance be-
tween the 20s-signal and shorter epochs of 10s and 5s.
Table 3: AUC values on the development set using PLI and
DTW to discriminate AD from SCI patients, considering
the four time configurations.
Frequency Epoch PLI DTW
[1-30]Hz
20s 0.706 0.801
10s 0.635 0.802
5s 0.656 0.798
2s 0.705 0.756
Delta
20s 0.544 0.751
10s 0.644 0.754
5s 0.651 0.781
2s 0.603 0.788
Theta
20s 0.766 0.762
10s 0.682 0.776
5s 0.692 0.783
2s 0.715 0.747
Alpha
20s 0.845 0.671
10s 0.742 0.677
5s 0.723 0.701
2s 0.716 0.654
Beta
20s 0.642 0.755
10s 0.689 0.786
5s 0.701 0.810
2s 0.618 0.805
However, the 2s-epoch configuration leads in general
to the worst classification results.
3.2 Classification of SCI and AD
Patients
Table 3 reports the AUC values obtained for each indi-
vidual system using PLI and DTW to discrimate SCI
from AD patients.
We note that the fusion of SVM output scores of
epochs of a given time configuration leads to better
classification performance, compared to the obtained
results on separate epochs (see Table 2). However, no
clear trend emerges on the relationship between per-
formance and epoch duration in terms of AD and SCI
patient classification. Based on the obtained result,
we propose to go a step forward in our fusion scheme,
by combining for each patient the SVM scores of
his/her epochs with different durations.
3.3 Merging Probabilistic Output
Scores of Different Epoch Durations
We average for each patient the SVM probabilistic
scores obtained for his/her epochs with different dura-
tions. For example, to fuse the 20s and 10s, we aver-
age the output score associated to the 20s-signal and
Multi-Scale Probabilistic Score Fusion for Enhancing Alzheimer’s Disease Detection Using EEG
745
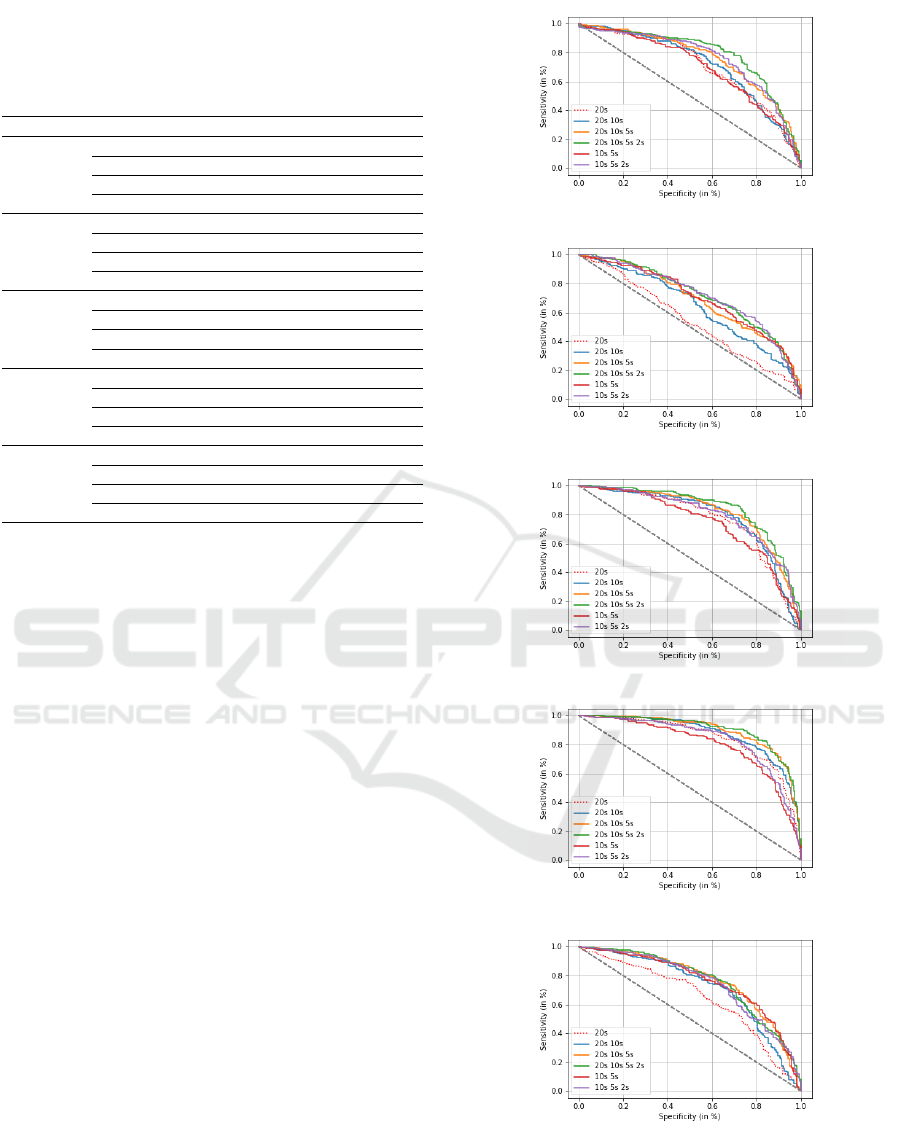
Table 4: AUC values and correct classification rates (in %)
of SCI and AD patients using PLI, when fusing SVM scores
of different epoch durations (Acc: Accuracy, Sens: Sensi-
tivity and Spec: Specificity).
Frequency Time config. AUC Acc Sens. Spec.
[1-30]Hz
20s 0.706 69.4 88.9 44.5
20s-10s-5 0.759 71.6 80.7 60.0
20s-10s-5s-2s 0.789 75.6 77.9 72.7
10s-5s-2s 0.760 72.4 78.2 65.0
Delta
20s 0.544 58.0 90.4 16.8
20s-10s-5 0.693 64.4 79.9 45.0
20s-10s-5s-2s 0.718 66.2 62.1 71.4
10s-5s-2s 0.718 66.6 56.8 79.1
Theta
20s 0.766 73.4 73.6 73.2
20s-10s-5 0.816 76.8 79.3 73.6
20s-10s-5s-2s 0.844 80.2 86.8 71.8
10s-5s-2s 0.799 74.4 81.1 65.9
Alpha
20s 0.845 77.8 82.9 71.4
20s-10s-5 0.895 81.6 82.9 80.0
20s-10s-5s-2s 0.902 83.6 89.6 75.9
10s-5s-2s 0.835 78.4 83.2 72.3
Beta
20s 0.642 64.4 74.6 51.4
20s-10s-5 0.765 71.8 72.9 70.5
20s-10s-5s-2s 0.760 71.6 74.3 68.2
10s-5s-2s 0.747 70.8 83.2 72.3
the two scores associated to the two epochs of 10s.
Then, based on the average scores computed for all
patients, we analyze the performance when discrimi-
nating AD from SCI patients.
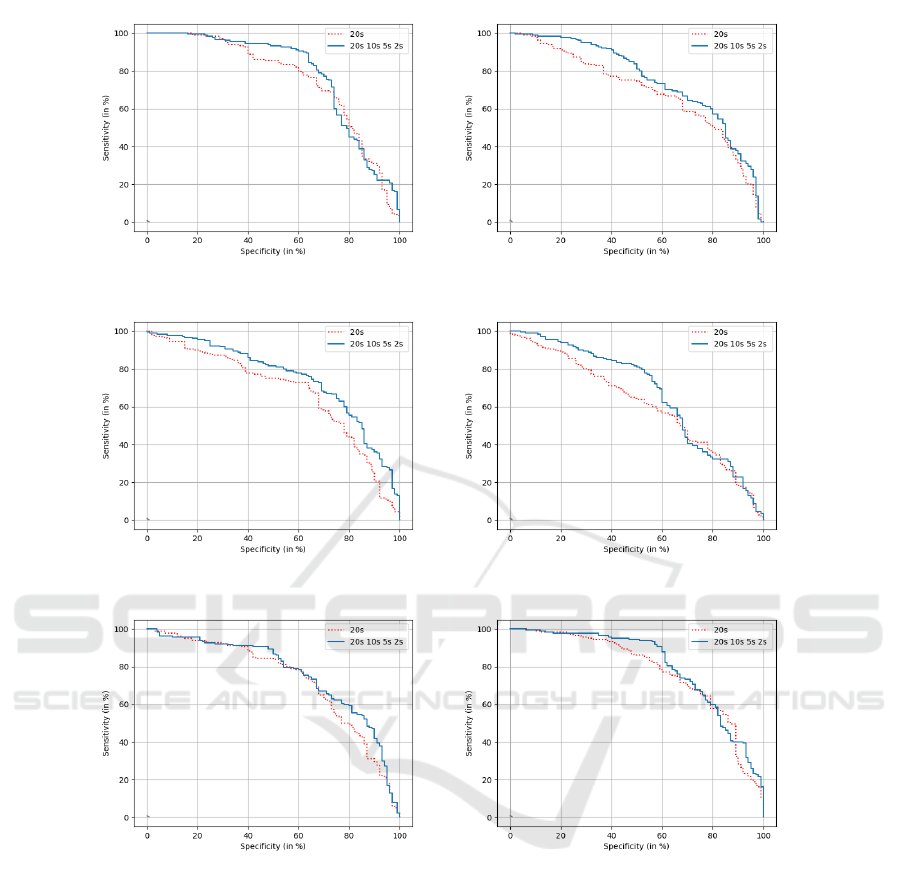
Figures 3 and 4 display six ROC curves associated
to the 20s-signal (baseline) and to five fusion configu-
rations, considering respectively PLI and DTW as FC
measures. We report in Tables 4 and 5 the results for
the 20s configuration and only three fusion configu-
rations, those leading to the best classification perfor-
mance. Specificity is the percentage of SCI patients
well classified; sensitivity indicates the percentage of
AD patients well classified.
We observe that fusing the SVM scores of epochs
with different durations allows to highly improving
the classification of AD and SCI patients, compared
to the baseline system (20s-signal), as well as to
individual systems that have been fused (i.e. con-
sidering each time configuration separately). Indeed,
in Section 3.2, the best AUC value is obtained with
PLI in alpha considering the 20s-signal (AUC=0.845)
and with DTW in beta considering the 5s-epoch
(AUC=0.810). Nevertheless, when fusing the scores
of epochs of different durations, we notice that bet-
ter results are obtained for all fusion combinations,
reaching an AUC value of 0.902 with PLI in alpha
(see Table 4), and an AUC value of 0.894 with DTW
in beta (see Table 5).
Additionally, we clearly observe that the fusion
framework gives better results when combining the
scores of the whole signal (20s-signal) with those of
(a)
(b)
(c)
(d)
(e)
Figure 3: ROC curves for AD and SCI patient classification
using PLI, when fusing SVM scores of different epoch du-
rations in: (a) (1-30 Hz), (b) delta, (c) theta, (d) alpha and
(e) beta.
BIOSIGNALS 2025 - 18th International Conference on Bio-inspired Systems and Signal Processing
746
Table 5: AUC values and correct classification rates (in %)
of SCI and AD patients using DTW, when fusing SVM
scores of different epoch durations (Acc: Accuracy, Sens:
Sensitivity and Spec: Specificity).
Frequency Time config. AUC Acc. Sens. Spec.
[1-30]Hz
20s 0.801 73.2 73.2 73.2
20s-10s-5 0.884 81.2 83.9 77.7
20s-10s-5s-2s 0.869 79.6 88.2 68.6
10s-5s-2s 0.858 78.4 83.9 71.4
Delta
20s 0.751 70.0 73.2 65.9
20s-10s-5 0.852 76.6 87.5 62.7
20s-10s-5s-2s 0.882 79.6 88.2 68.6
10s-5s-2s 0.873 80.0 83.6 75.5
Theta
20s 0.762 71.8 75.7 66.8
20s-10s-5 0.868 79.6 83.9 74.1
20s-10s-5s-2s 0.852 79.6 78.9 80.5
10s-5s-2s 0.842 78.6 77.9 79.5
Alpha
20s 0.671 64.4 79.6 48.2
20s-10s-5 0.766 70.8 80.7 58.2
20s-10s-5s-2s 0.739 68.6 77.1 57.7
10s-5s-2s 0.730 68.2 75.0 59.5
Beta
20s 0.755 70.4 66.8 75.0
20s-10s-5 0.878 80.2 81.8 78.2
20s-10s-5s-2s 0.894 80.4 78.2 83.2
10s-5s-2s 0.887 79.8 78.9 80.9
Table 6: AUC values and correct classification rates (in %)
of SCI and AD patients using PLI and DTW, when fusing
SVM scores of different epoch durations and different fre-
quency bands (Acc: Accuracy, Sens: Sensitivity and Spec:
Specificity).
Meas. Time config. AUC Acc. Sens. Spec.
PLI
20s 0.910 83.8 92.1 73.2
20s-10s-5 0.957 91.2 90.4 92.3
20s-10s-5s-2s 0.956 91.0 92.1 89.5
10s-5s-2s 0.929 87.0 88.2 85.5
DTW
20s 0.921 84.8 87.9 80.9
20s-10s-5 0.986 94.4 95.0 93.6
20s-10s-5s-2 0.987 95.0 94.3 95.9
10s-5s-2s 0.984 94.0 92.1 96.4
shorter epochs in a progressive manner. The best
results are obtained when fusing the scores of 20s-
signal, 10s-epochs, 5s-epochs and 2s-epochs (20s-
10s-5s-2s).
Table 6 and Figure 5 show the classification re-
sults when fusing for each patient the SVM scores
of his/her epochs obtained at different time durations
and in the four frequency ranges (delta, theta, alpha
and beta). We observe that this double fusion scheme
allows improving significantly the classification per-
formance, reaching an accuracy value of 91.2% with
PLI (AUC=0.95) and of 95% with DTW (AUC=0.98).
Finally, we remark that fusing the classification
scores of the four frequency ranges is more powerful
compared to when analyzing the signal on the whole
spectrum (1-30 Hz). Indeed, when considering the
(a)
(b)
(c)
(d)
(e)
Figure 4: ROC curves for AD and SCI patient classification
using DTW, when fusing SVM scores of different epoch
durations in: (a) (1-30 Hz), (b) delta, (c) theta, (d) alpha
and (e) beta.
Multi-Scale Probabilistic Score Fusion for Enhancing Alzheimer’s Disease Detection Using EEG
747
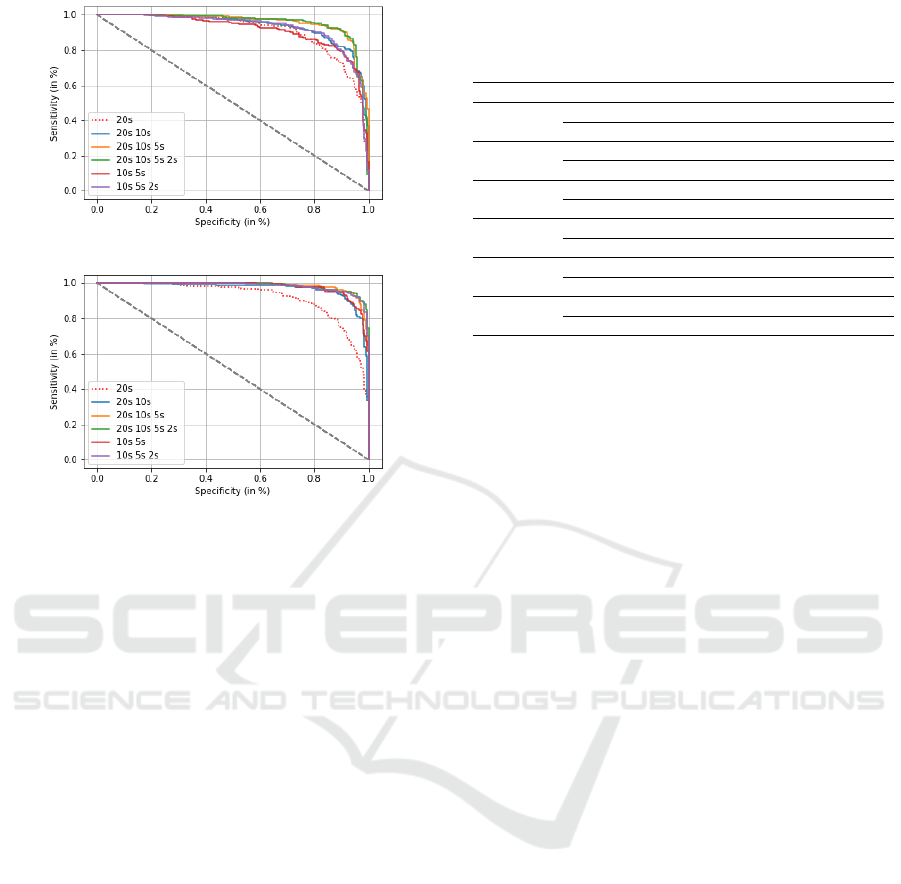
(a)
(b)
Figure 5: ROC curves for AD and SCI patient classification
using: (a) PLI and (b) DTW, when fusing the SVM scores
of different epoch durations and different frequency bands.
whole spectrum, Tables 4 and 5 show that we reach
an AUC value of 0.789 with PLI and of 0.884 with
DTW, for the configuration (20s-10s-5s-2s). On such
configuration, by processing EEG signals in each fre-
quency band separately, and then fusing the resulting
probabilistic scores, we obtain better results, reaching
an AUC value of 0.957 with PLI and of 0.987 with
DTW. This outcome also demonstrates the effective-
ness of our fusion approach.
3.4 On the Generalization Capability of
the Fusion Scheme on the Test
Subset
In this section, we investigate the effectiveness of our
fusing approach in terms of classification prediction
on the test subset. We follow the experimental pro-
tocol explained in Section 2.4. Table 7 and Figure 6
show the results on the test set considering the whole
20s signal and the best configuration obtained on the
development set, that fusing 20s, 10s, 5s and 2s.
The performance results on the test set are not
good as those obtained on the development set. Nev-
ertheless, we observe that fusing epoch durations al-
lows enhancing the performance compared to when
considering the 20s configuration, in terms of AUC
and accuracy (see Table 7). This tendency is observed
Table 7: Classification performance on the test set using
DTW, for the 20s-signal and the time configuration 20s-10s-
5s-2s.
Frequency Time config. AUC Acc. Sens. Spec.
[1-30]Hz
20s 0.758 74.3 82.8 59.0
20s-10s-5s-2s 0.785 80.4 89.4 64.0
Delta
20s 0.690 66.8 97.8 11.0
20s-10s-5s-2s 0.754 73.2 91.1 41.0
Theta
20s 0.679 70.0 72.8 64.0
20s-10s-5s-2s 0.754 72.1 76.1 65.0
Alpha
20s 0.611 64.6 87.8 23
20s-10s-5s-2s 0.670 70.4 80.6 52.0
Beta
20s 0.730 72.5 83.9 52.0
20s-10s-5s-2s 0.761 75.4 89.4 50.0
Fusion
20s 0.776 74.6 92.2 43.0
20s-10s-5s-2 0.803 80.4 93.3 57.0
for all the frequency bands. Moreover, the double
fusion scheme, including both epoch durations and
frequency ranges, allows increasing the performance
even further (AUC=0.803).
Finally, note that we report only the generaliza-
tion results obtained with DTW. In fact, the obtained
results on the test set with PLI were very bad, reflect-
ing that there is poor stability in the selected features
with PLI from the development to the test sets, com-
paratively to DTW.
4 DISCUSSION
The purpose of this study is two folds: (i) investi-
gating the impact of varying EEG epoch duration on
the discrimination between two brain cognitive con-
ditions (SCI and AD) based on functional connectiv-
ity, (ii) evaluating the potential application of a multi-
scale fusion approach for an improved classification
results. We have proposed both temporal and fre-
quency fusions, which consist in combining the clas-
sifier probabilistic scores obtained on epochs with
different time durations and in different frequency
bands. Such fusion was carried out through a sim-
ple averaging of the SVM scores which is the most
parsimonious choice.
Experiments have been conducted following a
consistent experimental protocol dividing the whole
dataset into a development set and a test set. On the
development set, results showed that when consider-
ing the whole 20s-signal (baseline system), the classi-
fication results of AD and SCI epochs are better than
when analyzing EEG signals on shorter epochs of 10s,
5s and 2s. The worst results are obtained for the 2s-
epoch duration.
By fusing, for each patient, the classifier out-
put scores obtained on his/her epochs for each time
BIOSIGNALS 2025 - 18th International Conference on Bio-inspired Systems and Signal Processing
748
(a) (b)
(c) (d)
(e) (f)
Figure 6: ROC curves for AD and SCI patient classification on the test set based on DTW, using the 20s-signal and the fusion
configuration (20s-10s-5s-2s) in :(a) [1-30] Hz, (b) delta, (c) theta, (d) alpha, (e) beta, and (f) considering the fusion of all
frequency bands.
configuration, classification performance of patients
was found better than that obtained when classifying
epochs. Nevertheless, no clear trend appeared on the
relationship between epoch duration and classifica-
tion performance. These results may highlight the po-
tential complementarity in terms of information con-
tent, when segmenting EEG signals into epochs and
fusing the classifier scores obtained per epoch.
Besides, our fusion approach showed an improve-
ment of classification results when combining the
scores of the whole signal (20s-signal) with those of
shorter epochs in a progressive manner. The best re-
sults were obtained for the (20s-10s-5s-2s) config-
uration. Then, by fusing the classification scores
obtained at different frequency bands, we further
improve the discrimination between SCI and AD
patients, reaching an accuracy of 91.2% with PLI
(AUC=0.95) and 95% with DTW (AUC=0.98), with a
very good balance between specificity and sensitivity.
Results also highlighted that fusing classifier scores
obtained in each frequency band is more efficient
than when analyzing the signal on the whole spec-
Multi-Scale Probabilistic Score Fusion for Enhancing Alzheimer’s Disease Detection Using EEG
749

trum. Notably, by analyzing each frequency band sep-
arately, we can retrieve more specific EEG features,
which leads to a refined characterization of EEG sig-
nals and thus a better discrimination between popula-
tions.
When evaluating the results on the test set, we
found that DTW is more effective than PLI in the con-
text of this study. This can be explained by the fact
that DTW is an elastic distance that allows captur-
ing dynamic temporal-lags, which may fluctuate over
time when matching two EEG signals. By contrast,
PLI assumes the temporal delay stationary.
Although the classification results on the test set
were degraded comparatively to the development set,
our proposed multi-scale fusion approach outper-
forms the baseline system (20-s signal), reaching an
AUC value of 0.785 for the 20s-10s-5s-2s configura-
tion, and of 0.803 when additionally fusing the fre-
quency bands.
All these results first highlight that varying EEG
signal duration has an impact on the classification re-
sults. This can explain in part the difference of results
in the state-of-the-art. Therefore, it is important to
specify in scientific articles the duration of EEG sig-
nals and to clarify the epoching process, such as the
number and length of epochs.
Furthermore, our findings demonstrate the
effectiveness of analyzing EEG signals at different
epoch durations and fusing the classification scores of
the extracted epochs. This framework allows a refine
characterization of the brain dynamics across time by
computing the connectivity on short epochs, while
taking into account all the available information in the
whole EEG signal. Finally, combining the frequency
bands is also very pertinent in terms of classification
results, since each frequency band conveys valuable
and complementary insights into brain function.
Our fusion scheme is based on classification
scores. This study focuses on SVM probability output
which entails two main limitations. First, probabil-
ity estimation by Platt’s assumes the relationship be-
tween the SVM scores and the probabilities to be sig-
moidal, which might not be true in our case. However,
our fusion scheme was evaluated in the same condi-
tions as the individual systems. Second, we evalu-
ate our approach with only one classifier. The results
should be confirmed using other classifiers, leverag-
ing alternative mathematical paradigms.
5 CONCLUSION
This work points out the potential use of both tem-
poral and frequency fusion approach to improve the
characterization of EEG signals, and thus the classifi-
cation results of AD and SCI patients. In addition, this
fusion approach allows obtaining good prediction per-
formance in the context of generalization of results.
In the future, we will perform further analyses to
study the extent of our fusion approach. First, we
will analyze the features that were selected for the
different durations of epochs to understand what are
the crucial variables of the region connectivity ma-
trix for the prediction. Second, we plan to investigate
the effectiveness of our approach to discriminate be-
tween SCI, AD and MCI patients. Indeed, by adding
the MCI group, the classification would be more chal-
lenging. Our hypothesis is that our multi-scale fusion
approach can contribute to the fine characterization
of these three cognitive conditions, thus enhancing
the multi-class classification. Also, we will assess the
generalization capability of other functional connec-
tivity measures by conducting a comparative analysis
in such context.
REFERENCES
(2024). 2024 alzheimer’s disease facts and figures.
Alzheimer’s & Dementia, 20(5):3708–3821.
Abazid, M., Houmani, N., Boudy, J., et al. (2021). A Com-
parative Study of Functional Connectivity Measures
for Brain Network Analysis in the Context of AD De-
tection with EEG. Entropy, 23(11):1553.
Bossers, K., Wirz, K. T., Meerhoff, G. F., et al. (2010).
Concerted changes in transcripts in the prefrontal cor-
tex precede neuropathology in Alzheimer’s disease.
Brain, 133(12):3699–3723.
Campbell, C. and Ying, Y. (2011). Learning with Sup-
port Vector Machines. Synthesis Lectures on Artificial
Intelligence and Machine Learning. Springer Interna-
tional Publishing, Cham.
Cassani, R., Estarellas, M., San-Martin, R., et al.
(2018). Systematic Review on Resting-State EEG for
Alzheimer’s Disease Diagnosis and Progression As-
sessment. Disease Markers, 2018:5174815.
Castellani, R. J., Rolston, R. K., and Smith, M. A.
(2010). Alzheimer Disease. Disease-a-month : DM,
56(9):484–546.
Dauwels, J., Vialatte, F., and Cichocki, A. (2010a). Di-
agnosis of Alzheimer’s Disease from EEG Signals:
Where Are We Standing? Current Alzheimer Re-
search, 7(6):487–505.
Dauwels, J., Vialatte, F., Musha, T., and Cichocki, A.
(2010b). A comparative study of synchrony measures
for the early diagnosis of Alzheimer’s disease based
on EEG. NeuroImage, 49(1):668–693.
Dubois, B., Picard, G., and Sarazin, M. (2009). Early detec-
tion of Alzheimer’s disease: new diagnostic criteria.
Dialogues in Clinical Neuroscience, 11(2):135–139.
BIOSIGNALS 2025 - 18th International Conference on Bio-inspired Systems and Signal Processing
750

Houmani, N., Abazid, M., Santiago, K. d., et al. (2021).
EEG signal analysis with a statistical entropy-based
measure for Alzheimer’s disease detection. 2:387.
Jeong, J., Gore, J. C., and Peterson, B. S. (2001). Mu-
tual information analysis of the EEG in patients
with Alzheimer’s disease. Clinical Neurophysiology,
112(5):827–835.
Jessen, F., Amariglio, R. E., van Boxtel, M., et al. (2014).
A conceptual framework for research on subjec-
tive cognitive decline in preclinical Alzheimer’s dis-
ease. Alzheimer’s & Dementia: The Journal of the
Alzheimer’s Association, 10(6):844–852.
Karamzadeh, N. et al. (2013). Capturing dynamic patterns
of task-based functional connectivity with EEG. Neu-
roImage, 66:311–317.
Kasakawa, S., Yamanishi, T., Takahashi, T., et al. (2016).
Approaches of Phase Lag Index to EEG Signals in
Alzheimer’s Disease from Complex Network Analy-
sis. In Chen, Y.-W., Torro, C., Tanaka, S., Howlett,
R. J., and C. Jain, L., editors, Innovation in Medicine
and Healthcare 2015, Smart Innovation, Systems and
Technologies, pages 459–468, Cham. Springer Inter-
national Publishing.
Knyazeva, M. G., Jalili, M., Brioschi, A., et al. (2010). To-
pography of EEG multivariate phase synchronization
in early Alzheimer’s disease. Neurobiology of Aging,
31(7):1132–1144.
Lee, S.-H., Park, Y.-M., Kim, D.-W., and Im, C.-H. (2010).
Global synchronization index as a biological correlate
of cognitive decline in Alzheimer’s disease. Neuro-
science Research, 66(4):333–339.
Platt, J. (2000). Probabilistic Outputs for Support Vec-
tor Machines and Comparisons to Regularized Like-
lihood Methods. Adv. Large Margin Classif., 10.
Sakoe, H. and Chiba, S. (1978). Dynamic programming
algorithm optimization for spoken word recognition.
IEEE Transactions on Acoustics, Speech, and Signal
Processing, 26(1):43–49. Conference Name: IEEE
Transactions on Acoustics, Speech, and Signal Pro-
cessing.
Senin, P. (2008). Dynamic time warping algorithm review.
Stam, C. J., Nolte, G., and Daffertshofer, A. (2007). Phase
lag index: Assessment of functional connectivity
from multi channel EEG and MEG with diminished
bias from common sources. Human Brain Mapping,
28(11):1178–1193.
Stoppiglia, H., Dreyfus, G., Dubois, R., and Oussar, Y.
(2003). Ranking a random feature for variable and
feature selection. J. Mach. Learn. Res., 3(7/8):1399–
1414.
Multi-Scale Probabilistic Score Fusion for Enhancing Alzheimer’s Disease Detection Using EEG
751
