
Energy Monitoring Systems Analysis and Development:
A Case Study for Graph-Based Modelling
Tiago Carvalho
1
, Tobias M
¨
uller
2
, Sebastian Reiter
2
, Luis Miguel Pinho
1
and Andr
´
e Oliveira
3
1
Polytechnic Institute of Porto, School of Engineering & INESC TEC, Porto, Portugal
2
FZI Forschungszentrum Informatik, Karlsruhe, Germany
3
Cleanwatts S.A, Coimbra, Portugal
Keywords:
Energy Monitoring, IoT, Modelling Language, Model Transformations, Model-Based Analysis.
Abstract:
The Internet of Things (IoT) enables everyday objects to connect and communicate remotely, transforming
areas such as smart homes and industrial automation. IoT systems can be standalone or interconnected in
a System of Systems, where multiple devices work together towards a common goal. A key application is
Energy Monitoring Systems (EMS), which track energy use within communities, using energy production
and consumption. Designing this type of IoT systems remains complex and requires careful consideration of
heterogeneous devices, their limitations, software, communication protocols, data management, and security.
This paper presents a design approach for EMS communities, with a focus on house-level IoT systems. We
introduce a model-driven development methodology, a holistic and flexible framework for designing IoT sys-
tems across the development and operations lifecycle. Especially, the concept of projectors enables an easy
shift between domain assets and provide automation support. The approach is validated with a real-life use
case, for which an analysis phase was developed, showing the benefits of using our approach for managing
EMS and the automation of the analysis configuration.
1 INTRODUCTION
The Internet of Things (IoT) has revolutionized the
way we interact with our environment by enabling
everyday objects to connect, communicate, and ex-
change data remotely and over the Internet (Kraijak
and Tuwanut, 2015). From smart homes to indus-
trial automation, IoT systems are transforming several
domains, enhancing efficiency, convenience, and pro-
ductivity. They can be simple independent device or
a set of many - possibly heterogeneous - devices, ge-
ographically dispersed (Kim et al., 2017). These de-
vices often build a System of Systems (SoS) (Board-
man and Sauser, 2006). In the context of IoT, a SoS is
a network of individual systems, with several devices,
sensors, software, and services working together to
achieve a common goal (Alkhabbas et al., 2016).
The SoS paradigm often applies to Energy Mon-
itoring Systems (EMS) (Chooruang and Meekul,
2018; Menniti et al., 2022), an IoT-based SoS that
monitors both energy consumption and production.
It consists of devices focused on extracting energy-
related measurements to provide insight into en-
ergy production and consumption (Chooruang and
Meekul, 2018). Each device has limited resources,
so the design, configuration and management of these
systems ensure a stable and continuous operation.
The design and production of IoT systems is
a challenging concept (Arslan et al., 2023; Sun-
dramoorthy et al., 2011). The design requires a
holistic approach that encompasses hardware, soft-
ware, communications, data management, security,
and usability considerations (Chooruang and Meekul,
2018). Planning and implementing each aspect of the
process enables developers to build robust, scalable,
and secure IoT solutions by carefully considering sev-
eral of these key factors (Arslan et al., 2023).
As a result, IoT system design needs to con-
sider different levels of abstraction, from the hard-
ware stack to system management. The methodol-
ogy for each design layer can be highly abstract, with
more design freedom, or concrete to the system con-
text. For instance, systems can consider the full de-
sign of hardware devices, the system design, the soft-
ware stack, and the deployment configuration, where
other design and operation phases can consider the
high-level design of devices and their communica-
tions, and use predefined hardware/software stacks.
186
Carvalho, T., Müller, T., Reiter, S., Pinho, L. M. and Oliveira, A.
Energy Monitoring Systems Analysis and Development: A Case Study for Graph-Based Modelling.
DOI: 10.5220/0013170000003896
In Proceedings of the 13th International Conference on Model-Based Software and Systems Engineering (MODELSWARD 2025), pages 186-195
ISBN: 978-989-758-729-0; ISSN: 2184-4348
Copyright © 2025 by Paper published under CC license (CC BY-NC-ND 4.0)

Having these considerations in mind, this paper
aims to provide a holistic, yet flexible, approach
for the design of IoT systems, considering several
phases of the development and operation (DevOps)
lifecycle. We present a generalized, flexible mod-
elling methodology based on the IoT Platform mod-
elling Language (IoT-PML) (SparxSystems Software
GmbH, 2020). With the introduced concept of projec-
tors, the methodology offers means to integrate vari-
ous domain artefacts and reduce effort by automation.
To evaluate the suggested approach, we supported the
industrial design and analysis of an EMS use case
with various configurations, specially focused on the
house level. In the paper, we focus on the analysis
and configuration phase, guaranteeing that the design
is in fact viable and adequate. We evaluate the viabil-
ity of the EMS, regarding the memory limitation and
the improvement of data acquisitions.
The paper is structured as follows. In Section 2,
we describe the IoT systems the proposed model-
driven design (MDD) approach aims to improve the
DevOps cycle. Afterwards, Section 3 presents the
modelling methodology. Section 4 describes Clo-
ogy®EMS, and gives excerpts of how the modelling
approach is used for design support, and the analysis
and configuration phase that takes as input a special-
ized view of the system. Finally, in Section 5 we draw
some conclusions of the designed approach.
2 SYSTEM OF ENERGY
MONITORING SYSTEMS
SoS in IoT paradigm leverage the capabilities of net-
worked systems and IoT devices that solve complex
tasks and improve efficiency in various domains, such
as smart cities, healthcare, agriculture, manufactur-
ing, and transportation (Boardman and Sauser, 2006).
These systems are interconnected via networks, e.g.,
internet or local networks, enabling data sharing,
communication, and coordination between the vari-
ous components of the SoS (Ding et al., 2020). An
important aspect of a SoS is the ability to exchange
and integrate data between systems (Fortino et al.,
2021). This involves collecting data from sensors and
devices, processing the data, and making it available
to other components within the system or to other sys-
tems of the SoS. Understanding and specifying the
SoS architecture is essential in the design of these sys-
tems (Fortino et al., 2021).
EMS communities are SoS for energy monitoring
with interconnected networks of devices (e.g. resi-
dences) aimed at efficiently monitor and manage en-
ergy consumption, generation, and distribution (Men-
niti et al., 2022). By leveraging these intercon-
nected IoT systems, communities can achieve signifi-
cant benefits, including cost reductions, environmen-
tal sustainability, reliability, and improved quality of
life for residents and businesses (Menniti et al., 2022).
An EMS is a distributed sensing and actuating
IoT system, usually one system out of several SoS,
designed to observe and manage energy production
and/or consumption (Chooruang and Meekul, 2018).
They provide access to real-time and historical energy
data. A smart meters and sensors are deployed to col-
lect real-time energy data, including electricity, and
water and gas usage, providing insights regarding pat-
terns and enabling the identification of optimization
opportunities. While SoS are typically distributed
systems, at this level of granularity it is common to
have a centralized IoT system, where all data pro-
cessing, analysis, and decision-making occur within a
single centralized platform or server. The IoT devices
collect and transmit data to a central hub, or a hierar-
chy of hubs if the system is very dense or dispersed.
The central hub then manages, processes, and stores
the data, often using cloud computing resources for
scalability and accessibility. The data is usually of-
floaded and analysed in dedicated systems. Since it is
not a real-time analysis, advanced and computation-
ally heavy analysis can be performed, including the
use of machine learning, and the detection of poten-
tial anomalies and optimization opportunities.
3 MODELLING APPROACH
To achieve the required flexibility to support various
levels of abstraction and support multiple life cycle
phases of complex SoS, we propose a general mod-
elling approach based on the existing modelling con-
cept of the IoT-PML, which we extended with the
concept of projectors. The reference implementation
is based on UML, therefore we provide our own tex-
tual representation with an underlying graph database.
3.1 Methodology
We used an entity–relationship modelling approach
that uses common, abstract entities of IoT systems.
The approach is SysML (v2) oriented, but we provide
slightly more concrete modelling artefacts, oriented
towards IoT systems. Examples include: Express-
ing system boundaries, required for safety analysis, or
distinguishing between hardware and software com-
ponents. The main goal of the chosen approach is
to bridge the different domain-specific models within
IoT development and operation. However, it is impor-
Energy Monitoring Systems Analysis and Development: A Case Study for Graph-Based Modelling
187
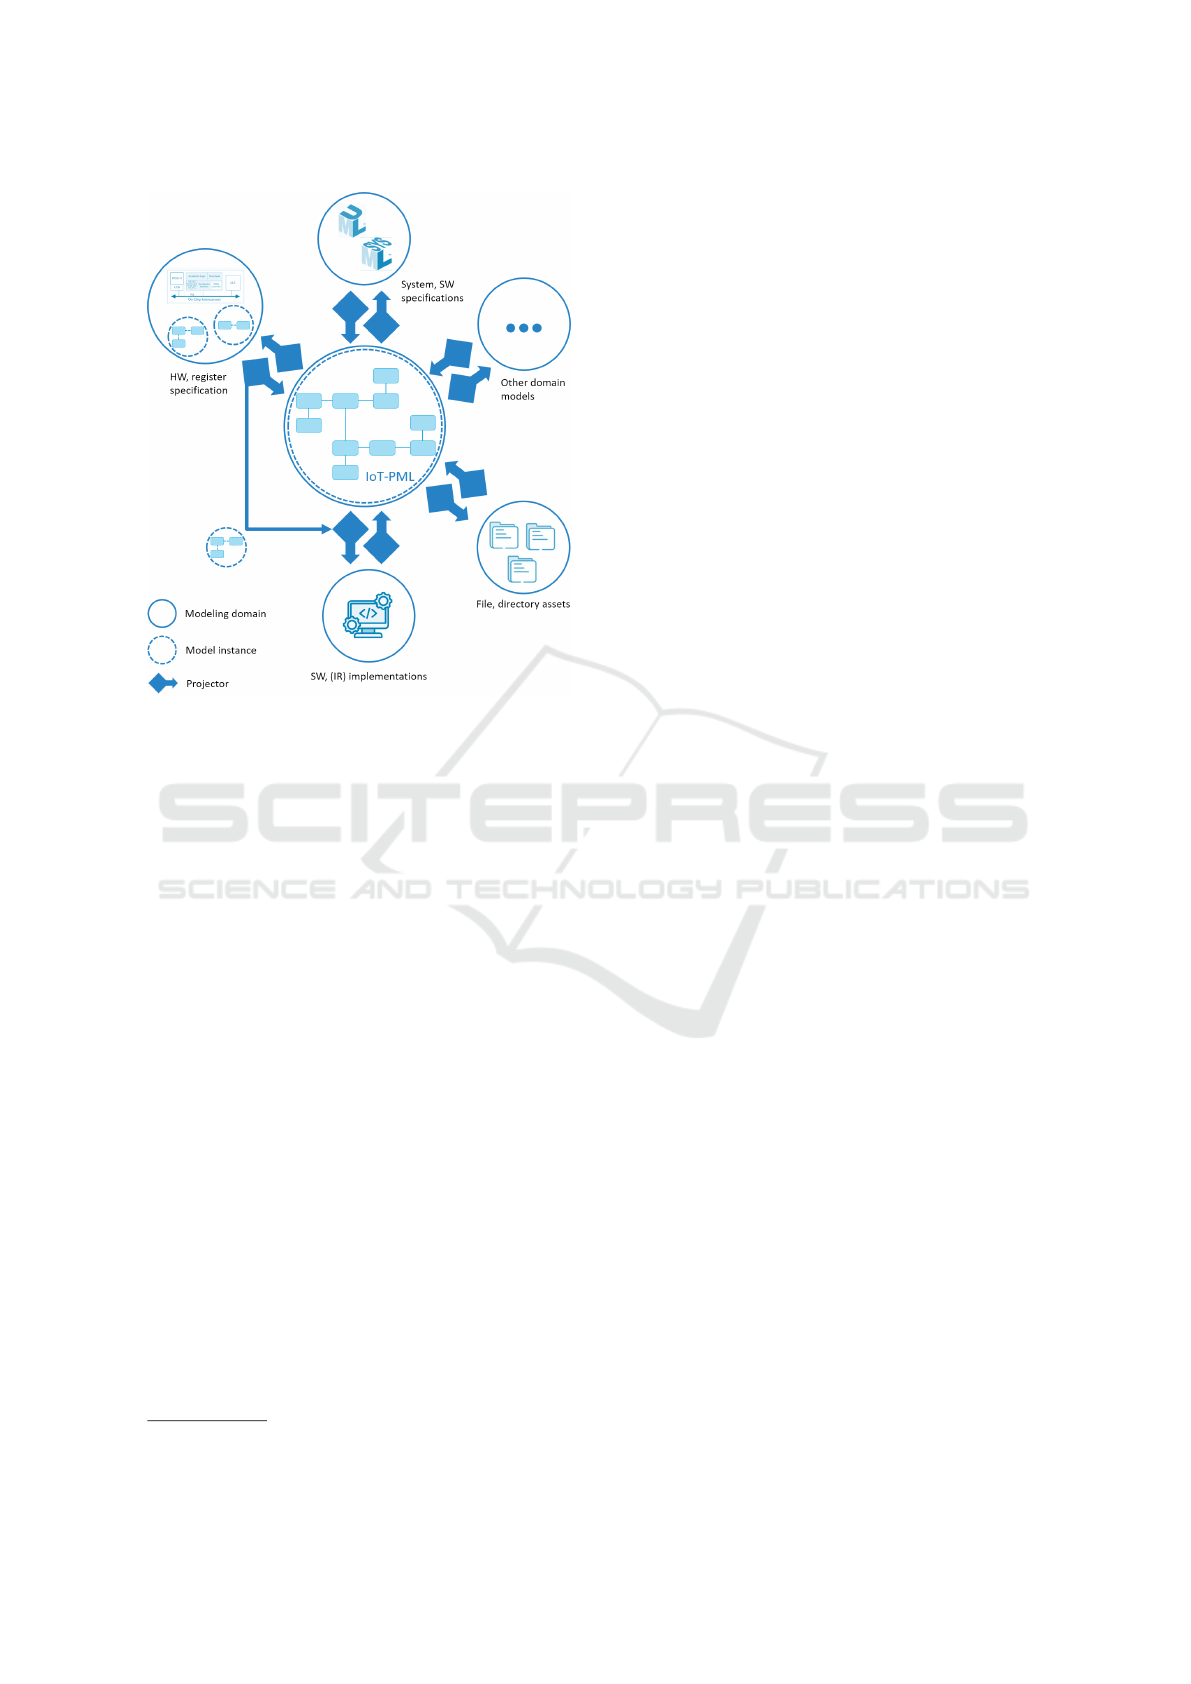
Figure 1: IoT-PML based modelling methodology.
tant to note that the aim of the modelling methodology
is not to integrate all information in a common model.
Our goal is to bridge various models in the IoT
DevOps cycle and to provide transferability of redun-
dant information. Therefore, only model entities that
foster the connection of different domain models are
considered. One example of the use case is hardware
register information. This is present in various hard-
ware models, e.g., in IP-XACT
1
, but is also required
in the software development, e.g., to implement the
hardware abstraction layer. Similar, hardware infor-
mation, such as memory sizes are used during hard-
ware design, but are also required at the SoS level,
e.g., to configure data streams and acquisition rates.
Fig. 1 depicts the envisioned methodology. The
bridge between various domain models is an instance
of an IoT-PML model. It models domain entities and
their relations. For this reason, the IoT-PML provides
concepts (1) for general system modelling, contain-
ing entities like SystemComponent, SWComponent
or HWComponent, (2) for a rudimentary behavioural
modelling, by providing constructs for data flow
and control flow modelling as well as (3) for non-
functional properties and requirement specification –
called Non-functional Quantities (NFQ) – of compo-
nents. We build upon this modelling concept and ex-
tended it with the concept of projectors and resources.
The suggested methodology and tooling bring to-
gether top-down and bottom-up modelling. In top-
1
https://standards.ieee.org/ieee/1685/10583/
down, models are created manually via IoT-PML to
specify the underlying design concept, such as a sys-
tem or software architecture. In bottom-up, existing
design assets (software, hardware descriptions, etc.)
are automatically processed, and IoT-PML represen-
tations are generated. This can be further processed
within a IoT-PML model or used to generate new do-
main artefacts. We call the process of importing, pro-
cessing and generation information Projection.
IoT-PML contains dedicated modelling elements,
to model this automatic transformation processes, be-
ing explicitly visible in the model and the user can
track the origin of information. For instance, adding
a hardware abstraction layer (upper left corner in
Fig. 1), the model would contain a Resource element
representing the IP-XACT file, the corresponding
projector node and various HWComponents to specify
the register wall of the IP component. An important
aspect is that the projectors, especially those that gen-
erate domain artefacts from the IoT-PML model, can
use external configurations or other domain informa-
tion, mainly from the original design domain. As the
original model/file is linked to the projection(-chain)
that created the IoT-PML elements, it is easy to access
the original domain asset. This concept is illustrated
in the bottom of Fig. 1, as a separate connection for
the projector for software artefacts. It uses the IoT-
PML model and is able to access hardware informa-
tion directly in the original domain model. This is
a flexible approach applicable to any projector when
needed. It also reduces the pollution of the IoT-PML
model with information, that is better used in the ded-
icated domains and allows for a very lean meta model.
An advantage of this approach is the flexibility.
The concept can be used for different levels of ab-
straction of the SoS. The EMS use case models the
hardware interfaces, the actual software architecture
and the overall SoS architecture. The different levels
of abstraction use the same modelling concepts, such
as Interfaces. Depending on the actual model, an
interface expresses the capability of a software rou-
tine or of a complete IoT device. Similar with the
general modelling concept of NFQ, that is used to an-
notate non-functional information. The concrete se-
mantics of modelling elements depend on the actual
modeled information, such as NFQ for both memory
demands and timing demands. In the EMS use case,
both sampling and transmission periods as well as
memory characterization are expressed with NFQ.
With this contextual modelling approach, the con-
figuration of the projectors becomes more important.
A projector works on the IoT-PML meta model level.
It processes the given information but, if it is semanti-
cally incorrect, the projector will not generate mean-
MODELSWARD 2025 - 13th International Conference on Model-Based Software and Systems Engineering
188

Figure 2: Structure of the grismo modelling environment.
ingful assets or will terminate irregularly. Domain-
specific checks are used to ensure that the extracted
model elements contain the information required by
the generator. This domain adaptation is provided to
the projectors via an external configuration.
3.2 Realization
To evaluate the modelling approach, we provided
a textual representation of the IoT-PML. We use
Langium
2
to implement the grammar and the abstract
syntax tree. Fig. 2 shows the architecture of our edi-
tor: grismo – graph based IoT systems modeling.
With this grammar, the developer programs IoT-
PML via a textual representation, strongly supported
by auto completion and syntax checking in Visual
Studio Code
3
. This user scenario is depicted as blue,
stitched line in Fig. 2. The user scenario presents a
top-down approach, where the user manually speci-
fies the IoT-PML model. The model is projected to a
graph database; for which we use Neo4j
4
. The various
modelling elements are expressed as tagged nodes.
The tags are similar to the IoT-PML meta model ele-
ments. The graph database is the golden reference of
the modelling approach. Changes to the textual rep-
resentation are not manifested as long the file is not
projected once more to the graph database. By also
modelling the projector as well as the original file, in
the graph, changes can be tracked and an overview of
where the information is originating from is kept.
The bottom-up use case is depicted with the green
dotted flow. Domain assets are projected to a textual
representation of the IoT-PML. This enables user to
explore which information is present in the IoT-PML.
Afterwards, the IoT-PML representation is transferred
to the database, similar to the manually created files.
2
https://langium.org
3
https://code.visualstudio.com
4
https://neo4j.com/
This way the extracted information can be checked
by the user, before committing to the graph data base,
and be used for further linkage or asset generation.
One of the main motivation of the approach is
to support the IoT system design and operation with
asset generation, e.g., for firmware code or ROS
5
stubs for SoS interconnection, or automation for de-
sign artefacts like virtual prototypes. In Fig. 2, this
is depicted as the purple arrows. For asset generation
the projectors directly operate on the graph database.
With the help of Cypher queries, complexes data as-
sociations can be extracted from the graph and pro-
vided to the projector. Dependent on the projec-
tor, this will be used to generate the design assets.
Currently, mainly template-base projectors are imple-
mented. The Langium framework provides a dedi-
cated library for text/code generation. Approaches
based on large language models (LLM) are currently
evaluated. The information flow stays the same, only
instead of generating the asset directly, a prompt is
generated and/or iteratively refined.
3.2.1 Discussing UML and SysML v2
We use the IoT-PML (SparxSystems Software GmbH,
2020), a domain-specific application of the Uni-
fied modelling Language (UML)
6
conforming to
the OMG Meta Object Facility (MOF)
7
. Restrict-
ing UML is used by various approaches (Arslan
et al., 2023; Thramboulidis and Christoulakis, 2016;
Robles-Ramirez et al., 2017) for IoT development, of-
ten with specialized stereotypes. We decided to im-
plement our own DSL, since with the provided profile
we would also inherit the UML features. Another mo-
tivation is to use a textual representation in combina-
tion with the graph database backend, to handle com-
plex models, necessary for the bottom-up approach.
The use case was also modeled in SysML v2.
SysML v2 offers a slighty more abstract mod-
elling approach as IoT-PML. SystemComponent,
SWComponent and HWComponent are modeled as Part-
Usage. Since we desired a more concrete tagging of
components, we extended SysML v2 with a library. In
the first approach, we used dedicated PartDefinitions
for the various components. With the FeatureTyping
relation, we could derive the corresponding compo-
nent type. However, this typing approach was not vis-
ible on the first glance for the user. It was necessary to
track the inheritance relations, to see what type of Par-
tUsage has applied. A second approach used custom
meta data definitions, for IoT-PML types. It provided
5
https://www.ros.org/
6
https://www.omg.org/spec/UML/
7
http://www.omg.org/spec/MOF/2.0/
Energy Monitoring Systems Analysis and Development: A Case Study for Graph-Based Modelling
189

the required visibility of the various IoT-PML types,
however the SysML v2 syntax with the clear separa-
tion of PartUsage and PartDefinitions was weakened.
It was not explicitly visible for the user what type a
meta definition is implemented. Therefore, we de-
signed a DSL oriented at IoT-PML.
4 CASE STUDY - Cloogy® EMS
In this section we demonstrate the use of the IoT-PML
in the life cycle of the Cloogy® EMS. The use of IoT-
PML provides a lean meta model able to address var-
ious levels of abstraction and life cycle phases.
Cloogy® (Pires Klein et al., 2020) is an EMS that
monitors and controls residential energy. They consist
of a set of distributed devices, including power clamps
(connected to the power supply), smart plugs, multi-
sensor devices, and hubs. A hub is responsible for
managing these devices, acquire measurements from
the sensors and provide access to the aggregated data.
The number of devices is arbitrary and limited to
the Hub capabilities. To circumvent the Hub limita-
tions, several hubs can be considered, each one work-
ing independently as an individual EMS. The devices
might consider different types of protocols. Most of
the devices connect via Zigbee 3.0, some using Mod-
bus essentially for debugging (VPS, 2017). The Hub
remotely manages other devices. It receives data col-
lected from a wide range of sensors and transmits it to
a server. The collected data includes energy consump-
tion, weather conditions and any other measurement
obtained from the devices configured to communicate
with the Hub. It does not require continuous internet
connection, being able to store collected data during a
configurable period of time (Pires Klein et al., 2020).
Device measurements is attained in two ways: ei-
ther the hub requests periodically, or the device is con-
figured to regularly report. The periodic acquisition of
measurements is imperative in these systems since the
sensing devices do not store any data, and only replies
with the latest sensor reading. The concept of acquir-
ing measurement data from the sensors by the hub is
named as data tags. Each data tag stores data from
a specific measurement type, from a specific device,
using a data type that depends on the measurement
that is being read. Each time the Hub makes a request
of a measurement from the device, the acquired value
is stored in the hub with the corresponding tag. Each
acquisition returns a 32 bit value. Measurements us-
ing data types of more than 32 bits (e.g. 64 bits integer
or floating point) require more acquisitions to obtain
a single measurement (VPS, 2017).
Since the hub is the managing and storing device,
it is important to verify if the system is designed in
a way that it can efficiently retrieve, store and upload
measurements during the operation phase of the sys-
tem. Which means that the design must take into ac-
count the system limitations. A hub can only man-
age a certain number of tags (e.g. Cloogy® is lim-
ited to 240 tags). A hub stores measurements as most
as its non-volatile memory can hold. The hub uses
a memory with circular page buffers of 2KB, stor-
ing up to 81,920 acquisitions. When space is needed
(ergo a new acquisition is performed), the oldest page
is deleted, which might result in loosing 2KB of infor-
mation (e.g. 512 acquisitions of 32 bits) (VPS, 2017).
This makes memory management an important as-
pect when configuring the IoT system, to guarantee
that continuous information is kept until it is sent to
the server or database. The design methodology of
the system should allow the specification and analy-
sis of the measurements, the acquisition periods and
the upload period that respects the system limitations.
The design and development of Cloogy® EMS is
still a semi-manual process. Each house is designed
and analysed almost from scratch. The MDD ap-
proach provides three advantages. One, it enables the
definition of multiple house systems, each house with
multiple, different devices. Second, it enables the
analysis of the system configuration, to guarantee that
limitations (e.g. memory space), and potentially other
non-functional requirements, are respected. Third, it
enables easier system configuration and code gener-
ation based on the model, the specified configuration
and the results of the automated analyses.
The configuration includes the devices network,
the tags specification, the acquisition periods per tag
and the upload period of acquired measurements.
From these, we highlight the importance of having an
automated approach for identifying acquisition peri-
ods and to adjust of the upload period to guarantee a
viable acquisition of values. Considering the several
sensing devices one EMS might have, it is imperative
that an analysis phase either verify and confirm that
the predefined measurements are acquired and stored
correctly during the upload period, or calculate and
suggest adequate acquisition periods to the developer.
4.1 IoT-PML for Cloogy® EMS
Here we show the IoT-PML methodology with three
model excerpts: (1) the general system architecture
model – top down approach, (2) the annotation of
NFQs, the basis for the schedulability analysis – do-
main asset generation, and (3) the hardware abstrac-
tion interface modelling – bottom-up approach with
the import of domain assets. While (1) and (2) are
MODELSWARD 2025 - 13th International Conference on Model-Based Software and Systems Engineering
190
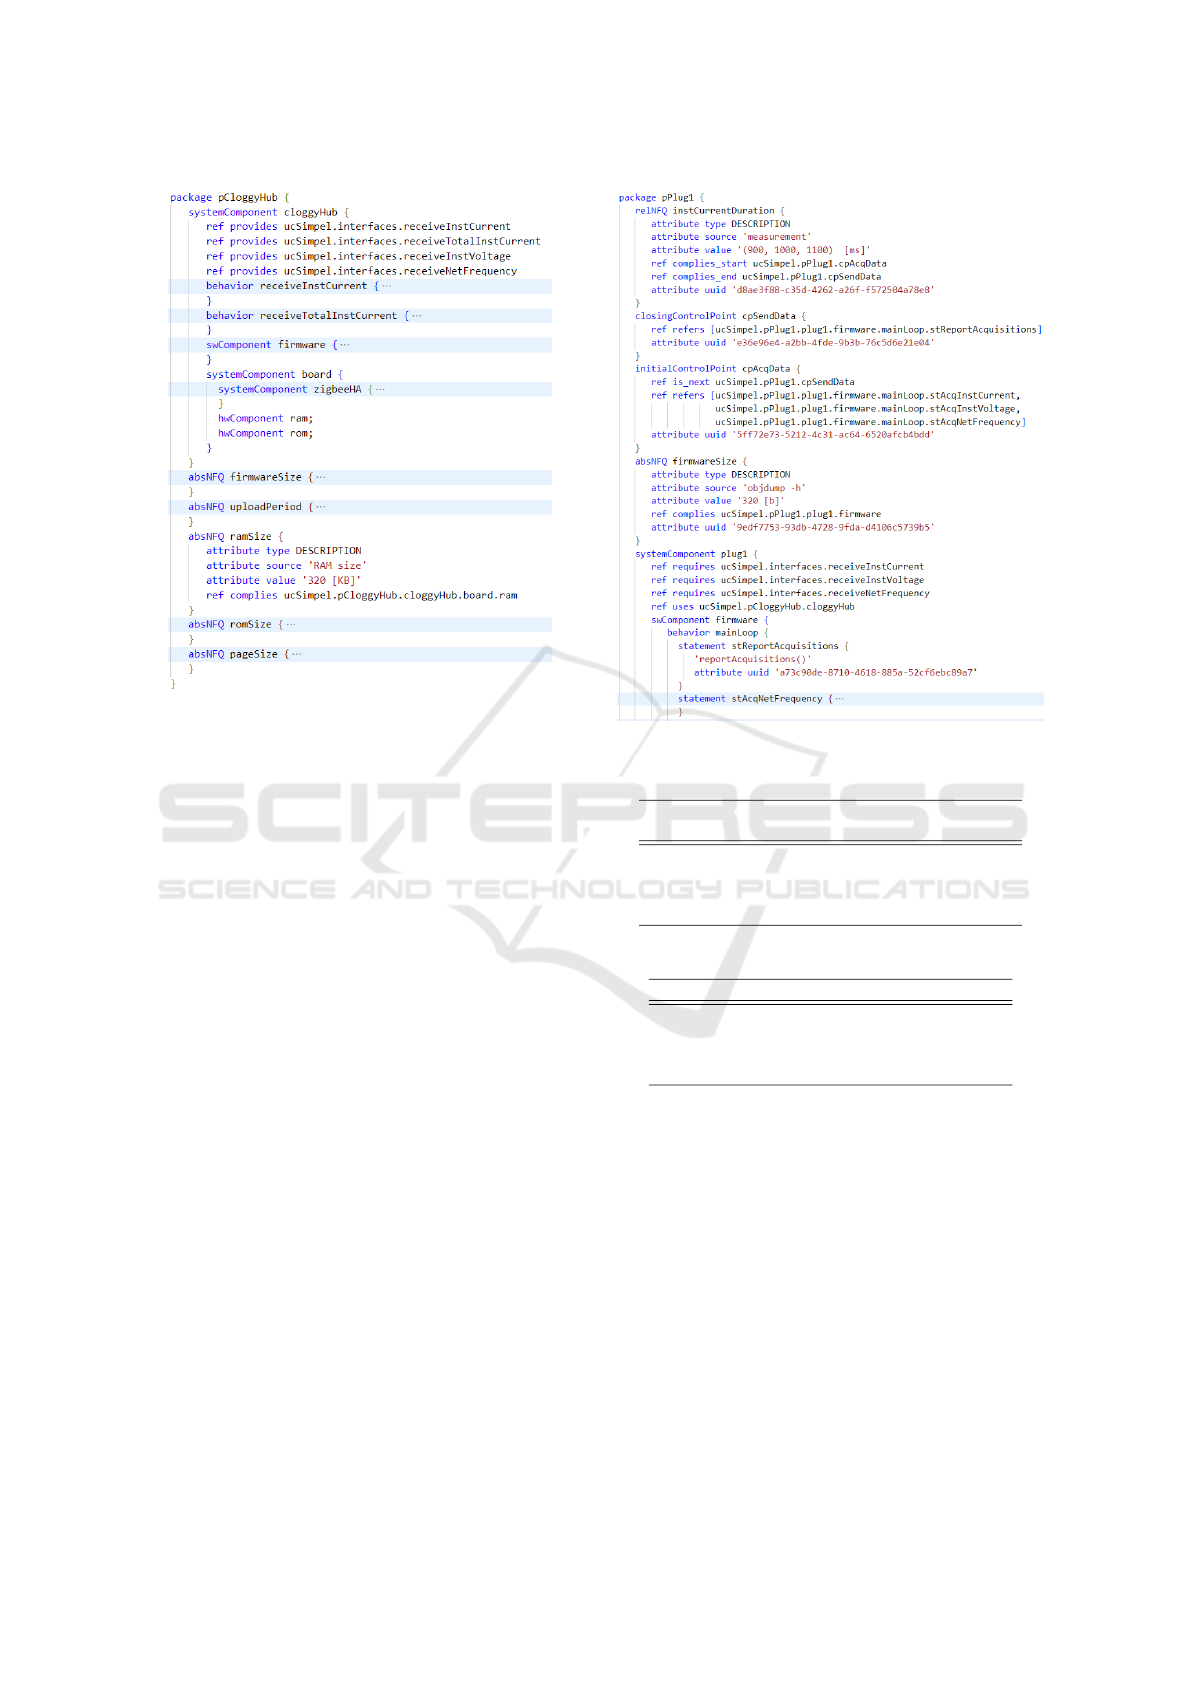
Figure 3: Excerpt of the Cloogy® hub model in IoT-PML.
operating on the system architecture, (3) operates on
the hardware and software architecture.
(1) General System Modelling: To show the cho-
sen level of details of the IoT-PML modelling ap-
proach, the first discussed model excerpts focus on
the general system modelling. It is the core concept of
the IoT-PML. It specifies the system architecture that
is then extended with functional specifications, non-
functional annotations, control flow models as well
as resource and projector asset models. Fig. 3 shows
a model instance of a hub. It is modeled as System-
Component because it belongs to the system under
consideration (SuC). To model components that do
not belong to the SuC, e.g., external services using
the aggregated information from the hub (upload for
data offloading), the Element is used to differentiate.
This is relevant for safety and security considerations,
where the SuC boundaries are important. It can also
be seen in the excerpt, that the IoT-PML offers the
well-established approach of hierarchical models. In
the excerpt, the hub is further divided in HW and
SW components. Because of the dedicated stereo-
types, we can ensure a semantically correct hierarchy.
To model the interconnection between components,
we use the composite structure approach from UML,
with provided and required interfaces. In the excerpt,
the hub provides interfaces to receive various sensor
information, such as total instant current. The vari-
ous sensor devices, like the plug in Fig. 4, require this
interface and use the corresponding component.
For the analysis in Section 4.2 we consider vari-
Figure 4: Excerpt of the plug model in IoT-PML.
Table 1: Devices and acquisitions per house.
id
Devices
(sensors)
Acquisitions 32b acq. 64b acq.
single 2(1) 5 5 0
simple 5(4) 23 20 3
complex 22(21) 108 86 22
all tags 50(49) 240 190 50
Table 2: Metrics using IoT-PML.
id #nodes
Components
NFQs
Relations
single 47 11 7 114
simple 95 21 15 254
complex 320 74 49 912
all tags 684 158 105 1976
ous system complexities. These system architectures
are described in Table 1, and represent different levels
of complexity of a Cloogy® EMS. A system always
consists of one hub, with multiple sensors. The ap-
proach helps to easily instantiate various system ar-
chitectures, by just instantiating new sensor and con-
nect them to an existing hub or instantiate a complete
sub system, e.g., representing a household.
Fig. 5 shows how a component can be instantiated
multiple times in our tooling environment. With a sin-
gle component (in this case an SystemComponent for
another plug) the projector (projecting the text to the
neo4j database) will create a deep copy of the refer-
enced component. The basic behaviour of this pro-
jector is that a deep copy of the contained compo-
Energy Monitoring Systems Analysis and Development: A Case Study for Graph-Based Modelling
191
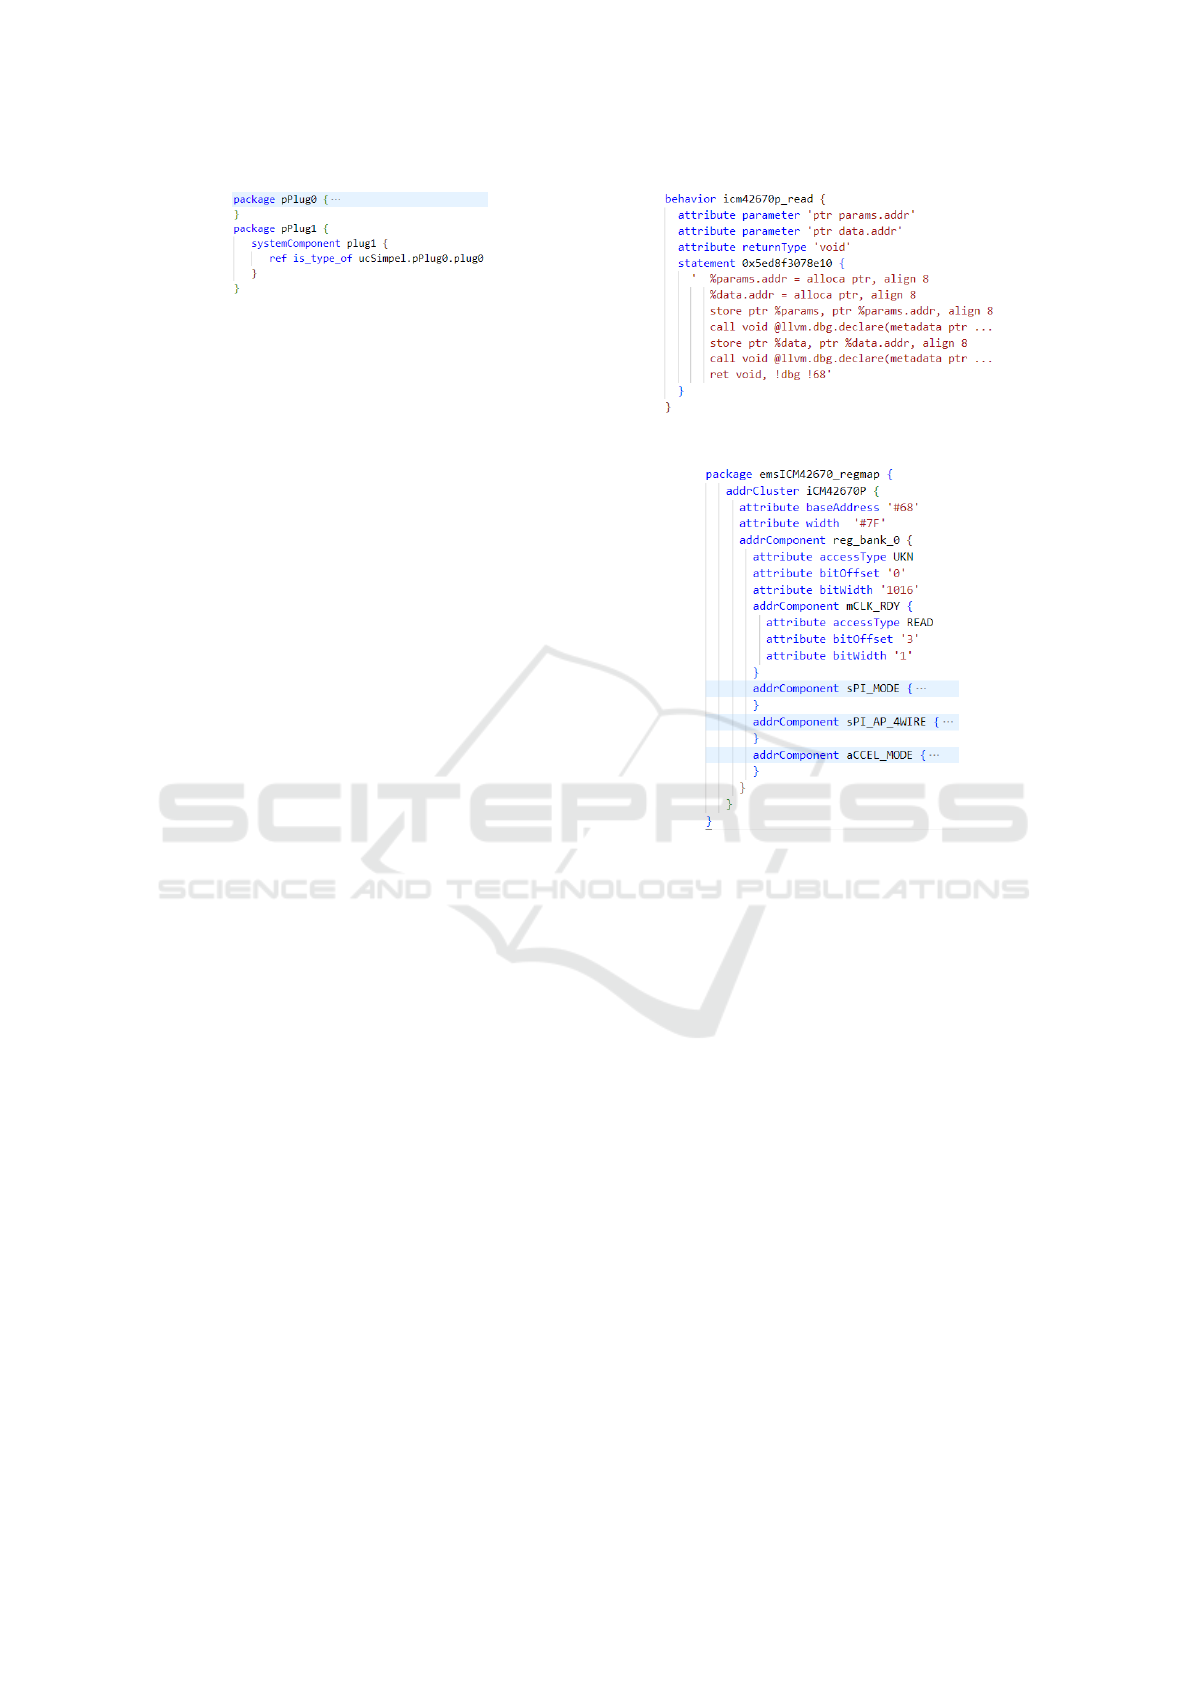
Figure 5: Excerpt of the creation pattern in IoT-PML.
nents will be created (hierarchy), but other relation-
ships will be a reference to the already existing nodes.
In the context of the EMS example, we configured the
projector to also copy nodes that have a complies and
refers relationship with nodes that are newly created.
This way, we also clone the non-functional annota-
tions (see Fig. 4). This ensures that IoT-PML::NFQ
and ControlPoint (see next excerpt) are also copied.
This demonstrates the proposed method of do-
main customization of projectors that operate on an
abstract, general model. This deep cloning approach
reduced the effort for design exploration significantly,
compared to the semi-manual process. After nodes
are cloned, adjustment to properties can be made,
and the new components can be blueprints for further
copies. This is done by serializing a selection of the
graph to the textual representation, make changes and
then project it back to the graph representation (the
blue, stitched line in Fig. 1). The export, projection
from neo4j to the textual representation, can be recog-
nized at the UUID added to each node. Table 2 shows
the amount of nodes created in the database. Here
lies also a huge benefit in the graph database, because
views are generated dynamically (force based layout)
based on different queries. Examples are, to show all
packages or software components or all NFQs associ-
ated with a dedicated component.
(2) NFQs: annotate a system architecture with
non-functional properties or requirements. Absolute
NFQs are to annotate a single element. In the hub,
e.g., the ROM and RAM size are annotated. Fig. 3
shows the annotation of the actual RAM size to the re-
lated HWComponent. This is another example, where
the semantic depends on the model instance, and is
not predefined by the meta model. The domain-
specific projector, configuring the analyses, imple-
ments checks to ensure the correct semantic.
Relative NFQs are used to annotate characteriza-
tion spanning two elements, as shown in Fig. 4. One
example (used in the EMS use case) is the annotation
of timing properties between two statements, respec-
tively two control points. We use the ControlPoint to
express control flow between statements. This way,
the Statement could be used to model an abstract
syntax tree (AST) or simply a collection of state-
ments and the ControlPoint establish various control
flows on top, e.g., in the presence of varying execu-
tion traces. In the EMS example, the time between
Figure 6: Excerpt of software model extracted from LLVM.
Figure 7: Excerpt of register model of sensing device.
repeated acquisition operations are annotated with a
time interval, resulting in a sampling period. There-
fore, the statement that presents the acquisition opera-
tion is annotated with two control points and a relative
NFQ is used to specify the actual time interval. The
same concept can be used to express the duration of
one acquisition execution, the average send duration
or general the execution time between two statements.
This is another example, how a simple meta model
concept can be used to express various facts.
(3) HW/SW Interface Modelling: here the bottom-
up design flow is shortly highlighted. Fig. 6 shows the
projection of an LLVM intermediate representation.
Previously defined software architecture can be con-
cretized when implementation artefacts are present
and support a later timing analysis, e.g., with an
instruction set simulator to annotate timing on ba-
sic block or function level. The excerpt uses IoT-
PML::RelNFQ and ControlPoint. The second exam-
ple shows register information, projected from a do-
main model, regarding IP description, see Fig. 7. This
information is used to generate the hardware abstrac-
tion layer, setter- and getter-function, if there is not
already a library provided. In case a library is pro-
MODELSWARD 2025 - 13th International Conference on Model-Based Software and Systems Engineering
192

Figure 8: Neo4j graph excerpt of the register model.
vided, selected information, such as the base address
are used to configure the library. The approach ori-
entates strongly on the UML-based version provided
by K
¨
uhlwein et al. (K
¨
uhlwein et al., 2019). The
last point to highlight is the underlying neo4j model.
Fig. 8 shows the model excerpt for the register model.
It consists of two resource nodes, in yellow, repre-
senting the involved files, the original domain model
characterizing the IP, and the derived textual IoT-PML
file. The first projector ‘proj0’ extracts relevant infor-
mation from the domain model and generates the tex-
tual IoT-PML specification, presented in Fig. 8. This
is afterwards projected to the neo4j database (proj1)
generating the various nodes. This way, it is clear for
the user, where information originates and a change
tracking can be established.
This concludes the excerpts highlighted in the pa-
per. We can support top-down and bottom-up spec-
ifications and various domain models. By linking
this information in a common model, dependency
tracking can be realized, to track the effect of design
changes. Also, with various domain-specific projec-
tors, the overall design effort can be reduced.
4.2 Analysis and Configuration
From the model definition, the development phase
considers two subsequent phases: analysis and gen-
eration. At this stage, both phases are highly specific
to the domain, and even more specific to the actual use
case. The analysis phase verifies if the model respects
the requirements and the limited resources of the sys-
tem. It will validate the configuration of the system,
including the expected device instances, device mem-
ory capacity and the system communication, specif-
ically the measurements acquisition and storage. In
this phase, it is important that the analysis guarantees
measurements acquisition rates in a stable manner and
without the loss of information within the specified
upload period. The code generation is expected to
generate software and device configurations based on
pre-designed code templates, the defined model and
the report provided by the analysis phase.
The analysis expects as input the system definition
and additional non-functional system requirements.
The first step of this phase is to project the IoT-PML
model as a JSON domain model. Essentially, this
converts into a format that only contains the data nec-
essary for the analysis. The next step is to extract
some metrics from the devices, the connections, the
specified measurements, and the acquisition config-
uration. With these metrics, a first analysis is per-
formed that validates devices requirements, in an in-
dividual manner. This includes, for instance, verify-
ing if the current firmware or software specification is
adequate for the device. Then, a system overall vali-
dation is performed, where the connections, measure-
ments, and memory storage are validated. Based on
these analyses, a report is generated that can be used
for visualization and for the code generation phase.
Two processes can be considered for the valida-
tion and configuration of acquisition periods: an eval-
uator or a provider. The first validates user-defined
configurations, and the second provides automatic
configurations according to system limitations.
Configuration Evaluator: validates if a specified
measurements acquisition configuration is adequate
for storing in the Hub during an upload period, as por-
trayed in Equation (1). This equation can be read as
the sum of all (n) number of acquisitions, times the
data size of that acquisition Ds
i
, must be less than the
size of the non-volatile memory of the Hub Hm minus
a page buffer size Pb (2KB). The number of acquisi-
tions of a given measurement is given by the upper
bound of the division between the upload period U p
divided by the acquisition period Ap
i
.
n
∑
i
U p
Ap
i
∗ Ds
i
≤ Hm − Pb (1)
This formula takes into account several require-
ments, following a worst-case scenario to always
guarantee enough space to store all possible acquisi-
tions. The ceiling bound for the number of acquisi-
tions guarantees that we have a more certain number
of acquisitions. The analysis always considers that
one page buffer of the Cloogy® memory must be left
out. This requirement guarantees that we do not lose
the measurements acquired at the beginning of the up-
load period, since for a single new reading over a full
memory might lead in the loss of 2Kb of information.
Energy Monitoring Systems Analysis and Development: A Case Study for Graph-Based Modelling
193

The result is an artifact to be used by the genera-
tion phase and to feedback the model, and includes:
• Number of acquisitions per measurement
• Expected total size used by each measurement
• Acquisitions loss if not able to store everything
Configuration Provider: an ideal approach when the
developer does not have a specific idea for the config-
uration, or when the system is too dense to be man-
ually specified. It calculates adequate measurements
acquisition periods, taking into account the number
of devices, the specified measurements to be acquired
for each device, the upload period that is specified,
and optionally a set of time ranges for the acquisi-
tion periods. Furthermore, the approach accepts ini-
tial configurations for the acquisition periods, from
which the configuration provider can use as hints for
the initial search line. Two approaches can be consid-
ered: a fairness approach and a balanced approach.
The fairness approach calculates a constant acqui-
sition period, that will be shared between all the mea-
surements acquisition. Taking this into account, the
approach adapts Equation (1) to consider a constant
acquisition period Aq instead of one acquisition pe-
riod per measurement acquisition Aq
i
(i.e., Aq
i
==
Aq
i+1
). We can assert that the values of all variables
in the equation are satisfied except for the Aq variable,
the one we intend to calculate. We can then change
the formula and put Aq in evidence, as presented in
Equation (2). The acquisition period will be the ceil-
ing value of the division between the sum of all data
sizes, times the upload period, and the memory space
bound. This guarantees that all measurements will be
acquired within the same rate, independently of the
data size required by a measurement.
Ap =
∑
n
i
Ds
i
∗U p
Hm − Pb
(2)
The second approach takes into account the data
sizes. This issue is reduced into an optimization prob-
lem, more specifically a ”Mixed Integer Nonlinear
Programming” (MINLP) problem, where the maxi-
mization formula (memory usage) is Equation (1),
trying to minimize acquisition periods Ap
i
and the di-
vision U p by Ap
i
makes it a NLP problem.
We use the GEKKO library (Beal et al., 2018) as
the solver, providing Equation (1) as the maximiza-
tion problem, and the acquisition periods Ap
i
as the
variables to explore. The library outputs the sug-
gested values for the AP
i
variables, and the mem-
ory used, if a solution was found. The configuration
provider then outputs a report equal to the configura-
tion analyser.
Table 3: Configurations provided for a 48h upload period.
id
acquisition
time range
#acquisitions
range
upload
(KB)
elapsed
time(s)
single [10s, 11s] [15962, 17558] 317.99 0.13
simple [49s, 1m30s] [1926, 3467] 317.94 0.17
complex [3m54s, 7m49s] [368, 738] 317.36 1.15
all tags [8m41s, 15m43s] [183, 331] 317.36 69.18
4.2.1 Example of a Use Case Analysis
The performance of the analysis phase depends on
several factors, including the number of variables (up
to 240 variables, i.e. the maximum number of tags),
the initial setup for the analysis, and the expected up-
load period. While not a major concern on this work,
it can still impact the performance of the developing
process. In the case of MINLP, the number of vari-
ables will heavily impact its execution.
To inspect the possible impact of this analysis, we
executed the MINLP approach with a set of Cloogy®
EMS models, see Table 1. The models show an in-
crease of complexity, from a model with a single sen-
sor with five measurement acquisitions, up to 49 sen-
sors with 240 measurement acquisitions, each with
readings of 32 and 64 bits. The depicted EMS models
only consider one Hub in the system to better repre-
sent the analysis performance. This is because, while
an EMS system can consist of multiple Hubs, the ac-
quisition periods analysis is always performed at the
Hub level, and its connected devices (a sub-system).
Therefore, an EMS with N Hubs still have N analysis
to have a configuration for each sub-system.
Table 3 resumes the configurations provided by
the analyses, and the execution time to calculate and
provide a configuration, for upload periods of 48
hours. The acquisition time column shows the range
of times specified in the configuration, and it is in-
fluenced by the data size of each measurement acqui-
sition. For instance, 32 bit measurements will have
acquisition times inferior (more readings) than 64
bit measurements. All the configurations respect the
memory size restriction (maximum value < 318KB).
Regarding the time required to calculate the con-
figurations, it is possible to observe an increase of
time taken to achieve a result, specially in the case
of the maximum number of tags that took more than
one minute to calculate. On the other hand, EMS that
consider a lower number of tags are extremely faster.
To have more fine grain information of results
within an upload timeline, it is better to have less de-
vices or less types of measurements. This is an user-
defined trade-off: either have gross-grain detail for
several measurements, or a fine-grain detail for less,
well selected, measurements. Nevertheless, the anal-
ysis is able to verify if there is a viable configuration.
MODELSWARD 2025 - 13th International Conference on Model-Based Software and Systems Engineering
194

5 CONCLUSIONS & FUTURE
WORK
We have presented a modelling methodology and an
analysis approach for energy management systems,
using Cloogy® EMS as a representative use case of
a complex IoT-based system of systems. To automate
various analysis and implementation steps we use a
general modelling approach that aims to bridge dif-
ferent domain models, levels of abstraction as well
as different product life phases. The approach pro-
vides a HW/SW system tailored modelling method-
ology and implementation focusing on system enti-
ties and their relationships. By using an underlying
graph database with comprehensive query capability,
the approach can cope with a multitude of model arte-
facts. This is important when modelling SoS at differ-
ent levels of abstraction, e.g. the EMS connecting var-
ious households, and when incorporating a bottom-up
approach to consider existing design artefacts. With
the presented projector concept the approach offers
the possibility to integrate various domain assets and
enable a traceability of transformations. We provided
a DSL based on IoT-PML as user interface for mod-
elling. The provided projectors enable, a round-trip
engineering between textual representation and graph
model. For the Cloogy® EMS we automated a system
architecture analysis and implementation, by provid-
ing the modelling capability, and with the projectors
we automate various steps in the creation of models
and design artefacts. Using the modelling approach
in the design and analysis of the Cloogy® EMS we
increased manageability of the system architecture as
well as automate the analysis configuration.
The utilized IoT-PML originated from UML, with
the goal to specify software. Some concepts of the
SysML, like ports, are not covered. In future work, we
like to align further with SysML v2. In addition, the
tooling support should be further improved, covering
a graphical user interface and further projectors.
ACKNOWLEDGMENT
This work has been co-funded by the European ITEA
project GenerIoT under grant 01IS22084A-G.
REFERENCES
Alkhabbas, F., Spalazzese, R., and Davidsson, P. (2016).
Iot-based systems of systems. In Swedish Workshop
on the Engineering of Systems of Systems (SWESoS),
Gothenburg, Sweden (9th of September 2016), pages
34–37. Chalmers.
Arslan, S., Ozkaya, M., and Kardas, G. (2023). Modeling
languages for internet of things (iot) applications: A
comparative analysis study. Mathematics, 11(5).
Beal, L. D., Hill, D. C., Martin, R. A., and Hedengren,
J. D. (2018). Gekko optimization suite. Processes,
6(8):106.
Boardman, J. and Sauser, B. (2006). System of systems -
the meaning of of. In 2006 IEEE/SMC International
Conference on System of Systems Engineering.
Chooruang, K. and Meekul, K. (2018). Design of an iot
energy monitoring system. In 2018 16th Intl. Conf. on
ICT and Knowledge Engineering, pages 1–4.
Ding, J., Nemati, M., Ranaweera, C., and Choi, J. (2020).
Iot connectivity technologies and applications: A sur-
vey. IEEE Access, 8:67646–67673.
Fortino, G., Savaglio, C., Spezzano, G., and Zhou, M.
(2021). Internet of things as system of systems: A
review of methodologies, frameworks, platforms, and
tools. IEEE Trans. on Systems, Man, and Cybernetics:
Systems, 51(1):223–236.
Kim, T.-h., Ramos, C., and Mohammed, S. (2017). Smart
city and iot. Future Generation Computer Systems,
76:159–162.
Kraijak, S. and Tuwanut, P. (2015). A survey on internet of
things architecture, protocols, possible applications,
security, privacy, real-world implementation and fu-
ture trends. In 2015 IEEE 16th Intl. Conf. on Commu-
nication Technology (ICCT), pages 26–31.
K
¨
uhlwein, A., Paule, A., Hielscher, L., Rosenstiel, W.,
and Bringmann, O. (2019). Firmware synthesis
for ultra-thin iot devices based on model integra-
tion. In 2019 ACM/IEEE 22nd Intl. Conf. on Model
Driven Engineering Languages and Systems Compan-
ion (MODELS-C), pages 339–346.
Menniti, D., Pinnarelli, A., Sorrentino, N., Vizza, P.,
Barone, G., Brusco, G., Mendicino, S., Mendicino, L.,
and Polizzi, G. (2022). Enabling technologies for en-
ergy communities: some experimental use cases. En-
ergies, 15(17):6374.
Pires Klein, L., Krivoglazova, A., Matos, L., Landeck, J.,
and de Azevedo, M. (2020). A novel peer-to-peer en-
ergy sharing business model for the portuguese energy
market. Energies, 13(1).
Robles-Ramirez, D. A., Escamilla-Ambrosio, P. J., and Try-
fonas, T. (2017). Iotsec: Uml extension for internet of
things systems security modelling. In 2017 Intl. Conf.
on Mechatronics, Electronics and Automotive Engi-
neering (ICMEAE), pages 151–156.
SparxSystems Software GmbH (2020). MDG Technology
for Iot-PML.
Sundramoorthy, V., Cooper, G., Linge, N., and Liu, Q.
(2011). Domesticating energy-monitoring systems:
Challenges and design concerns. IEEE Pervasive
Computing, 10(1):20–27.
Thramboulidis, K. and Christoulakis, F. (2016). Uml4iot-
a uml-based approach to exploit iot in cyber-
physical manufacturing systems. Comput. Ind.,
82(C):259–272.
VPS (2017). Cloogy® technical information. Technical
report, Virtual Power Solutions.
Energy Monitoring Systems Analysis and Development: A Case Study for Graph-Based Modelling
195
