
Multi-Object Keypoint Detection and Pose Estimation for Pigs
Qinghua Guo
1
, Dawei Pei
1
, Yue Sun
1,3
, Patrick P. J. H. Langenhuizen
1
, Cl
´
emence A. E. M. Orsini
2
,
Kristine Hov Martinsen
4
, Øyvind Nordbø
4
, J. Elizabeth Bolhuis
2
, Piter Bijma
2
and Peter H. N. de With
1
1
Department of Electrical Engineering, Eindhoven University of Technology, Eindhoven, The Netherlands
2
Department of Animal Sciences, Wageningen University & Research, Wageningen, The Netherlands
3
Faculty of Applied Science, Macao Polytechnic University, Macao Special Administrative Region of China
4
Norsvin SA, Hamar, Norway
Keywords:
Animal Keypoint Detection, Animal Posture Recognition, Multi-Object Surveillance.
Abstract:
Monitoring the daily status of pigs is crucial for enhancing their health and welfare. Pose estimation has
emerged as an effective method for tracking pig postures, with keypoint detection and skeleton extraction
playing pivotal roles in this process. Despite advancements in human pose estimation, there is limited research
focused on pigs. To bridge this gap, this study applies the You Only Look Once model Version 8 (YOLOv8) for
keypoint detection and skeleton extraction, evaluated on a manually annotated pig dataset. Additionally, the
performance of pose estimation is compared across different data modalities and models, including an image-
based model (ResNet-18), a keypoint-based model (Multi-Layer Perceptron, MLP), and a combined image-
and-keypoint-based model (YOLOv8-pose). The keypoint detection branch achieves an average Percentage
of Detected Joints (PDJ) of 48.96%, an average Percentage of Correct Keypoints (PCK) of 84.85%, and an
average Object Keypoint Similarity (OKS) of 89.43%. The best overall accuracy obtained for pose estimation
is 99.33% by the YOLOv8-pose model, which indicates the superiority of the joint image-keypoint-based
model for pose estimation. The conducted comprehensive experiments and visualization results indicate that
the proposed method effectively identifies specific pig body parts in most monitoring frames, facilitating an
accurate assessment of pig activity and welfare.
1 INTRODUCTION
Since pigs are common livestock animals worldwide,
their health and welfare are crucial in shaping the
societal and economic landscape of the pig breed-
ing industry. To mitigate the risk of disease and in-
jury in pigs (Racewicz et al., 2021), automated mon-
itoring systems have emerged as essential tools for
assessing pig health and welfare (Yang and Xiao,
2020). These systems are typically based on video
surveillance offering non-invasive, real-time monitor-
ing, which significantly reduces the need for labor-
intensive manual inspections. In particular, this ap-
proach facilitates the detection of activity levels, pos-
tural changes, and behavioral patterns, which are of-
ten indicative of animal health and welfare status. Ac-
curately identifying these postures allows the moni-
toring and analysis of interactions between pigs, en-
abling the early detection and prevention of negative
social behavior, such as aggression or competition for
resources. Such analysis can contribute to improved
disease prevention and overall enhancement of animal
welfare (Volkmann et al., 2022; Zhuang et al., 2018).
The growing demand for animal monitoring in
commercial farms has led to the development of var-
ious methodologies related to animal pose estima-
tion. These methodologies include wearable and
physical sensors, as well as camera-based monitor-
ing systems that leverage advanced computer vision
techniques (Lee et al., 2016; Yang and Xiao, 2020).
However, the application of physical sensors presents
several practical challenges, such as the installation
and maintenance of these devices. Additionally, the
effectiveness of such sensors is influenced by the
individual characteristics of different farms, includ-
ing spatial layout, animal density, and environmental
conditions. In contrast, video-based solutions have
drawn significant attention because of their contact-
less, low-cost, scalable, and sustainable attributes.
These systems leverage advanced computer vision
techniques to analyze animal behavior without direct
physical interaction, which not only minimizes stress
on the animals but also facilitates continuous and au-
tomated monitoring. Numerous studies have investi-
466
Guo, Q., Pei, D., Sun, Y., Langenhuizen, P. P. J. H., Orsini, C. A. E. M., Martinsen, K. H., Nordbø, Ø., Bolhuis, J. E., Bijma, P. and N. de With, P. H.
Multi-Object Keypoint Detection and Pose Estimation for Pigs.
DOI: 10.5220/0013170100003912
Paper published under CC license (CC BY-NC-ND 4.0)
In Proceedings of the 20th International Joint Conference on Computer Vision, Imaging and Computer Graphics Theory and Applications (VISIGRAPP 2025) - Volume 3: VISAPP, pages
466-474
ISBN: 978-989-758-728-3; ISSN: 2184-4321
Proceedings Copyright © 2025 by SCITEPRESS – Science and Technology Publications, Lda.

gated video-based monitoring techniques applicable
to human datasets. In contrast to human pose esti-
mation, pig farming frequently necessitates the mon-
itoring of large groups in shared environments. This
requirement underscores the importance of accurately
estimating the poses of multiple animals, even under
challenging conditions where occlusion caused by the
camera perspective and pig activity may occur.
Related works: As computer vision techniques
based on deep learning garner increasing attention,
related applications within agriculture, e.g. pig mon-
itoring on commercial farms, are becoming more
prevalent (Yang and Xiao, 2020). Implementing pose
estimation for pigs using machine learning can in-
volve various types of features, including bounding
boxes, keypoints, and segmentation contours, each
serving as critical inputs for neural networks. The
selection of specific features is crucial for achieving
effective and efficient model performance.
Wutke et al. constructed a custom convolutional
neural network using keypoints to detect and track
pigs (Wutke et al., 2021). They highlighted the ad-
vantages of using keypoints compared to bounding
boxes, noting that while bounding boxes provide po-
sitional information, they fail to capture interactions
driven by specific body parts. It demonstrated that
keypoints can convey more detailed feature informa-
tion than bounding boxes, thereby enhancing the ef-
fectiveness of pose estimation models in agricultural
applications.
Keypoint data is a widely used input for machine
learning in pose estimation tasks. However, compared
to its extensive use in human-related research, there
is only a limited number of studies focused on animal
keypoint detection. Notable examples from human
pose estimation literature include OpenPose (Cao
et al., 2019), AlphaPose (Fang et al., 2022), and You
Only Look Once (YOLO) Version 8 (Jocher et al.,
2023). OpenPose is designed for human pose estima-
tion in multi-object scenarios, utilizing skeleton and
keypoint information to optimize network depth (Cao
et al., 2019). AlphaPose employs a top-down ap-
proach to achieve pose estimation (Fang et al., 2022),
that begins with bounding-box detection, followed by
the prediction of keypoints, where human poses are
derived from features extracted from the bounding
boxes. In contrast, bottom-up approaches directly de-
tect keypoints for the entire frame and subsequently
construct skeletons using these detected keypoints for
pose estimation. While OpenPose exhibits approxi-
mately twice the inference speed of AlphaPose (Cao
et al., 2019), AlphaPose achieves a higher accuracy,
reaching 57.7% on the COCO-WholeBody dataset
compared to OpenPose’s accuracy of 33.8% on the
same dataset. However, in terms of inference speed
and efficiency, both OpenPose and AlphaPose are
computationally expensive compared to YOLOv8-
pose, which is designed with efficiency and execu-
tion speed. The efficient architecture of YOLOv8-
pose further enhances its ability to handle multiple
objects simultaneously, making it a competitive op-
tion for high-speed pose estimation.
Proposed research direction: In this work, we
propose a keypoint detection algorithm specifically
designed for pigs to facilitate the performance of pos-
ture recognition for pigs. We utilize YOLOv8-pose
as the backbone framework for the keypoint detec-
tion (Jocher et al., 2023). As a result of the existing
limitations in animal research, we re-define the eval-
uation metrics that are tailored to human pose estima-
tion to pigs such that the model performance can be
assessed comprehensively. Furthermore, we employ
the YOLOv8-pose model for posture recognition of
pigs, demonstrating that the integration of the key-
point features with the image features significantly
enhances the performance of pose estimation. This
work yields the following key contributions of key-
point detection and pose estimation for pigs.
• The performance of the following pose estimation
methods is benchmarked: (1) ResNet-18 (image-
based method), (2) Multi-layer Perceptron (MLP)
(keypoint-based), (3) YOLOv8-pose (combining
image and keypoint features).
• Suitable evaluation metrics are re-defined specif-
ically for animals, which are sourced from re-
search on human pose estimation. The SOTA
detection model YOLOv8-pose is implemented
to perform multi-object keypoint detection of pig
body parts.
• Two pig datasets are specifically constructed for
proper validation and based on manual annota-
tion: (1) The Norwegian dataset provides the
ground-truth information in bounding boxes, seg-
mentation contours, keypoints, and skeleton in-
formation, and (2) The German dataset offers
ground-truth information in bounding boxes, key-
points, skeletons, and posture labels.
2 METHODS
2.1 Data Description
The proposed work is based on two collected video
datasets, called the Norwegian and German datasets,
which are used for keypoint detection and pose esti-
mation, respectively.
Multi-Object Keypoint Detection and Pose Estimation for Pigs
467
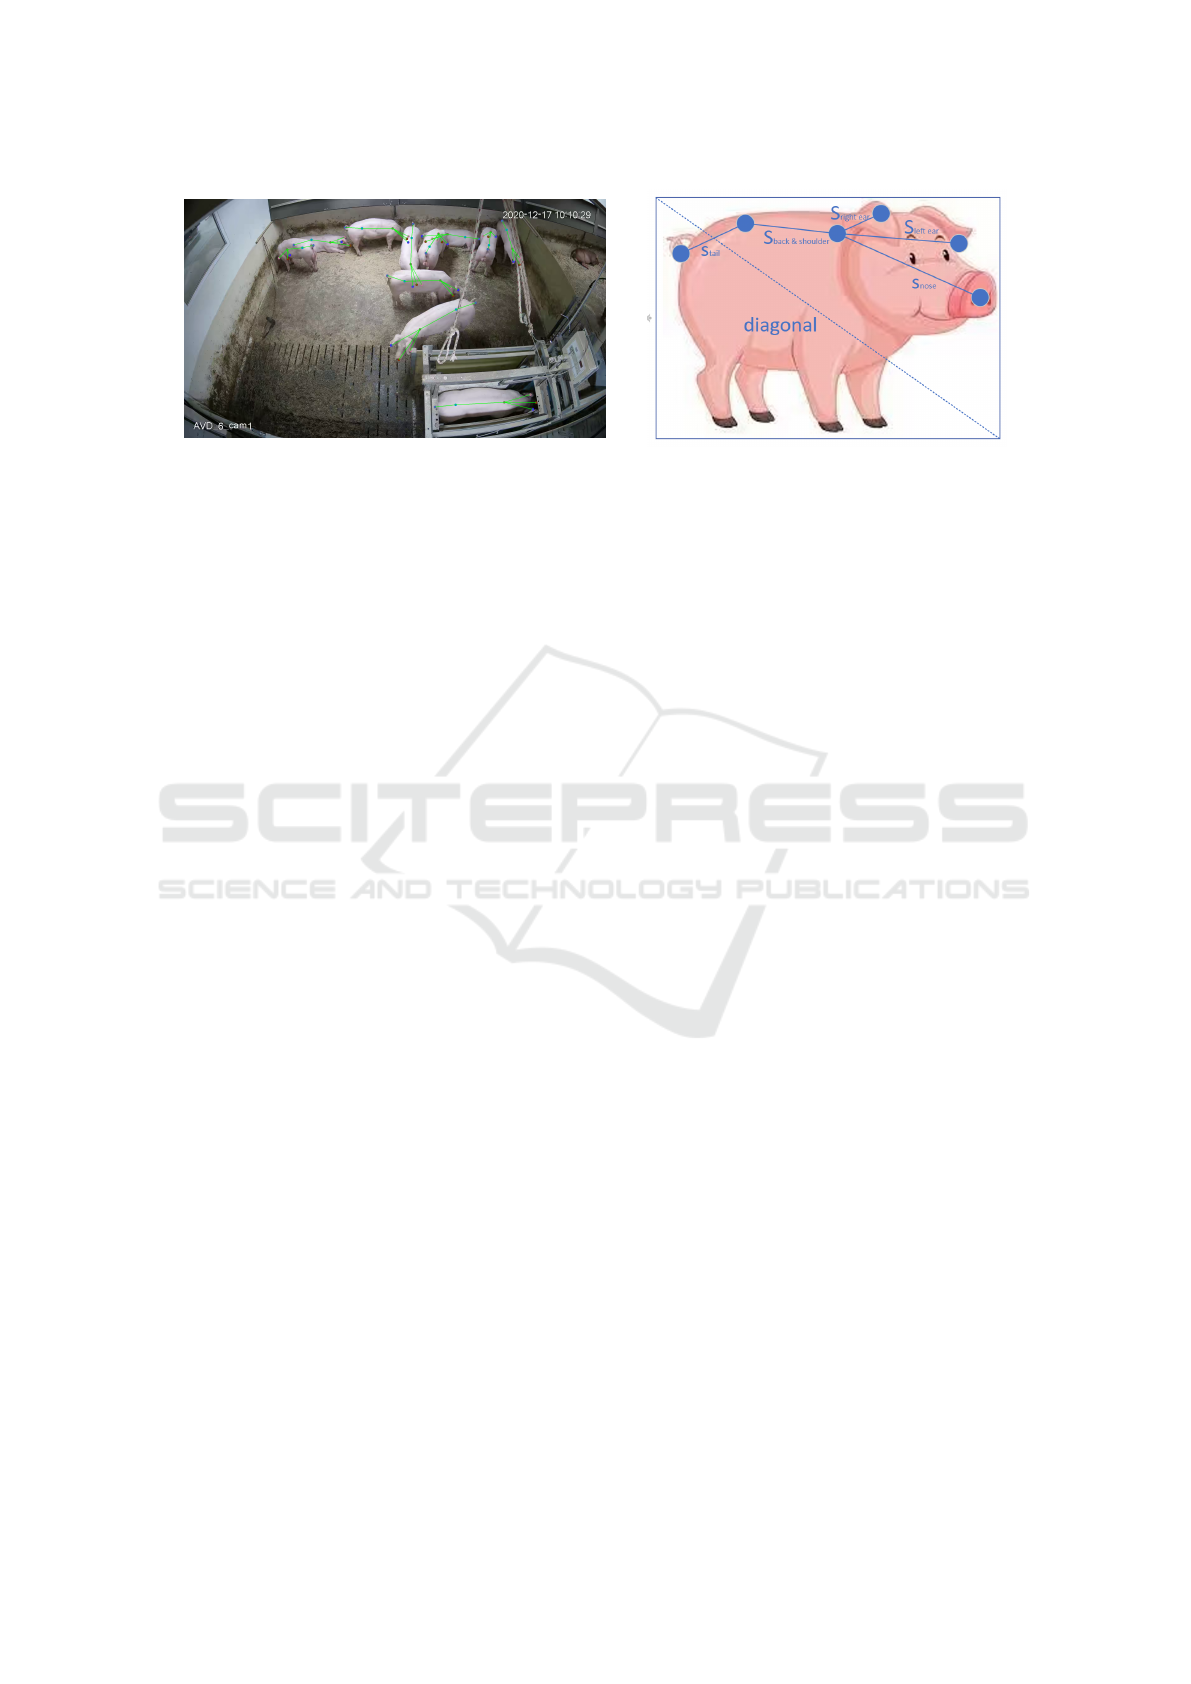
(a)
(b)
Figure 1: Localization information for six keypoints, indicating the tail, back, shoulder, nose, left ear, and right ear. (a) Sample
frame showing the annotated keypoints along with the corresponding skeleton, highlighted in green. (b) Visualization of the
criteria used for pig keypoint annotation.
The Norwegian dataset utilizes videos which are
captured from the Genes2Behave project (321409 -
IPNÆRINGSLIV20, G2B). This dataset comprises
1,191 randomly selected frames from Norsvin SA,
with an image resolution of 2,688×1,520 pixels. A
sample frame with visualized keypoints and skele-
tons is shown in Fig. 1(a). The manual annotation
of Norwegian data is in the COCO format, covering
the bounding box, segmentation contour, keypoints,
and skeleton information. There are 6 keypoints an-
notated for each pig, i.e., tail, back, shoulder, nose,
left ear, and right ear. Fig. 1(b) provides an illustra-
tive example of the annotated keypoints and their cor-
responding skeletons.
The pose estimation utilizes the German dataset,
which comprises five videos containing 876 frames.
Each frame is captured at a resolution of 1280×720
pixels. Annotation within the dataset is in the COCO
format, including the bounding box, keypoints, and 3
posture class labels, i.e., lying, sitting, and standing.
The postures are defined according to an ethogram
developed by animal scientists at Wageningen Uni-
versity & Research. Standing is labeled if pigs are
supported by three or four stretched legs. The pos-
ture is labeled as lying if pigs are lying centrally or
on a side, potentially with legs tucked underneath the
body. If the pig body is supported by hindquarters
while the front legs are stretched, the posture is de-
fined as sitting.
2.2 Keypoint Detection
2.2.1 Network Architecture Overview
In the YOLOv8-pose architecture, the backbone net-
work is constituted by the Cross-Stage Partial Net-
work (CSPNet), while the neck network is repre-
sented by the combination of the Feature Pyramid
Network and the Path Aggregation Network (FPN-
PAN), and the head network is implemented as
PANet. The CSPNet, which is based on DenseNet,
employs a cross-stage hierarchy and is characterized
by reduced memory consumption and rapid inference
speed (Wang et al., 2020). The FPN-PAN architecture
uses both top-down and bottom-up approaches for
up-sampling and down-sampling, enhancing feature
extraction through increased diversity and complete-
ness (Niu and Yan, 2023). Furthermore, YOLOv8-
pose adopts a decoupled head structure for object de-
tection, utilizing distinct branches for object classi-
fication and bounding-box prediction (Niu and Yan,
2023).
Loss functions: The weighted loss is shown in
Fig. 2, the YOLOv8-pose model improves its predic-
tions for both object detection and pose estimation by
minimizing the total loss. The localization loss mea-
sures how well the predicted bounding boxes fit the
ground-truth boxes using the Complete Intersection
over Union (CIoU) loss. The classification loss uses
the Binary Cross-Entropy (BCE) loss to predict the
object loss. The objectness loss indicates how confi-
dent the model is that a particular box contains an ob-
ject, YOLOv8-pose uses BCE loss with Logits for the
objectness prediction. The keypoint/pose loss mea-
sures the Mean Squared Error (MSE) loss between the
predicted and ground-truth coordinates of each key-
point.
2.2.2 Evaluation Metrics
The field of keypoint detection for pigs currently lacks
standardized evaluation metrics tailored specifically
for animal subjects, since most existing metrics are
designed primarily for human data. Drawing inspi-
ration from SOTA methods used in human keypoint
detection, we re-define several evaluation metrics to
VISAPP 2025 - 20th International Conference on Computer Vision Theory and Applications
468
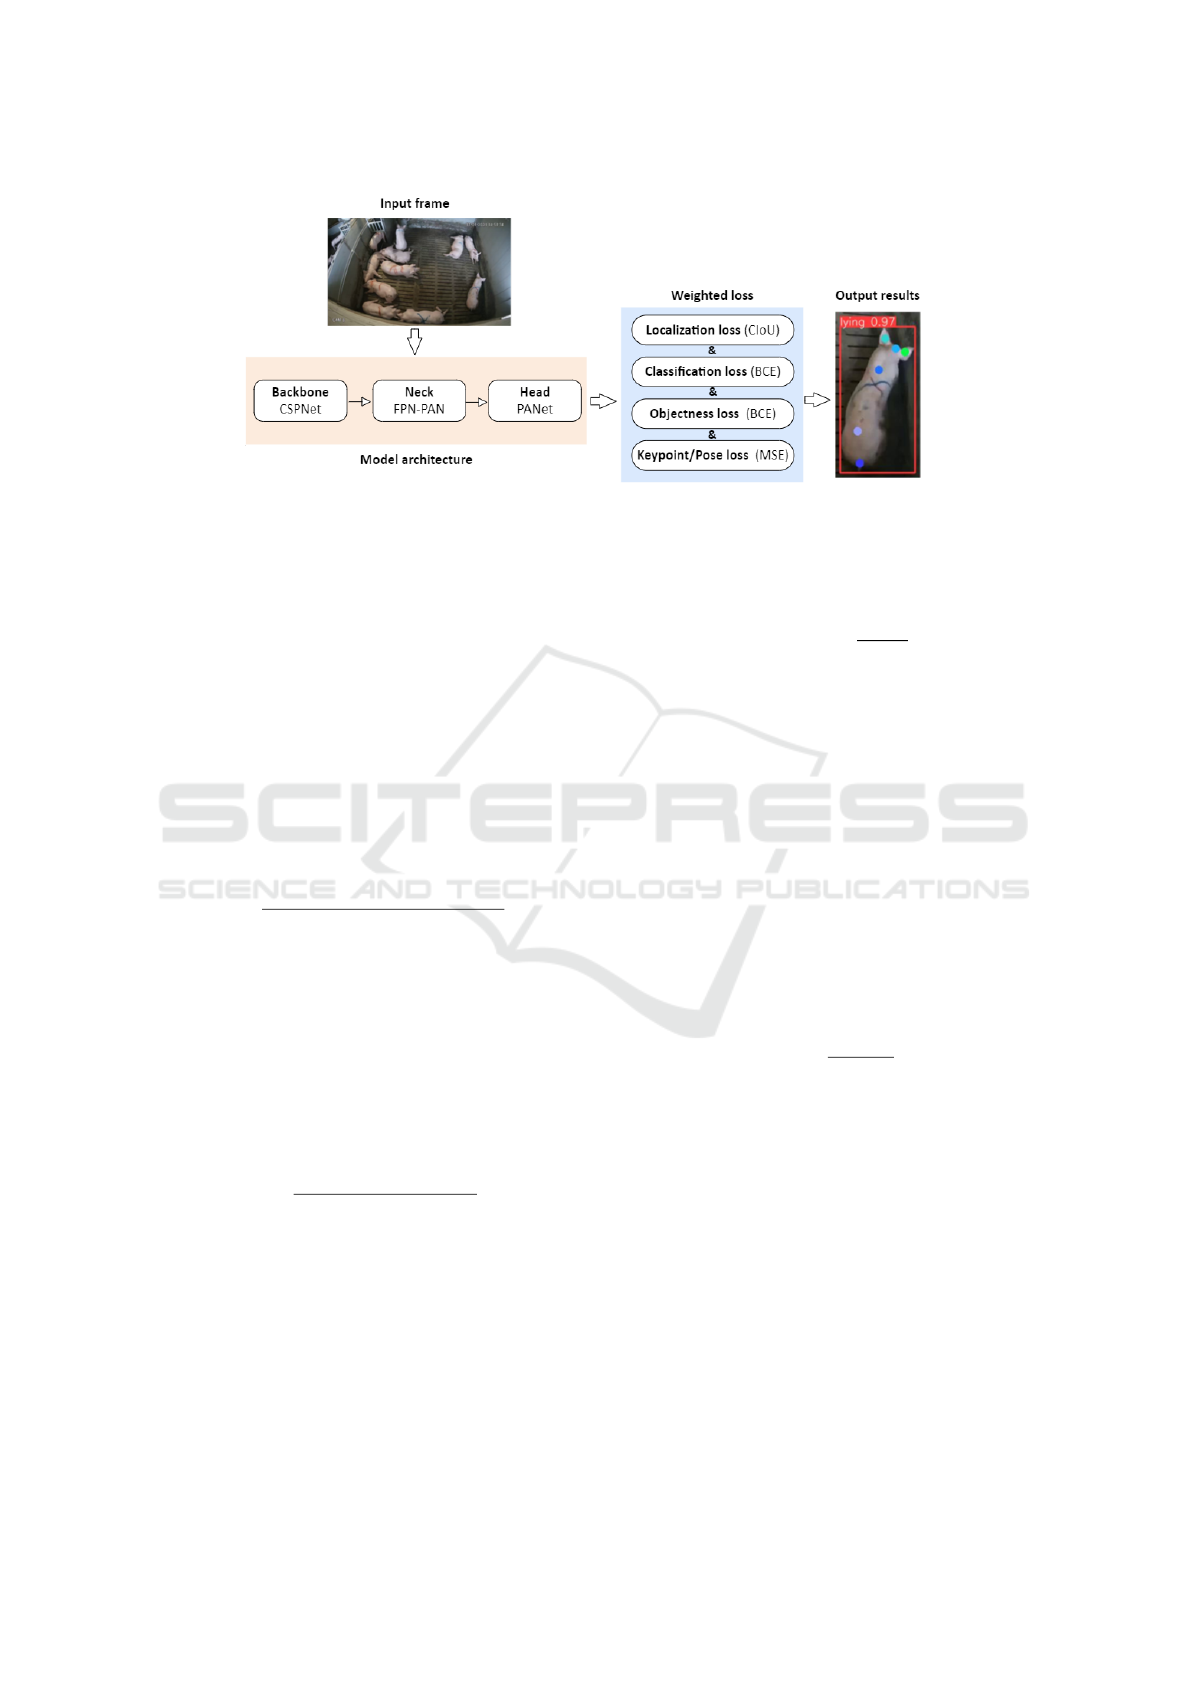
Figure 2: Joint system of keypoint detection and pose estimation introducing model architecture and loss calculation, which
contains the YOLOv8-pose as the baseline model.
adapt them to pig-specific data (Lin et al., 2014; To-
shev and Szegedy, 2014).
In this study, we employ the following eval-
uation metrics to assess the performance of key-
point detection algorithms: (1) Percentage of De-
tected Joints (PDJ), (2) Percentage of Correct Key-
points (PCK), and (3) Object Keypoint Similar-
ity (OKS). For all three metrics, a higher value indi-
cates the improved keypoint detection performance.
Fig. 1(b) illustrates the keypoint layout and corre-
sponding skeletons connecting these keypoints. The
definitions of these metrics are as follows.
The Percentage of Detected Joints (PDJ) is speci-
fied by
P
DJ
=
∑
n
i=1
Bool(d
i
< 0.05 · d
diagonal
)
n
,
(1)
where n represents the total number of keypoints in
a frame, parameter d
i
denotes the Euclidean distance
between the i
th
predicted keypoint and its correspond-
ing ground-truth keypoint, and d
diagonal
indicates the
diagonal length of the bounding box (Toshev and
Szegedy, 2014). The function Bool(·) returns a unity
value if the criterion in the argument is satisfied, oth-
erwise it is zero.
Similar to the PDJ, the Percentage of Correct Key-
points (PCK) is specified by
P
CK
=
∑
n
i=1
Bool(d
i
< 0.5 · s
i
)
n
,
(2)
where parameter s
i
is the length of the i
th
skeleton, re-
placing the diagonal length of the bounding box used
in the PDJ calculation. Because the pig movement is
undirected, the center of its body is not always rele-
vant to the diagonal of the bounding box. In this case,
the longest skeleton between keypoints of body parts
is more relevant. Thus, as shown in Fig. 1(b), the
skeleton length between back and shoulder keypoints
is selected as the value of s
i
, see (Insafutdinov et al.,
2016).
Finally, the Object Keypoint Similarity (OKS) is
specified by
P
OKS
= exp(−
d
2
i
2A · k
2
i
),
(3)
where A represents the area of the object segment,
and k
i
is a coefficient assigned to weigh each key-
point. It should be noted that there is currently no
established k
i
specific to pigs. To address this omis-
sion, we utilize the coefficients k
i
derived from the
human skeleton in the COCO dataset, more specif-
ically k
i
= [0.089, 0.107,0.079,0.026,0.035, 0.035]
for the tail, back, shoulder, nose, left ears, and
right ears, respectively. Given that these k
i
val-
ues are computed from human data, we re-calibrate
the coefficients using the same method to de-
rive the values for k
i
for the pig dataset, result-
ing in k
i
= [0.464,0.429,0.342,0.482,0.485,0.482],
see (Lin et al., 2014). These coefficients are specifi-
cally computed from the validation set. The k
i
from
the pig dataset is specified by
k
i
= 2
q
E[d
2
i
/A], (4)
where A denotes the object segment area, parame-
ter E[·] represents statistical expectation (Lin et al.,
2014).
2.3 Pose Estimation
2.3.1 Network Architecture Overview
To our knowledge, there is limited research investi-
gating the influence of combining keypoint features
and image features on the performance of pig pose
estimation. In the context of classification of human
behaviors, the Multi-layer Perceptron (MLP) model is
capable of utilizing only keypoint data to classify hu-
man postures (Rosenblatt, 1958). ResNet classifies
Multi-Object Keypoint Detection and Pose Estimation for Pigs
469

human postures by extracting information from the
pixels within the bounding box (He et al., 2016). The
YOLOv8 model computes multi-object poses that are
based on both keypoint and image features to in-
dividually assess the posture of each object in ev-
ery frame (Jocher et al., 2023). This study aims
to investigate the efficacy of combining image fea-
tures and keypoint features in pose estimation tasks.
To this end, we conduct a comparative analysis em-
ploying three distinct feature-based models: (1) the
ResNet-18 model (image-based), (2) the MLP model
(keypoint-based), and (3) the YOLOv8 - Pose esti-
mation model (YOLOv8-pose) (combined features of
image and keypoints).
In this research, the ResNet model serves as an
image-based strategy for classification, with images
containing multiple pigs, serving as the input data.
We adopt the ResNet-18 model for its flexibility in
adjusting the depth of the architecture, which is ben-
eficial for our specific problem. Additionally, the
ResNet-18 model capacity for model generalization is
suitable for deploying it in our study (He et al., 2016).
The Multi-layer Perceptron (MLP) model repre-
sents a conventional neural network architecture that
employs hidden layers with activation functions to fa-
cilitate decision-making for classification tasks. In
this study, the MLP model serves as a keypoint-
based method, where the input comprises of a 12-
dimensional vector representing a set of keypoints.
We select the MLP model for this application because
of its scalability, particularly given that our dataset
is relatively small. The MLP architecture allows for
customizing the model size to align with our limited
dataset (Rosenblatt, 1958).
The YOLOv8-pose network architecture for pose
estimation is the same as employed for keypoint de-
tection, which is introduced in Section 2.2.1.
2.3.2 Evaluation Metrics
To evaluate the performance of the posture recogni-
tion model, we consider the problem as a classifica-
tion task. The overall accuracy provides a general
sense of performance, calculated as the ratio of cor-
rectly predicted instances to the total number of in-
stances. This accuracy A
cc
is specified by
A
cc
=
N
TP
+ N
TN
N
TP
+ N
TN
+ N
FP
+ N
FN
, (5)
where N
TP
denotes the number of true positives (TP),
and N
TN
is the number of true negatives (TN). Like-
wise, FP stands for false positives and FN for false
negatives.
In addition to the overall accuracy, we use recall
as a key metric for each category, which measures
the model’s ability to measure the ratio between the
amount of correct detections and the total number of
detections. Hence, the recall R
c
is specified by
R
c
=
N
TP
N
TP
+ N
FN
, (6)
which identifies all relevant instances, particularly in
scenarios where class imbalance exists.
3 EXPERIMENTAL RESULTS
In this section, there are two separate subsections for
keypoint detection and pose estimation.
3.1 Keypoint Detection
The results are divided into three descriptions, first the
outline of the dataset, then the implementation details,
and finally the results.
Table 1: Statistics of the Norwegian dataset for keypoint
detection. The numbers indicate the data distribution across
the number of frames, pigs, and keypoints in each experi-
mental dataset.
Dataset parts
No. of
Frames
No. of
Pigs
No. of
Keypoints
Training set 972 10,058 60,348
Validation set 97 1,021 6,126
Testing set 91 802 4,812
Overall 1,160 11,881 71,286
3.1.1 Dataset Summarization
The Norwegian dataset is utilized for the development
of the keypoint detection model and for evaluating its
performance. The manually annotated dataset of pigs
is summarized as shown in Table 1.
3.1.2 Implementation Details
The backbone model employed in this study is the
YOLOv8x-pose-p6 architecture (Jocher et al., 2023).
The learning rate is set to 0.01, while the early stop-
ping criterion is defined with a patience parameter of
50 epochs. The batch size is configured to be 16. The
model is trained for a maximum of 400 epochs, to en-
sure that early stopping can be effectively triggered.
Additionally, we leverage a COCO-pretrained model
to further fine-tune the keypoint detection model us-
ing the Norwegian dataset. All keypoint detection
experiments are conducted on a GeForce GTX 3090
GPU (Nvidia Corp, Santa Clara, CA, USA).
VISAPP 2025 - 20th International Conference on Computer Vision Theory and Applications
470
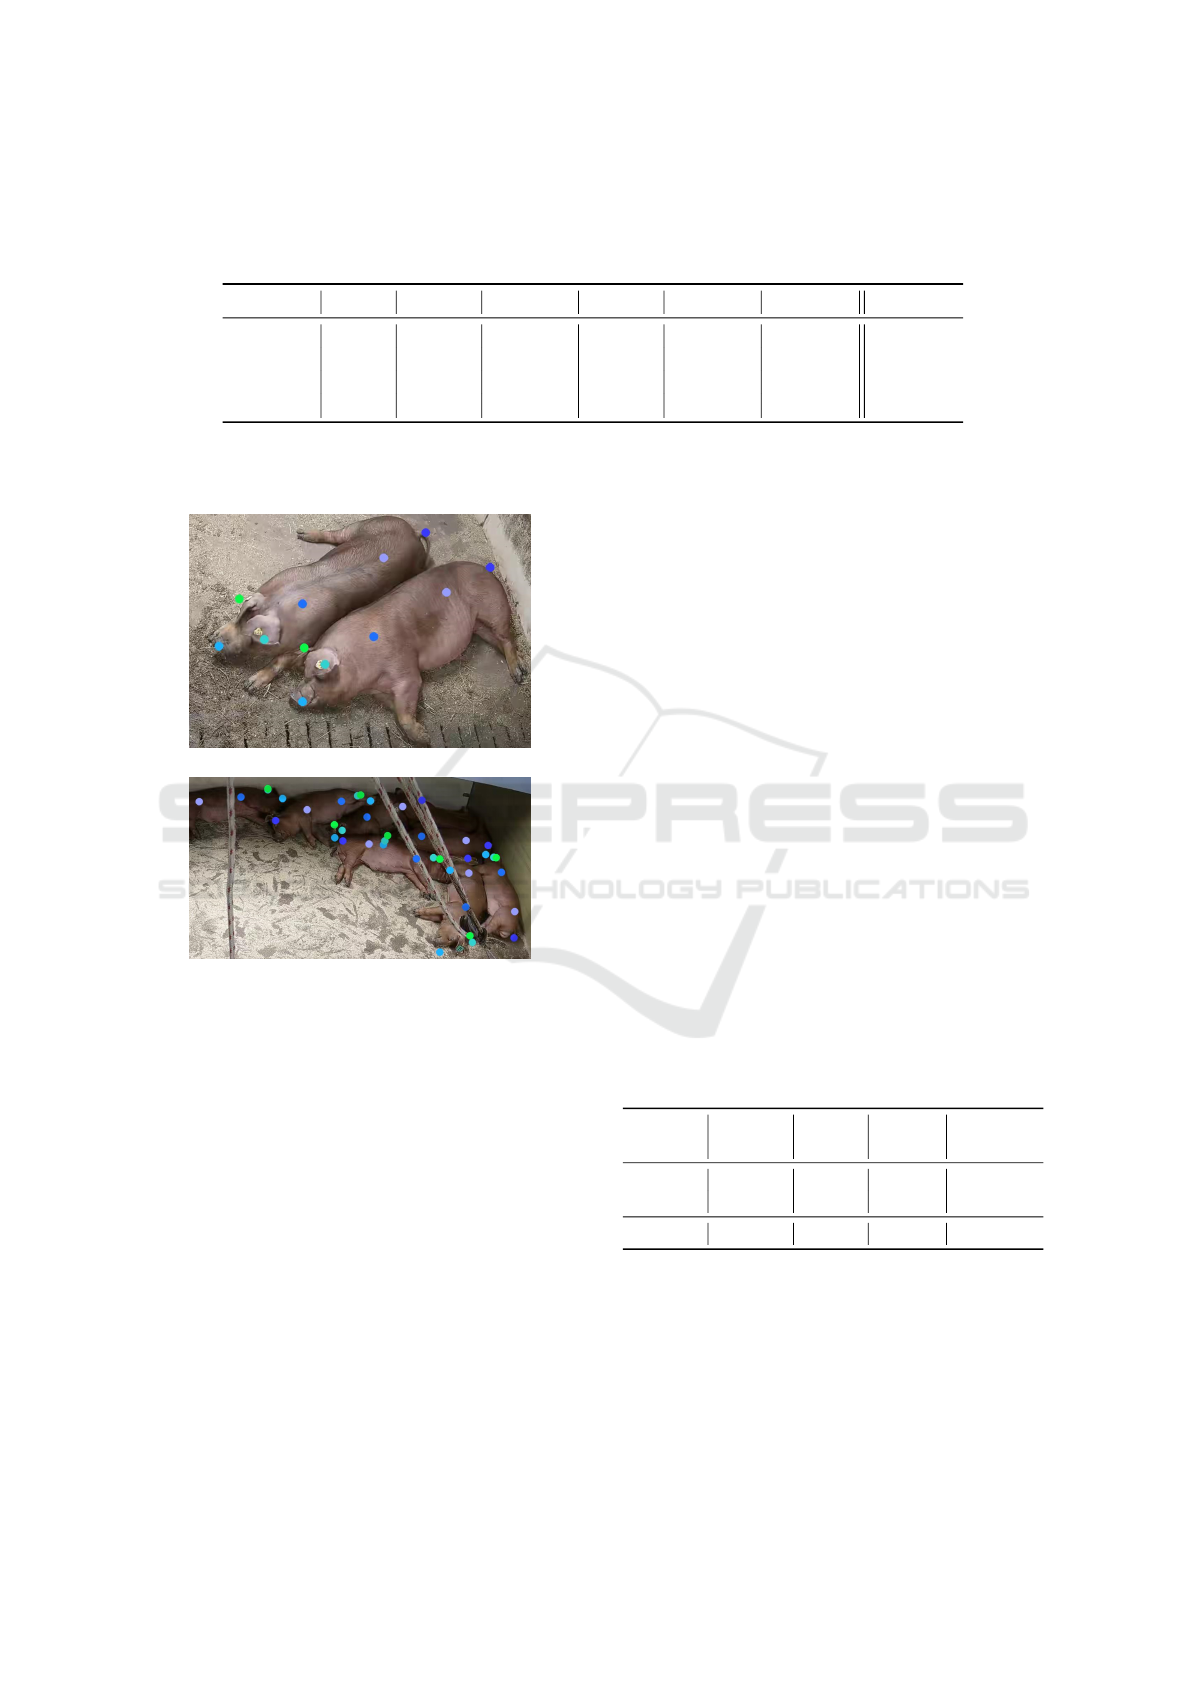
Table 2: Performance of keypoint detection evaluated within the Norwegian dataset, using distinct metrics for each specific
body part, along with the overall results. Metric P
DJ
denotes the percentage of detected joints, P
CK
is the percentage of
correct keypoints, P
OKS
human
stands for the object keypoint similarity using human coefficients, and P
OKS
pig
represents the
object keypoint similarity using pig coefficients.
Tail Back Shoulder Nose Left ear Right ear Overall
P
DJ
59.48 25.44 43.52 58.35 52.37 54.61 48.96
P
CK
69.95 93.89 94.14 85.54 82.79 83.42 84.85
P
OKS
human
53.57 37.05 36.18 10.95 16.00 16.76 28.53
P
OKS
pig
90.81 87.23 87.42 90.89 90.64 91.10 89.43
3.1.3 Results
(a)
(b)
Figure 3: Magnified visualization examples, (a) where all
keypoints are correctly detected, and (b) where some key-
points are incorrectly detected because of occlusion and
pigs overlapping each other.
The keypoint detection model is developed using the
Norwegian dataset. Table 2 lists the average test-
ing results, resulting in a PDJ of 48.96%, a PCK
of 84.85%, an OKS
human
of 28.53%, and an OKS
pig
of 89.43%. There are also keypoint detection evalua-
tion results for specific body parts of the pig, as shown
in Table 2. It can be observed that the back and shoul-
der obtain higher PCK values compared with other
body parts. We calculate the PCK using the skeleton
between back and shoulder keypoints as a threshold,
which is the longest length among all skeletons. The
back and shoulder obtain lower the PDJ values than
other body parts. Concerning 802 individual pigs in
the testing set, 31 pigs failed to be detected (false neg-
ative), and 5 non-existing pigs got the wrong detec-
tion (false positive). It can be noticed that keypoints
are detected correctly in Fig. 3(a), while keypoint de-
tection failures are occurring in Fig. 3(b) because the
pigs are clustered together.
3.2 Pose Estimation
This section has the same structure as Section 3.1.
3.2.1 Dataset Summarization
The German dataset is employed to develop the mod-
els for pose estimation, which are compared and eval-
uated for feature-based methods. We employ two-
fold cross-validation to ensure a fair evaluation of the
model performance. The class distribution in each
fold is listed in Table 3.
3.2.2 Implementation Details
To ensure a fair comparison, all experiments related
to pose estimation are conducted on a GPU device,
specifically an RTX 2080Ti GPU (Nvidia Corp, Santa
Clara, CA, USA), without employing any pretraining.
Table 3: Statistics of the German dataset for pose estima-
tion, which randomly splits frames from all video segments
into two folds (K1, K2). The table lists the counts of in-
stances of three types of pig postures in each fold.
Dataset
K-fold
No. of
Frames
Count
Lying
Count
Sitting
Count
Standing
K1 438 2,936 473 1,409
K2 438 2,926 502 1,390
Overall 876 5,862 975 2,799
For the MLP model, the initial learning rate is set
to 0.0001. In this research, the input data consists of
a 12-dimensional vector, representing the (x,y) coor-
dinates from the six keypoints for each pig. For the
ResNet model, the images enclosed by ground-truth
bounding boxes in the training dataset serve as train-
ing samples. The initial learning rate is set to 0.001
with adaptive decay. The batch size is 4, and the
Multi-Object Keypoint Detection and Pose Estimation for Pigs
471

model is trained for a total of 200 epochs. For the
YOLOv8-pose model, the experimental settings are
the same as used in Section 3.1.2, except for the in-
put which is the German dataset that outputs the pose
estimation results.
3.2.3 Results
As shown in Table 4, the performance of different
models and input feature combinations for pose es-
timation of the pigs are evaluated. Table 3 illus-
trates that the pose estimation dataset exhibits a sig-
nificant class imbalance (approximately 61% of the
data is labeled as ’lying’, 10% as ’sitting’, and 29% as
’standing’), and suffers from insufficient data volume.
Despite these challenges, the YOLOv8-pose model,
which utilizes both ground-truth keypoints and image
data, achieves the highest overall accuracy of 99.33%,
with exceptional performance across all pose cate-
gories (lying: 99.88%, sitting: 98.88%, and standing:
99.25%). By visualizing the results of both keypoint
detection and pose estimation in Fig. 4, all pig posture
classes are also predicted correctly by the YOLOv8-
pose model. These results demonstrate the superi-
ority of combining image features and keypoint fea-
tures for robust pose estimation, despite the imbal-
anced dataset. In contrast, the MLP model achieves
a lower overall accuracy of 95.69%, indicating that
keypoint-based features only are less effective with-
out additional image features. The overall accuracy
of the ResNet model across all postures is 61.54%,
which is considerably lower than the models incorpo-
rating keypoint features.
From the above analysis, it can be concluded that
combining keypoint features and image features sig-
nificantly enhances the accuracy of pose estimation.
4 DISCUSSION
This section discusses key aspects and limitations of
this work.
Data limitation: This study is based on two pig
datasets constructed from real-world farm environ-
ments in Norway and Germany. The imbalanced data
distribution and limited data volume pose significant
challenges to the generalization capability of the pro-
posed models. For example, in the German dataset,
the number of images representing the sitting pos-
ture is considerably lower than those of the other two
postures, which complicates the task of pose estima-
tion, especially for this specific pose. Furthermore,
the small size of the datasets exacerbates the difficulty
in achieving a robust generalization.
The datasets also exhibit a lack of diversity. For
instance, all frames in the Norwegian dataset are cap-
tured under similar lighting conditions and share a
consistent RGB value distribution. When frames are
taken from different environments, such as darker
scenes, the model predicts some keypoints incor-
rectly, as demonstrated in Fig. 3(b). Another example
of this limitation arises when ropes appear in certain
scenes within the training dataset. In these cases, key-
points are occasionally incorrectly predicted on the
rope rather than on the pig body parts. As shown
in the quantitative and qualitative results in Table 2
and Fig. 3, respectively, most test set achieve high
keypoint detection accuracy, though some challeng-
ing cases remain.
Occluding behavior: Difficult cases remain as re-
sult of occluding behaviors of the animals. Specifi-
cally, Table 2 indicates that the model performs less
accurately for the tail compared to other body parts,
such as the ear, nose, and shoulder. This discrepancy
likely arises from the fact that the tail is often oc-
cluded or indistinguishable due to the low resolution
of the images, limiting the model exposure to suffi-
cient tail features.
Keypoint detection: As depicted in Table 2, the
PDJ value obtains lower performance compared to the
PCK value. The main reason is that most diagonal
lengths in the bounding boxes differ from the skeleton
lengths of pigs, as shown in Fig. 1(b). In this case,
the metric PDJ may not be as suitable as the metric
PCK. The PCK calculation involves the length of the
pig skeleton for the evaluation, which ensures that all
parameters used in the PCK metric are directly de-
rived from the pigs themselves, making it more suit-
able for pig keypoint detection. The PCK metric also
obtains an accuracy over 90% in correctly detecting
the back and shoulder keypoints. When the annotator
makes a label for the keypoint, the back and shoul-
der have a larger area to place the keypoint compared
to other parts. Therefore, we pick the longest skele-
ton which is between the back and shoulder keypoints
as s
i
for calculating the metric. The longest skele-
ton causes back and shoulder keypoints to have a rea-
sonable threshold for a true prediction. Since the pig
movement is undirected, the center of its body is not
always relevant to the diagonal of the bounding box.
The OKS
human
metric uses coefficients k
i
deter-
mined for humans, which are for the ankles, back,
shoulder, nose, left ear, and right ear, respectively.
Since humans do not have tails, we apply the coef-
ficient for human ankles to the pig’s tail. However,
the OKS results for the nose and ears are suboptimal.
In human keypoint detection research, the nose and
ears are not as critical, and thus, lower weights are
VISAPP 2025 - 20th International Conference on Computer Vision Theory and Applications
472
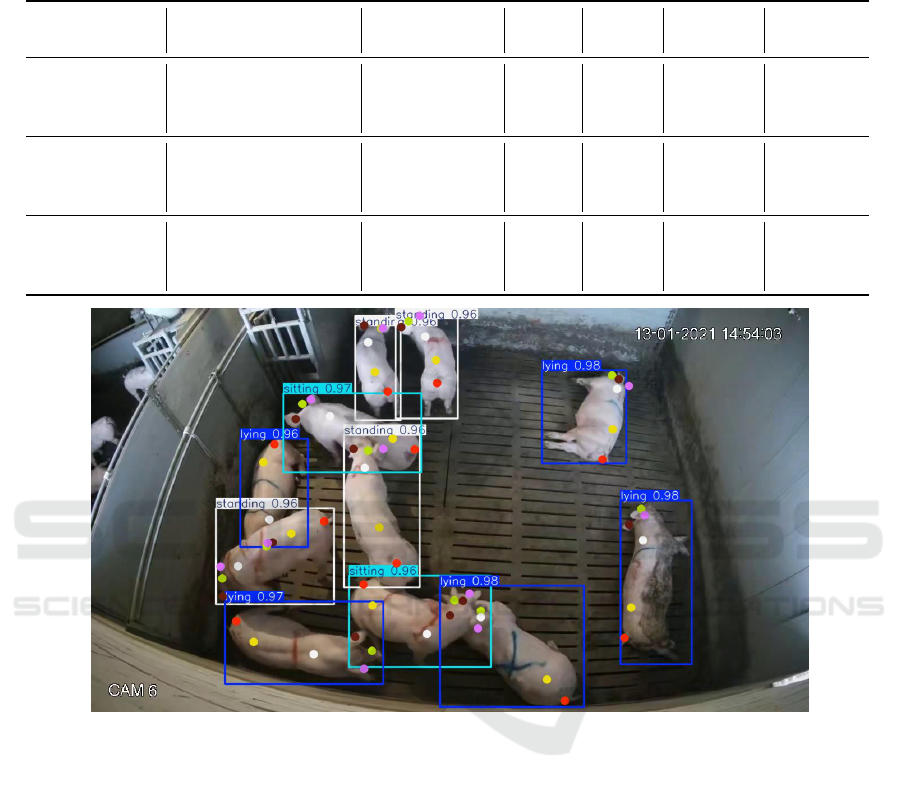
Table 4: Performance comparison of three models for pose estimation accuracy. The evaluation is based on twofold cross-
validation, using different input features utilized by the models based on YOLOv8-pose, ResNet-18, and MLP. The values
under lying, sitting, and standing are the average recall values for the test set of the corresponding data fold. The bold values
are the highest scores, GT means ground truth.
Dataset Input features Model
Recall
Lying
Recall
Sitting
Recall
Standing
Accuracy
(overall)
K1
GT keypoint MLP 98.75 69.74 94.11 94.47
GT image ResNet-18 65.53 68.29 27.89 54.79
GT image + keypoint YOLOv8-pose 99.93 99.15 99.36 99.48
K2
GT keypoint MLP 99.28 81.33 97.36 96.91
GT image ResNet-18 76.49 49.20 57.91 68.29
GT image + keypoint YOLOv8-pose 99.82 98.61 99.14 99.18
Complete data
GT keypoint MLP 99.02 75.54 95.74 95.69
GT image ResNet-18 71.01 58.75 42.90 61.54
GT image + keypoint YOLOv8-pose 99.88 98.88 99.25 99.33
Figure 4: Visualization example result of the best-performing model, YOLOv8-pose. The results show both the keypoint
detection and pose estimation, and their individual confidence scores for the considered image.
assigned to these keypoints in the k
i
coefficients used
by OKS (Lin et al., 2014). Unlike humans, pigs have
proportionally larger noses and ears relative to their
overall body size, which suggests that higher values
of k
i
should be assigned to these features. As a re-
sult, we calculated tailored k
i
coefficients for pigs to
improve the accuracy of keypoint detection in these
areas.
The six annotated keypoints are positioned on the
pig’s head and body, excluding the legs. However, the
three posture class labels—lying, sitting, and stand-
ing—exhibit distinguishing features primarily asso-
ciated with the legs. Therefore, incorporating addi-
tional keypoints along the legs or back may poten-
tially enhance detection performance.
5 CONCLUSIONS
In this work, we have developed a joint model us-
ing YOLOv8-pose for multi-object keypoint detec-
tion and pose estimation, tailored specifically for pigs.
Two pig datasets have been manually annotated, one
dedicated to keypoint detection and the other for
pose estimation. The keypoint detection achieved
a PDJ value of 48.96%, a PCK value of 84.85%,
an OKS
human
value of 28.53% and an OKS
pig
value
of 89.43%, on average. We have compared three
methods with different feature-based strategies to
estimate pig postures, including (1) the ResNet-18
model (image-based), (2) the Multi-layer Perceptron
(MLP) model (keypoint-based), (3) the YOLOv8-
Multi-Object Keypoint Detection and Pose Estimation for Pigs
473

pose model (image-based and keypoint-based). The
best pose estimation performance is obtained by the
YOLOv8-pose model, which demonstrates that com-
bining keypoint features and image features enhances
the pose estimation results. This work demonstrates
the capability of the proposed algorithm to accu-
rately recognize specific body parts using keypoint
detection, thereby providing a concurrent assessment
of pig-posture status. Overall, the results demon-
strate that combining image features and keypoint
features yields the most accurate pose estimation. The
YOLOv8-pose model consistently outperforms both
the MLP model and the ResNet-18 model, highlight-
ing the effectiveness of integrating multiple feature
types. The presented approach provides a promis-
ing foundation for future research aimed at detect-
ing more complex behaviors, such as social interac-
tions among pigs, further enhancing animal welfare
and monitoring capabilities.
ACKNOWLEDGEMENTS
This work is funded by the Dutch NWO project IM-
AGEN [P18-19 Project 1] of the Perspectief research
program. The German facility in Germany was of-
fered by Topigs Norsvin in Helvoirt, the Netherlands,
for conducting the video recordings. We are grate-
ful to the researchers and student assistants from Wa-
geningen University & Research and Eindhoven Uni-
versity of Technology for their help with tracking
and behavior ground-truth annotations. Additionally,
we acknowledge the Genes2Behave project [321409
- IPNÆRINGSLIV20, G2B] for its contribution in
sharing the Norwegian dataset.
REFERENCES
Cao, Z., Hidalgo Martinez, G., Simon, T., Wei, S., and
Sheikh, Y. A. (2019). Openpose: Realtime multi-
person 2d pose estimation using part affinity fields.
IEEE Transactions on Pattern Analysis and Machine
Intelligence.
Fang, H.-S., Li, J., Tang, H., Xu, C., Zhu, H., Xiu, Y., Li,
Y.-L., and Lu, C. (2022). Alphapose: Whole-body
regional multi-person pose estimation and tracking in
real-time. IEEE Transactions on Pattern Analysis and
Machine Intelligence.
He, K., Zhang, X., Ren, S., and Sun, J. (2016). Deep resid-
ual learning for image recognition. In Proceedings of
the IEEE conference on computer vision and pattern
recognition, pages 770–778.
Insafutdinov, E., Pishchulin, L., Andres, B., Andriluka, M.,
and Schiele, B. (2016). Deepercut: A deeper, stronger,
and faster multi-person pose estimation model. In
Computer Vision–ECCV 2016: 14th European Con-
ference, Amsterdam, The Netherlands, October 11-14,
2016, Proceedings, Part VI 14, pages 34–50. Springer.
Jocher, G., Chaurasia, A., and Qiu, J. (2023). Ultralytics
YOLO Docs.
Lee, J., Jin, L., Park, D., and Chung, Y. (2016). Auto-
matic recognition of aggressive behavior in pigs using
a kinect depth sensor. Sensors, 16(5):631.
Lin, T.-Y., Maire, M., Belongie, S., Hays, J., Perona, P.,
Ramanan, D., Doll
´
ar, P., and Zitnick, C. L. (2014).
Microsoft coco: Common objects in context. In Euro-
pean conference on computer vision, pages 740–755.
Springer.
Niu, K. and Yan, Y. (2023). A small-object-detection model
based on improved yolov8 for uav aerial images. In
2023 2nd International Conference on Artificial In-
telligence and Intelligent Information Processing (AI-
IIP), pages 57–60. IEEE.
Racewicz, P., Ludwiczak, A., Skrzypczak, E.,
Składanowska-Baryza, J., Biesiada, H., Nowak,
T., Nowaczewski, S., Zaborowicz, M., Stanisz,
M., and
´
Sl
´
osarz, P. (2021). Welfare health and
productivity in commercial pig herds. Animals,
11(4):1176.
Rosenblatt, F. (1958). The perceptron: a probabilistic model
for information storage and organization in the brain.
Psychological review, 65(6):386.
Toshev, A. and Szegedy, C. (2014). Deeppose: Human pose
estimation via deep neural networks. In Proceedings
of the IEEE conference on computer vision and pat-
tern recognition, pages 1653–1660.
Volkmann, N., Zelenka, C., Devaraju, A. M., Br
¨
unger, J.,
Stracke, J., Spindler, B., Kemper, N., and Koch, R.
(2022). Keypoint detection for injury identification
during turkey husbandry using neural networks. Sen-
sors, 22(14).
Wang, C.-Y., Liao, H.-Y. M., Wu, Y.-H., Chen, P.-Y., Hsieh,
J.-W., and Yeh, I.-H. (2020). Cspnet: A new backbone
that can enhance learning capability of cnn. In Pro-
ceedings of the IEEE/CVF conference on computer
vision and pattern recognition workshops, pages 390–
391.
Wutke, M., Heinrich, F., Das, P. P., Lange, A., Gentz,
M., Traulsen, I., Warns, F. K., Schmitt, A. O., and
G
¨
ultas, M. (2021). Detecting animal contacts—a deep
learning-based pig detection and tracking approach
for the quantification of social contacts. Sensors,
21(22):7512.
Yang, Q. and Xiao, D. (2020). A review of video-based
pig behavior recognition. Applied Animal Behaviour
Science, 233:105146.
Zhuang, X., Bi, M., Guo, J., Wu, S., and Zhang, T. (2018).
Development of an early warning algorithm to detect
sick broilers. Computers and Electronics in Agricul-
ture, 144:102–113.
VISAPP 2025 - 20th International Conference on Computer Vision Theory and Applications
474
