
Optimized Machine Learning Models for Accurate Detection
of Candida spp. in Gram-Stained Microscopy Images
Daniella Pe
˜
na-Pedraza
1 a
, Manuel Linares-Rufo
2 b
, Francisco-Javier Bueno-Guill
´
en
1 c
,
Carlos Garc
´
ıa-Bertolin
2
, Harold Berm
´
udez-Marval
2 d
, Alberto Garc
´
es-Jim
´
enez
1,3 e
and Jos
´
e-Manuel G
´
omez-Pulido
1,3 f
1
Dept. of Computer Science, Health Computing and Intelligent Systems Research Group (HCIS), Universidad de Alcal
´
a,
Madrid, Spain
2
Microbiology Department, Hospital Universitario Pr
´
ıncipe de Asturias, Alcal
´
a de Henares, Madrid, Spain
3
Ram
´
on y Cajal Institute for Health Research (IRYCIS), Madrid, Spain
{daniella.pena, fjavier.bueno, alberto.garces, jose.gomez}@uah.es, manuel.linares@fundacionio.com,
Keywords:
Microorganism Detection, Feature Selection, Automated Diagnostics, Machine Learning, Metaheuristic.
Abstract:
Image interpretation is crucial for clinical microbiological diagnosis. Manual reading of Gram-stained slides
is timeconsuming and complex. The use of artificial vision systems based on machine learning (ML) models
can speed up the detection of microorganisms of interest, ensuring that irrelevant images are discarded and
those relevant for the diagnosis are considered. This automated pre-diagnosis process significantly reduces the
burden on microbiologists and their subjectivity. It is possible to automate the morphological study of Gram-
stained samples, through the identification of yeast-like cells or filamentous structures indicative of Candida
spp. Several multiclass Machine Learning models (XGBoost, Artificial Neural Networks, and K-Nearest
Neighbors) have been implemented, taking the relevant morphological characteristics from the images. The
dataset dimensionality is optimized with innovative metaheuristic algorithms using objective functions for the
specific detection of yeast and hypha. The best-optimized model achieved an accuracy of 0.821, precision
macro of 0.827, recall macro of 0.790, and F1 macro of 0.806.
1 INTRODUCTION
The microscopic interpretation of stained smears is an
operator-dependent and time-consuming task in mi-
crobiology laboratories. Its automation enhances both
the efficiency and the accuracy of the diagnostic, as
well as addresses the shortage of skilled technologists
(Ledeboer and Dallas, 2014; Smith and Kirby, 2020;
Caball
´
e-Cervig
´
on et al., 2020; Burns et al., 2023).
Vaginal infections affecting the female reproduc-
tive system are becoming more common in medical
consultations. The most prevalent symptoms of infec-
tious vaginitis include vaginal discharge, discomfort,
vulvar itching, and odor, although certain infections,
a
https://orcid.org/0009-0006-3295-1486
b
https://orcid.org/0000-0002-7190-0984
c
https://orcid.org/0000-0002-8069-0288
d
https://orcid.org/0009-0009-7127-9428
e
https://orcid.org/0000-0002-1365-9280
f
https://orcid.org/0000-0002-6897-8262
such as trichomoniasis and some forms of candidi-
asis, can be asymptomatic. Timely identification of
these infections is crucial to prevent severe compli-
cations(Verhelst et al., 2005; Gonc¸alves et al., 2016;
Kalia et al., 2020; Dong et al., 2022). Traditionally,
the diagnosis starts with Gram staining tests, which
is simple and cost-effective. The manual examination
of vaginal exudates under a microscope is used to dif-
ferentiate between normal samples and possible in-
fectious vulvovaginitis. However, additional diagnos-
tic procedures, such as culturing, are often necessary
to confirm findings and avoid unnecessary and ineffi-
cient treatments, making the process more expensive
and complicated.
Digital pathology is an emerging field that encom-
passes the acquisition of digitized slides and the sub-
sequent analysis with computerized algorithms(Lam
et al., 2022; Bankhead, 2022; Peiffer-Smadja et al.,
2020).
These techniques have been widely applied in re-
lated fields. For sepsis, researchers achieved a sen-
Peña-Pedraza, D., Linares-Rufo, M., Bueno-Guillén, F.-J., García-Bertolín, C., Bermúdez-Marval, H., Garcéz-Jiménez, A. and Gómez-Pulido, J.-M.
Optimized Machine Learning Models for Accurate Detection of Candida spp. in Gram-Stained Microscopy Images.
DOI: 10.5220/0013170600003911
Paper published under CC license (CC BY-NC-ND 4.0)
In Proceedings of the 18th International Joint Conference on Biomedical Engineering Systems and Technologies (BIOSTEC 2025) - Volume 1, pages 571-578
ISBN: 978-989-758-731-3; ISSN: 2184-4305
Proceedings Copyright © 2025 by SCITEPRESS – Science and Technology Publications, Lda.
571

sitivity and specificity of 98.4% and 75.0% respec-
tively for Gram-positive cocci in chains and pairs,
93.2% and 97.2% for Gram-positive cocci in clusters,
and 96.3% and 98.1% for Gram-negative rods(Smith
et al., 2018). For tuberculosis (Sirohi et al., 2022),
used color, morphology, image arithmetic operation,
K-means clustering and thresholding techniques to
achieve a 95% detection rate of squamous epithelial
cells. Recent work in vulvovaginitis diagnosis has fo-
cused on the whole image classification of either gram
stains or direct samples. Most advanced methods in-
clude convolutional neural networks (CNN)(LeCun
et al., 1998), (Smith et al., 2020) and transfer learning
networks trained in specific task with other domains.
Zhang et al.(Zhang et al., 2017) combined contour
feature extraction using CNN and histogram of ori-
ented gradients followed by a support vector machine
(SVM) for classification, achieving a detection rate of
positive samples as high as 99.8%. Zhao et al. (Zhao
et al., 2022) provided a comprehensive review of the
literature and used multispectral images in conjunc-
tion with CNN and SVM to discriminate between 6
conditions and several combinations. They achieved
an improvement over RGB images of 11.4% in clas-
sification accuracy, 15.6% in precision and 27.25%
in recall. Hao et al. (Hao et al., 2022) used transfer
learning and active learning to discriminate between
positive and negative samples in a low data regime.
They used different types of CNN architectures and
all achieved competitive performance, especially with
ResNet50. Finally, Lev-Sagie et al. (Lev-Sagie et al.,
2023) used a wet microscopy-based scan to perform
in-clinic diagnosis of 7 vaginosis-related conditions
using specialized hardware.
In this study, some ML algorithms were applied to
automatically detect Candida spp. infections in vagi-
nal exudates. For this purpose, a dataset of 221 im-
ages was collected and used to train and evaluate four
individual classifiers.
An important innovation introduced in this work
is the ability of ML techniques to extract entirely new
insights from the Gram-stained slides. These algo-
rithms allow the automated detection of previously
overlooked elements, such as hypha, yeast, leukocyte
nuclei, and other artifacts, providing a more detailed
and accurate classification of vulvovaginitis. This en-
hanced identification entails more effective treatments
for Candida spp. infections by enabling earlier and
more precise diagnoses, thereby reducing the need
for confirmatory tests, such as endocervical swabs,
which are often invasive and uncomfortable for pa-
tients. Moreover, this automation significantly re-
duces the diagnostic time, providing faster results that
ultimately lead to quicker clinical interventions. The
implementation of these techniques also promotes the
sharing of diagnostic knowledge and methodologies
across clinical teams, enhancing the collaboration and
improving the overall healthcare efficiency. While
this study focused on Candida spp., the detection of
other elements such as trichomonas and bacilli re-
mains an area of ongoing research.
2 MATERIALS AND METHODS
2.1 Data Model
The Gram staining technique is a well-established
microbiological method used to classify bacteria
into Gram-positive (purple) and Gram-negative (pink)
groups based on their cell wall characteristics, utiliz-
ing crystal violet, iodine, decolorizer, and safranin.
The images of this study come from the laboratory
at Hospital Universitario Principe de Asturias. They
were captured using a standard smartphone equipped
with a high resolution camera (4032x3024 pixels),
resulting in a dataset of 221 images. for the ma-
chine learning classifiers, with the goal of automat-
ing the detection of key elements, i.e. yeasts, hypha,
and other artifacts. The elements of the dataset are
the characteristics of the microscopy images captured
during the routinary clinical observations. Medical
professionals labelled the images into those contain-
ing yeasts and those without them.
2.2 Image Processing
At first, all images were trimmed and adjusted to a
set size of 1500x1500 pixels. This resolution was
considered adequate for capturing all the required de-
tails to effectively differentiate important elements.
The colored image was then transformed into the gray
scale. Subsequently, pixels were classified using the
K-means clustering algorithm, as shown in Fig 1. Af-
ter this procedure, colors were categorized into five
different levels of color intensity. The darkest sam-
ple, which contained various components like nuclei,
yeast, and hypha, was used for segmenting the im-
ages.
After having the segmented images with the com-
plete set of features, a process of optimisation of the
models is started by feature reduction through meta-
heuristics until the optimised model is found that gen-
erates the most accurate possible classification of the
different contours, as show in Fig 2.
The raw data has been preprocessed to remove
noise and inconsistencies.
BIOINFORMATICS 2025 - 16th International Conference on Bioinformatics Models, Methods and Algorithms
572
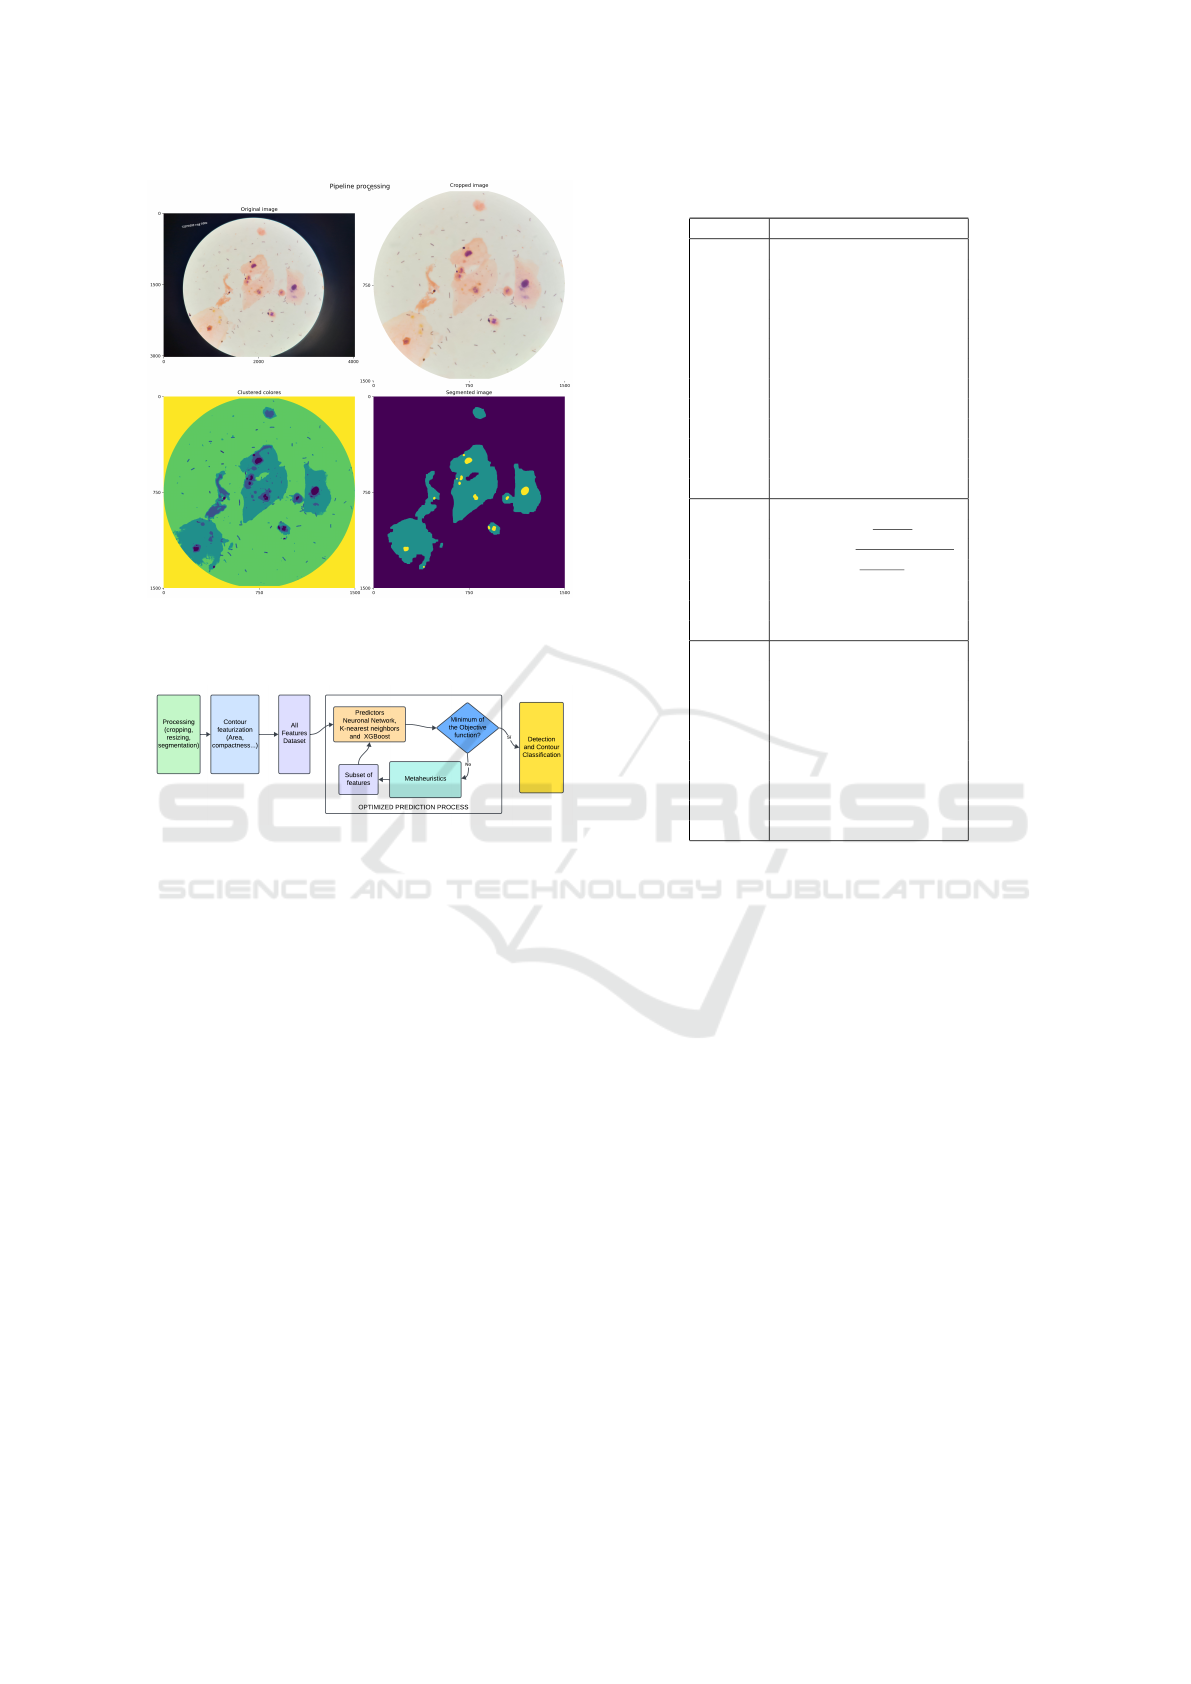
Figure 1: Segmentation process (1) Microscopic sample
captured with the mobile, (2) Cropped frame image; (3)
Color clusterization; (4) Detected contours.
Figure 2: Pipeline scheme illustrating the data processing
and predictor generation workflow.
2.3 Contour Features
Once the image processing was completed, contours
were extracted from the images, serving as the new
data points for further analysis. This differentiation
highlights the effectiveness of contour-based analy-
sis compared to whole-image analysis, as it allows
for a more precise extraction and characterization of
features relevant to classification. Each image con-
tributed multiple contours, from which up to thirty
features were extracted, as shown in Table 1.The
dataset was then divided into training and test sets,
with 2,571 contours assigned to the training set and
720 to the test set. These features are categorized into
three groups: color, shape-related, and image mo-
ments. Each contour in the images of the training
dataset was manually assigned to one of the following
classes: nuclei, referring to the nuclei of Leukocythes,
Yeast, Hypha, and Artifact representing features that
do not correspond to any of the main categories and
are detected as unrelated.
The presence of Candida in a Gram-stained mi-
croscopy sample is crucial for the correct diagno-
sis. Prescription is detected by observing yeast cells,
Table 1: Characteristics grouped by category.
Category Characteristic
Color
Mean Color (Red)
Mean Color (Green)
Mean Color (Blue)
Mean Color (Grayscale)
Std Color (Red)
Std Color (Green)
Std Color (Blue)
Std Color (Grayscale)
Diff Color (Red)
Diff Color (Green)
Diff Color (Blue)
Diff Color (Grayscale)
Context Color
Shape
Area (pixels)
Compactness =
Area
Hull Area
Convexity =
Perimeter (Convex Hull)
Perimeter (Contour)
Roundness =
4π×Area
Perimeter
2
Eccentricity
Elongation
Cell Context
Moments
Central Moment m
01
Central Moment m
10
Central Moment m
11
Central Moment m
20
Central Moment m
02
Hu Moment H
2
Hu Moment H
3
Hu Moment H
4
Hu Moment H
5
Hu Moment H
6
which appear as round or oval structures staining pur-
ple or blue. The observation of hypha, which are
elongated, filamentous structures, further reinforces
the diagnosis of an active Candida infection, as these
forms indicate a more invasive state. Therefore, the
presence of both yeasts and hypha is significant and
supports the clinical suspicion of candidiasis, provid-
ing essential information for the appropriate diagnosis
and treatment plan.
These entities are biologically relevant. The re-
sulting dataset, derived from the contours, served as
the basis for further investigation and enhancement
of classification algorithms. It consisted of a total of
3,291 labeled contours, distributed as shown in Fig.
3.
2.4 Model Evaluation
The contour dataset was used to assess the perfor-
mance of various predictive models. For the multi-
class classification task, we selected several ma-
chine learning algorithms: XGBoost (XGB), Artifi-
cial Neural Network (ANN), and K-Nearest Neigh-
bors (KNN). The choice of ML over deep learning
was driven by several factors, including interpretabil-
Optimized Machine Learning Models for Accurate Detection of Candida spp. in Gram-Stained Microscopy Images
573
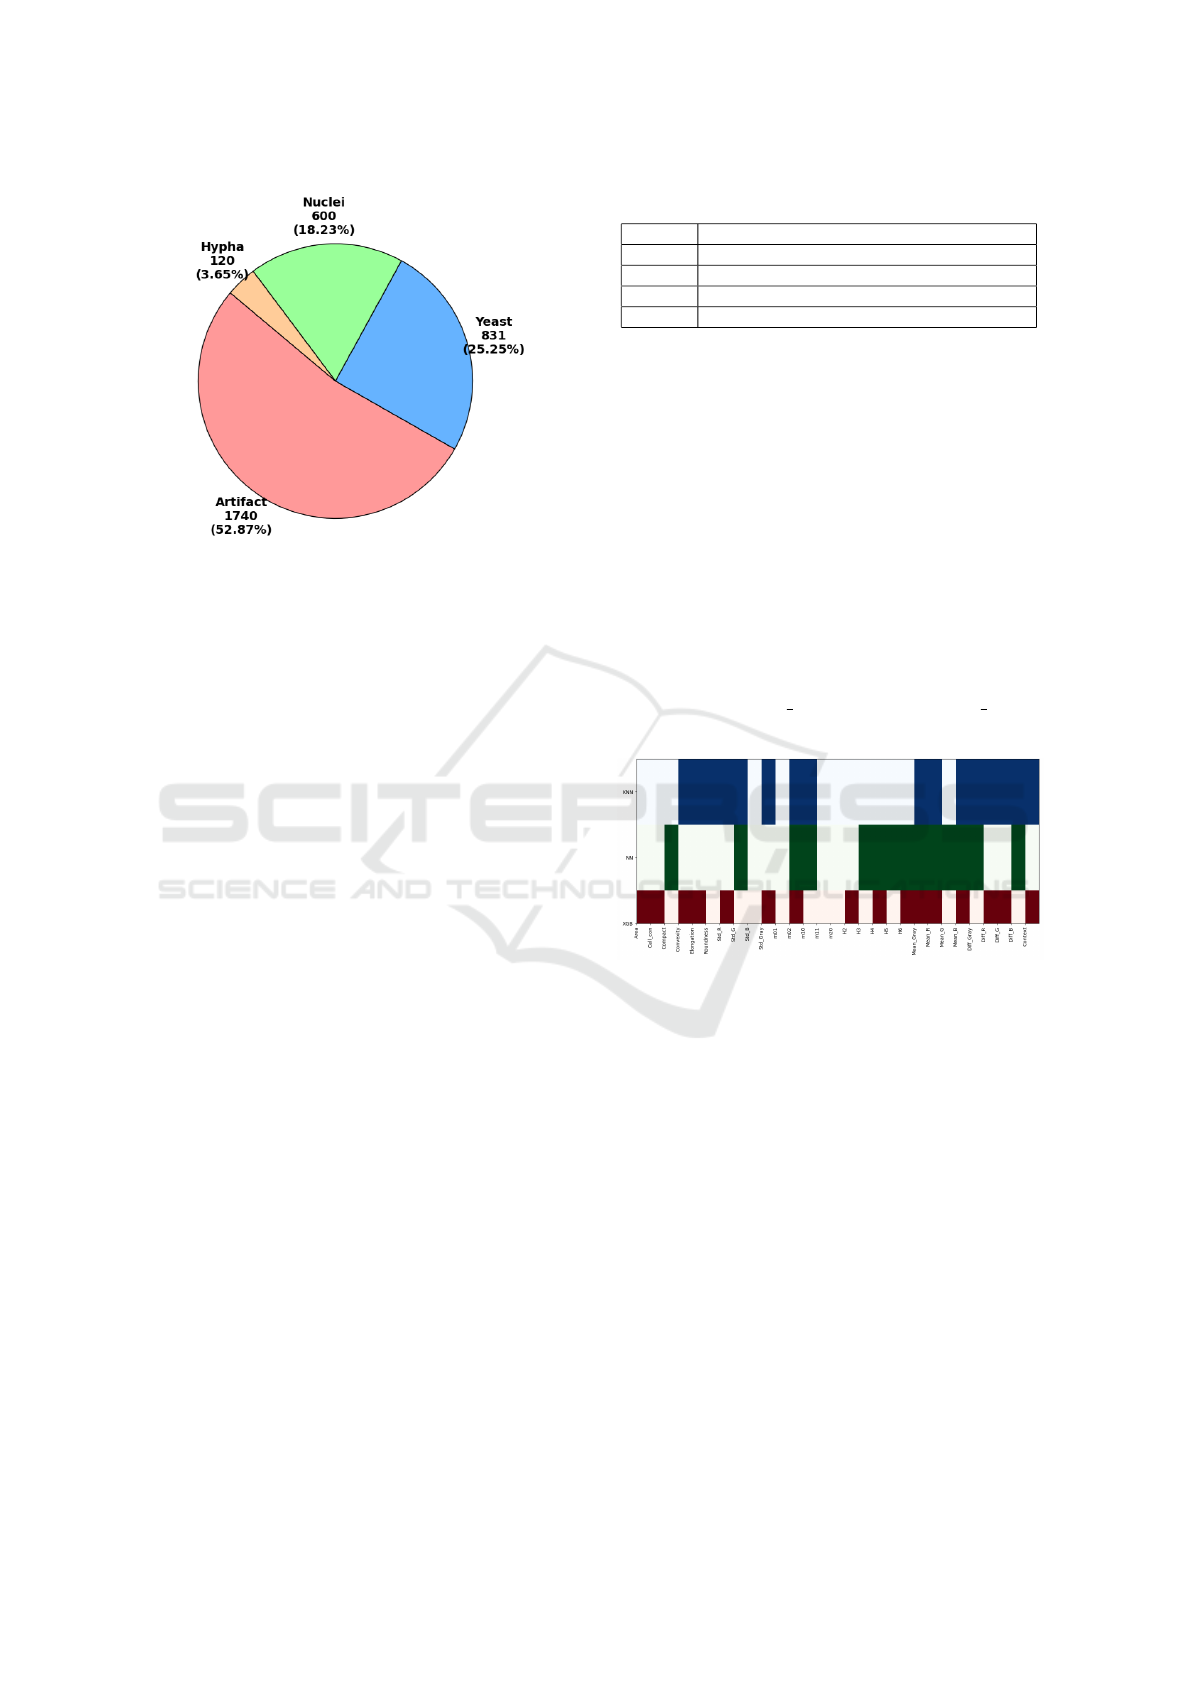
Figure 3: Contour types breakdown in the dataset.
ity, flexibility, and the compatibility of these mod-
els with the metaheuristic optimization approach em-
ployed in this study. Unlike deep learning mod-
els, which often require large datasets and signifi-
cant computational resources, ML algorithms such as
XGBoost (XGB) is better suited to the dataset size
used in this study and provides faster training times.
Additionally, this model allows greater control over
hyperparameters, which is crucial when optimizing
feature selection through metaheuristic techniques.
Each machine learning approach offers distinct ad-
vantages: decision trees (XGBoost) excel at capturing
complex feature interactions, instance-based methods
like KNN are highly effective for classification based
on proximity, and ANNs capture non-linear patterns
through learned weights and biases. This combina-
tion of models allows a comprehensive evaluation of
the impact of feature reduction on classification per-
formance.
Initially, these models were evaluated in their clas-
sical form, with hyperparameters selected through
trial and error, as detailed in Table 2, and without ap-
plying feature reduction techniques. The primary ob-
jective of the optimization was to increase the recall
and minimize the false negatives, thus ensuring that
critical infections, particularly those caused by Can-
dida spp., were not overlooked. Failing to detect yeast
in a sample (i.e., false negatives) can lead to serious
diagnostic errors, which is why the metaheuristic op-
timization process prioritizes recall as a key perfor-
mance metric.
Feature reduction plays a key role in enhancing
both the efficiency and accuracy of the models. In
this context, the Gray Wolf Optimizer (GWO) [20], a
metaheuristic algorithm inspired by the social hierar-
chy and hunting strategies of gray wolves, was used
to identify the optimal feature subsets.
Table 2: Hyperparameters used for each model.
Model Hyperparameters
XGBoost Learning Rate: 0.1, Max Depth: 6, Estimators: 100
CatBoost Learning Rate: 0.05, Max Depth: 6, Estimators: 200
KNN Neighbors: 5, Weights: uniform, Algorithm: auto
ANN Layers: 3, Neurons per Layer: 64, Activation: ReLU
The objective function (O.F.) emphasizes the re-
call for yeast detection, assigning it a weight of 0.8,
reflecting the critical importance of minimizing false
negatives and ensuring that positive cases are cor-
rectly identified. A weight of 0.8 was chosen, rather
than a higher value such as 0.99, to maintain a bal-
anced consideration of other factors, such as overall
model stability and the risk of increasing false posi-
tives. The detection of hypha also considered but is
assigned a lower weight (0.2), as ensuring the detec-
tion of yeast remains the primary goal, with hypha
detection serving as a secondary consideration, result-
ing in the specific and different selection of features
for each ML model as shown in the Fig. 4
O.F. = 0.8 × (1 − rec yeast) + 0.2 ×(1 − Acc hypha)
(1)
Figure 4: Heatmap of the selected features for each models.
(1) blue for k-Nearest Neighbors.; (2) green for Neuronal
Network and (3) red for XGBoost model.
3 RESULTS
3.1 Metrics
The performance metrics presented allow a compre-
hensive comparison between classical models and
those optimized via metaheuristic feature selection.
These metrics include Accuracy, Precision Macro,
Recall Macro, F1 Macro, Precision Weighted, Recall
Weighted, and F1 Weighted. Table 3 outlines the ef-
fect of metaheuristic feature selection on model per-
formance, providing a foundation for further analysis
in the discussion section.
For XGB, the basic model achieved an accuracy
of 0.814, macro precision of 0.805 and a macro re-
call of 0.783, resulting in a macro F1-score of 0.793.
BIOINFORMATICS 2025 - 16th International Conference on Bioinformatics Models, Methods and Algorithms
574
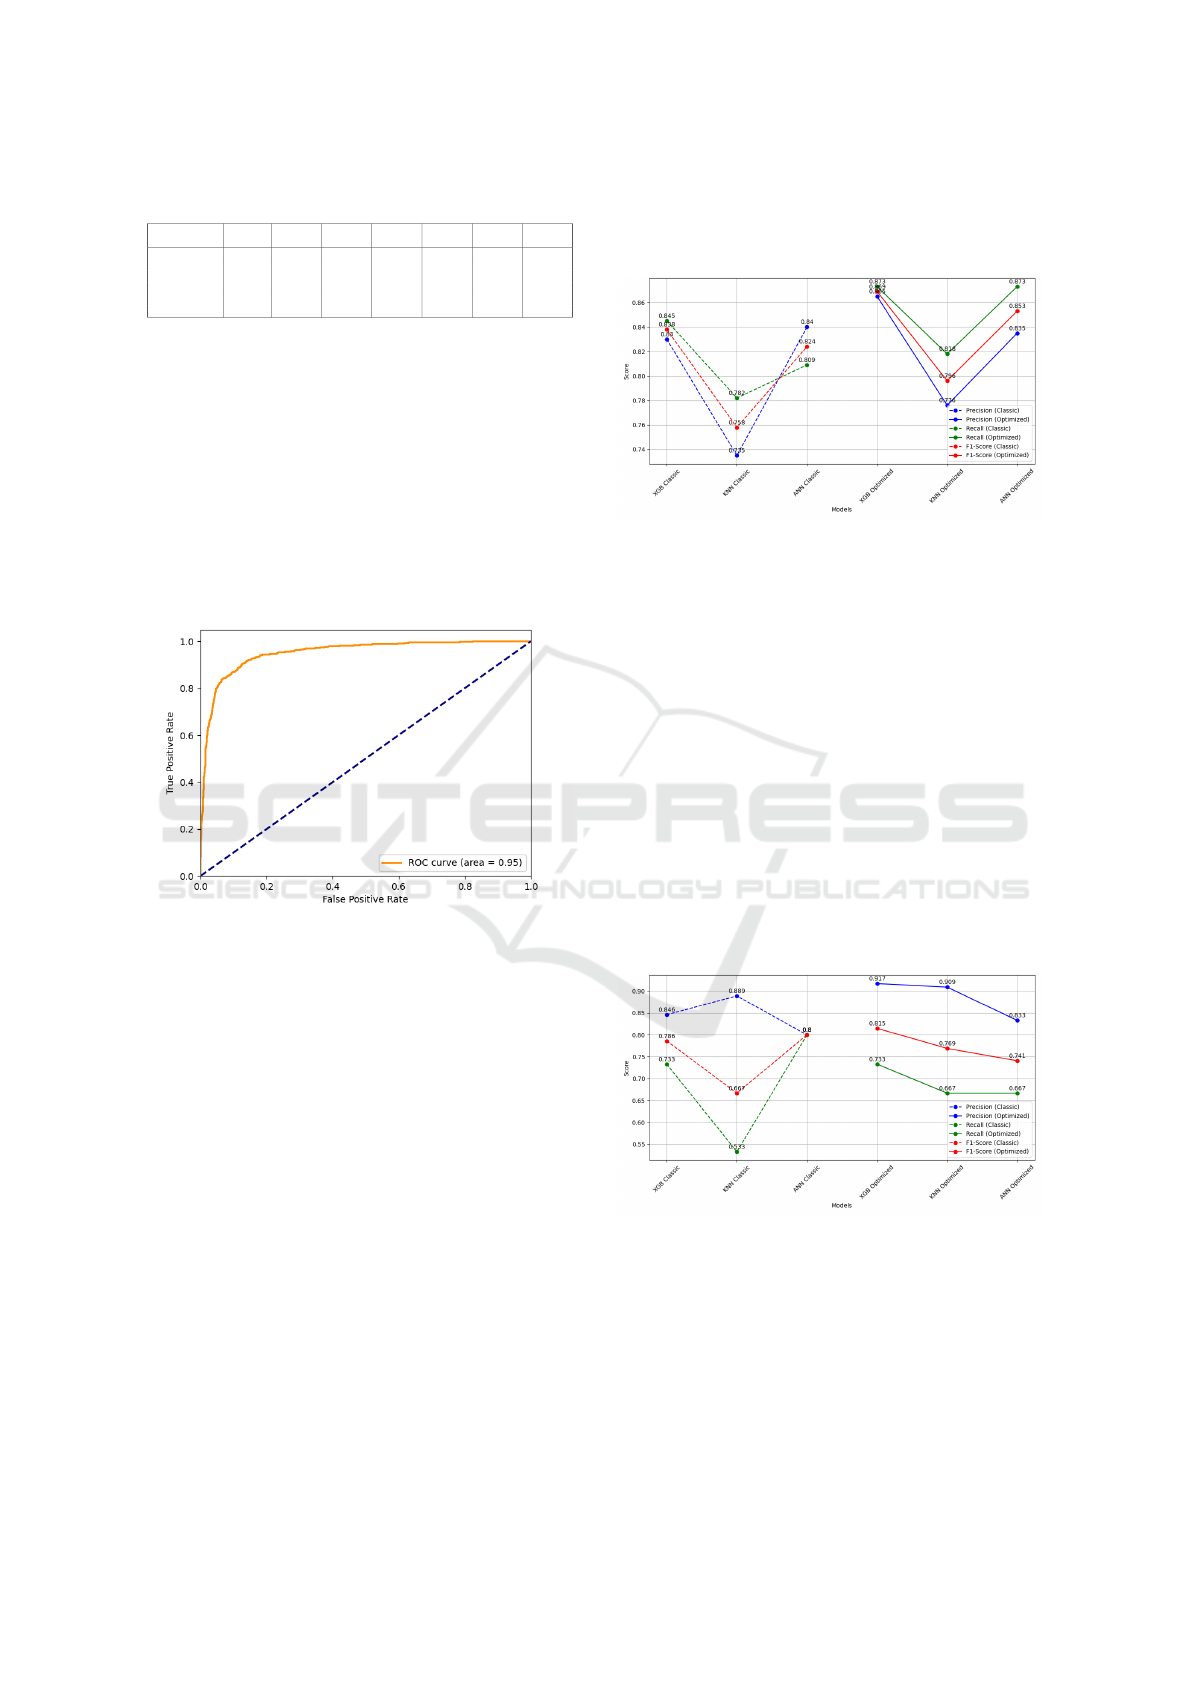
Table 3: Performance metrics for different models.
Model Accuracy Precision
Macro
Recall
Macro
F1
Macro
Precision
Weighted
Recall
Weighted
F1
Weighted
XGB 0.814 0.805 0.783 0.793 0.814 0.814 0.814
XGB optimized 0.821 0.827 0.790 0.806 0.823 0.821 0.821
KNN 0.760 0.772 0.694 0.722 0.762 0.760 0.759
KNN optimized 0.769 0.785 0.759 0.769 0.775 0.771 0.772
ANN 0.809 0.779 0.758 0.766 0.812 0.809 0.810
ANN optimized 0.816 0.802 0.806 0.791 0.825 0.818 0.818
After optimization, these values increased, with accu-
racy reaching 0.821, macro precision to 0.827, macro
recall 0.790, and macro F1-score to 0.806. These im-
provements underscore the effectiveness of the opti-
mization process.
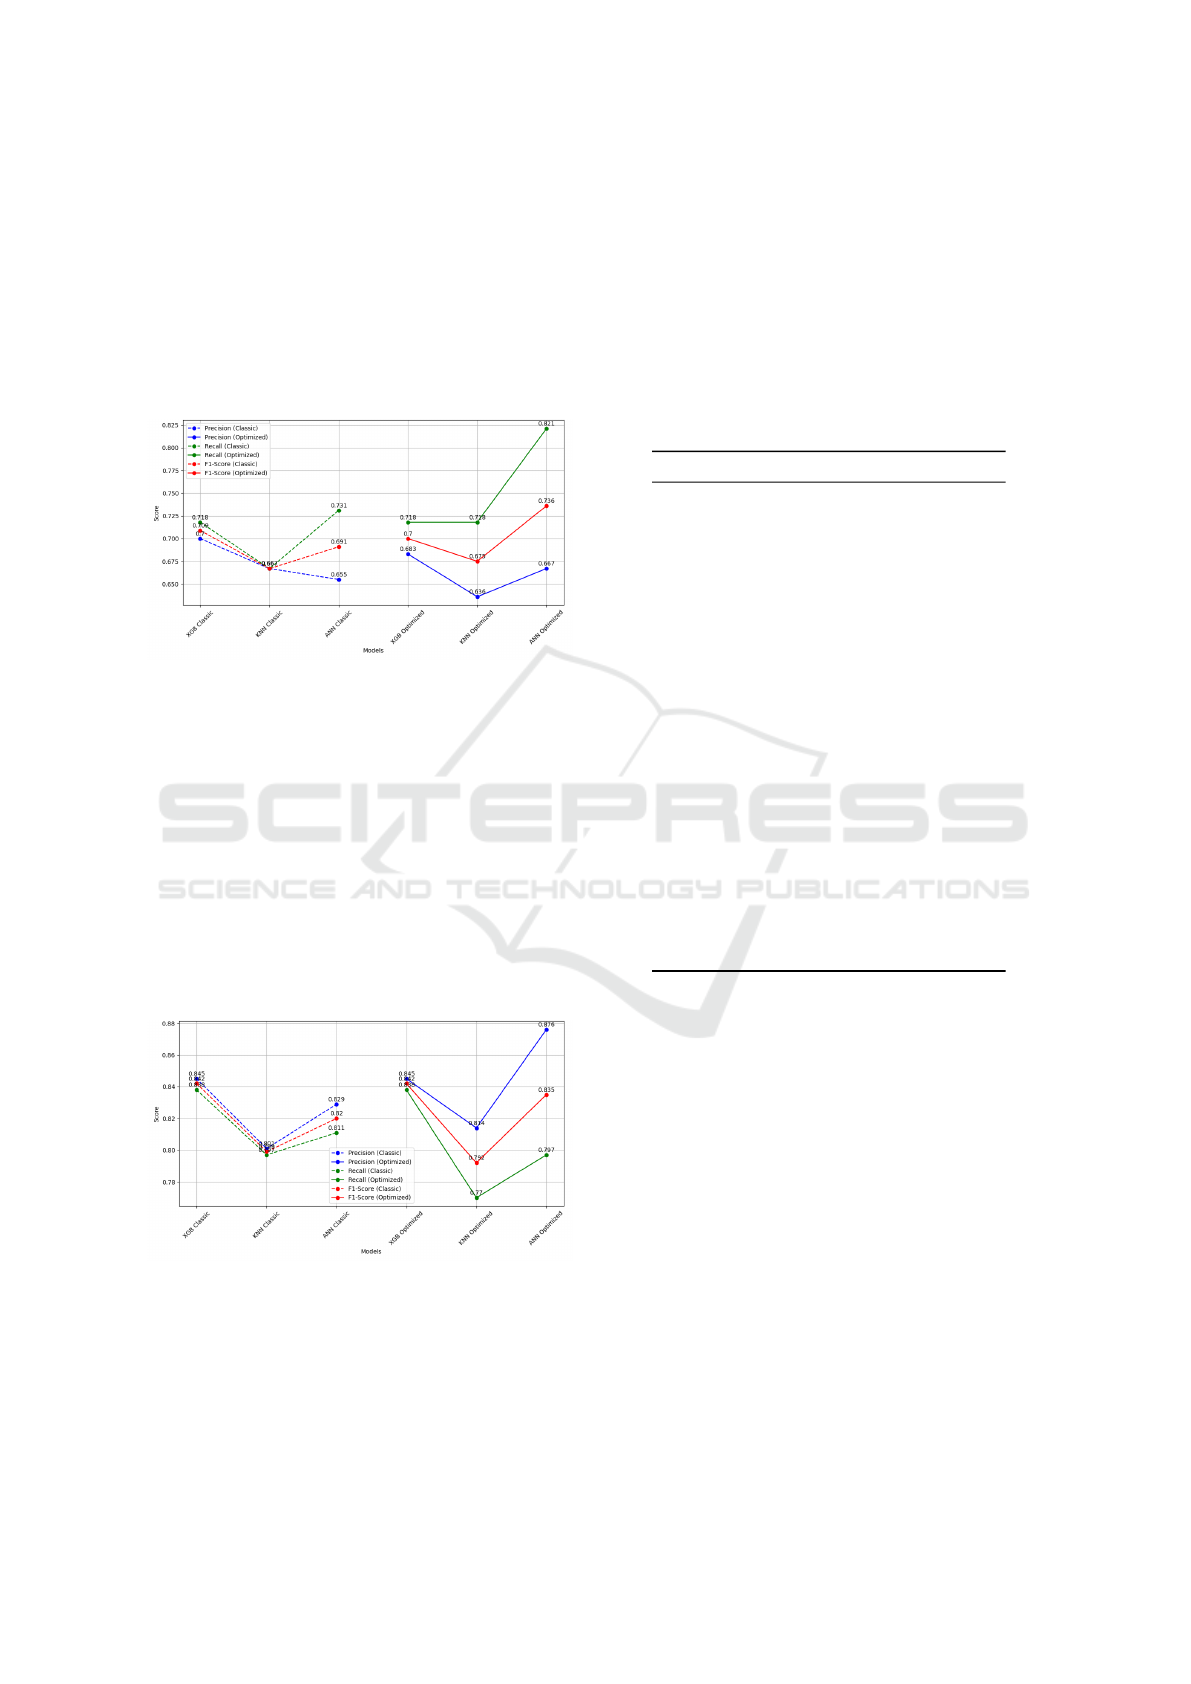
The Receiver Operating Characteristic (ROC)
curve for the XGB model in the Fig.5 shows strong
performance with an AUC of 0.95, confirming
the model’s effectiveness in distinguishing between
classes. This further supports the effectiveness of
the model in distinguishing between classes and high-
lights its robustness after the optimization process.
Figure 5: Receiver Operating Characteristic (ROC) curve
for the XGBoost model.
3.2 Results Focused on Specific Features
A detailed analysis was carried out for each
class—yeast, hypha, nuclei, and artifact—since the
performance for these classes reflects the effective-
ness of the models.
The application of metaheuristic optimization re-
sulted in a noticeable enhancement of performance
metrics across most models. In particular, the XGB
model achieved the highest F1-score after optimiza-
tion, reaching 0.869, as shown in Fig. 6. This im-
provement indicates that the use of metaheuristics ef-
fectively boosts the model’s ability to classify yeast
instances with greater precision. Additionally, the re-
call for the yeast class, which reflects the model’s ca-
pability to correctly identify all true yeast instances,
also increased significantly, demonstrating the opti-
mization’s success in reducing false negatives and
improving overall detection sensitivity. Notably, the
XGB model reduced false negatives from 17 to 14
and increased true positives from 93 to 96, reflecting
a substantial improvement in detection sensitivity, as
seen in Table 4.
Figure 6: Performance metrics comparison for yeast class
(Classic vs Optimized models).
Performance metrics comparison for hypha class
(Classic vs Optimized models).
The application of metaheuristic optimization also
yielded notable improvements for the hypha class, as
shown in Fig. 7. The XGB model demonstrated the
highest F1-score post-optimization, reaching 0.815,
underscoring the effectiveness of the metaheuristics
in enhancing the model’s precision for this class. Ad-
ditionally, the recall for hypha, which measures the
model’s ability to correctly identify all true positive
instances, improved significantly after optimization.
Notably, The recall for the KNN model showed no-
table improvement, increasing from 0.533 to 0.667,
which led to a significant reduction in false negatives.
This improvement is particularly relevant for complex
classes like hypha, where sensitivity is crucial.
Figure 7: Performance metrics comparison for hypha class
(Classic vs Optimized models).
Following the evaluation of the yeast and hy-
pha classes, the performance of the nuclei class was
also analyzed. The performance metrics demonstrate
consistent improvements across all models following
metaheuristic optimization. As shown in Fig. 8, the
ANN model exhibited the highest F1-score, reaching
0.736 after optimization. Moreover, the recall metric,
Optimized Machine Learning Models for Accurate Detection of Candida spp. in Gram-Stained Microscopy Images
575
which evaluates the model’s ability to accurately iden-
tify all relevant instances, experienced a significant
enhancement. In the nuclei class, the ANN model
demonstrated a significant enhancement in recall, in-
creasing from 0.731 to 0.821. This improvement re-
duced false negatives from 18 to 14 and increased true
positives from 60 to 64, as detailed in Table 4 which
means a significant improvement in detection accu-
racy.
Figure 8: Performance metrics comparison for Nuclei class
(Classic vs Optimized models).
Despite applying metaheuristic optimization, the
metrics for the artifact class presented in Fig. 9 did
not improve. This outcome is attributed to the op-
timization function, which did not prioritize refining
the model for this particular class. The artifact class
holds less clinical significance compared to the detec-
tion of yeast, where missing a diagnosis could have
more serious implications for patient care. Therefore,
the focus was placed on enhancing the model’s perfor-
mance for clinically critical structures like yeast and
hypha, ensuring that these are not overlooked during
diagnosis.
Figure 9: Performance metrics comparison for Artifact
class (Classic vs Optimized models).
Table (4) presents a detailed breakdown of false
positives (FP), false negatives (FN), true positives
(TP), and true negatives (TN) for each class, offering
deeper insights into the models’ performance. The
optimized XGB model performed particularly well
in the yeast class, with reductions in both FP and
FN and an increase in TP, indicating stronger detec-
tion capabilities. Likewise, the ANN model exhib-
ited steady enhancements across the yeast and nuclei
classes, achieving notable increases in TP and reduc-
tions in FN. While KNN showed progress, particu-
larly in yeast, there is still room for further enhance-
ment, especially in classes like artifact.
Table 4: Detailed results of FP, FN, TP and TN of the mod-
els for the four classes.
Model Class FP FN TP TN
XGB Yeast 19 17 93 296
XGB optimized Yeast 15 14 96 300
KNN Yeast 31 24 86 284
KNN optimized Yeast 26 20 90 289
ANN Yeast 19 17 93 296
ANN optimized Yeast 19 14 96 296
XGB Hypha 2 4 11 408
XGB optimized Hypha 1 4 11 409
KNN Hypha 1 7 8 409
KNN optimized Hypha 1 5 10 409
ANN Hypha 3 6 9 407
ANN optimized Hypha 2 5 10 408
XGB Nuclei 24 22 56 323
XGB optimized Nuclei 26 22 56 321
KNN Nuclei 26 26 52 321
KNN optimized Nuclei 32 22 56 315
ANN Nuclei 28 18 60 319
ANN optimized Nuclei 32 14 64 315
XGB Artifact 34 36 186 169
XGB optimized Artifact 34 36 186 169
KNN Artifact 44 45 177 159
KNN optimized Artifact 39 51 171 164
ANN Artifact 31 40 182 172
ANN optimized Artifact 25 45 177 178
4 DISCUSSION
This study demonstrates the potential of utilizing ma-
chine learning (ML) models optimized through meta-
heuristics to enhance the detection of microorganisms
in Gram-stained samples. Specifically, the focus on
the detection of Candida species has shown signifi-
cant improvements in diagnostic accuracy, leading to
more effective treatments, reduced diagnostic times,
and fewer invasive procedures. The extraction of
meaningful insights from Gram-stained images repre-
sents an innovative and valuable approach in clinical
diagnostics.
The ability of these models to accurately detect
yeast and hyphae has considerable implications for
the diagnosis of vulvovaginitis. Accurate classifi-
cation of these elements not only enhances clinical
outcomes but also minimizes the need for additional
BIOINFORMATICS 2025 - 16th International Conference on Bioinformatics Models, Methods and Algorithms
576

invasive procedures, such as endocervical sampling.
This improvement contributes to a more comfort-
able patient experience and reduces healthcare costs.
Moreover, the ability to standardize and share diag-
nostic knowledge across healthcare professionals sup-
ports clinical decision-making and fosters collabora-
tion within the medical community.
The integration of machine learning models tai-
lored to microbiological data has proven effective.
Models such as XGBoost (XGB), Artificial Neural
Networks (ANN), and k-Nearest Neighbors (KNN)
were selected for their distinct algorithmic strengths,
providing a diverse set of tools for accurate classi-
fication. XGBoost, with its decision-tree-based ap-
proach, demonstrated robust performance in handling
complex data, while the ANN model excelled in ad-
justing weights and biases for intricate classifications.
KNN, although instance-based, showed notable im-
provements in detecting challenging elements such as
hyphae following optimization.
Metaheuristic optimization applied to these mod-
els was crucial in improving their overall perfor-
mance. This optimization not only enhanced metrics
such as accuracy and recall but also increased sensi-
tivity to detecting yeast and hyphae, essential for con-
firming cases of vulvovaginitis. The reduction in false
negatives was particularly significant, as missing key
diagnostic markers could result in inadequate treat-
ments or unnecessary follow-up testing.
Despite these promising outcomes, the detec-
tion of other relevant microorganisms, such as Tri-
chomonas and bacterial vaginosis-associated bacilli,
remains an area for further exploration. Addressing
these gaps could yield a more comprehensive diag-
nostic tool capable of identifying a broader range of
vulvovaginal infections.
Finally, the optimization of classifiers using meta-
heuristic algorithms validated the importance of se-
lecting relevant morphological features. This selec-
tion significantly enhanced the models’ ability to dif-
ferentiate between microorganism types, particularly
in the detection of yeast and hyphae. However, the
observed trade-offs, such as increased false positives
or reduced performance in detecting other structures,
highlight the necessity of careful model selection and
tuning for specific clinical contexts.
5 CONCLUSIONS
This study underscores the effectiveness of integrat-
ing machine learning algorithms optimized through
metaheuristics into microbiological diagnostics. By
improving the detection of yeast and hyphae in Gram-
stained samples, these models deliver more accurate
and efficient diagnostic tools, potentially transform-
ing the diagnostic landscape for vulvovaginitis and re-
lated infections.
The XGBoost optimized model demonstrated the
best overall results, with an accuracy of 0.821, preci-
sion macro of 0.827, recall macro of 0.790, and F1
macro of 0.806. In yeast detection, XGBoost op-
timization reduced false negatives (FN) from 17 to
14 and increased true positives (TP) from 93 to 96.
Similarly, in hypha detection, it achieved the low-
est false positive (FP) count (1), while maintaining
4 false negatives and 11 true positives. The automa-
tion of microorganism detection in Gram-stained im-
ages has been confirmed as a robust and reliable ap-
proach. These results emphasize the importance of
tailoring machine learning models to specific diagnos-
tic tasks, ensuring reliable and efficient classification
performance across diverse microorganism types.
The combination of machine learning techniques
and metaheuristic algorithms represents a significant
contribution to applied artificial intelligence in micro-
biology. The groundwork for integrating these tech-
niques into clinical decision-support systems has been
established. Developing an interface for clinicians or
microbiologists will further streamline the diagnostic
process, enabling real-time microorganism detection
and improving accuracy in clinical environments.
Future studies should explore the integration of al-
ternative imaging modalities or the combination of
different staining methods to broaden the applica-
bility of the developed models. Furthermore, these
approaches should be validated using more diverse
datasets to ensure their generalizability across differ-
ent clinical contexts, thereby extending their utility to
a wider range of healthcare settings. The consistent
improvements observed in yeast, hypha, and nuclei
detection highlight the potential of these optimized
ML models to significantly enhance clinical micro-
biological diagnostics.
ACKNOWLEDGEMENTS
This work has been supported by the Community of
Madrid through the recruitment of a Research Assis-
tant (PEJ-2023-AI) co-financed by the European So-
cial Fund Plus call 2023. The authors would also
like to thank PhD. Pablo Herrera for his previous
work, Juan Cuadros (Head of the Clinical Microbi-
ology Service of the Hospital Pr
´
ıncipe de Asturias)
and Diego Meg
´
ıas (Head of Advanced Optical Mi-
croscopy, ISCIII) for their support and methodologi-
cal advice, and finally MSc. Melisa Granda and MSc.
Mar
´
ıa Santamera for their collaboration in the study.
Optimized Machine Learning Models for Accurate Detection of Candida spp. in Gram-Stained Microscopy Images
577

REFERENCES
Bankhead, P. (2022). Developing image analysis meth-
ods for digital pathology. The Journal of Pathology,
257(4):391–402.
Burns, B. L., Rhoads, D. D., and Misra, A. (2023). The use
of machine learning for image analysis artificial intel-
ligence in clinical microbiology. Journal of clinical
microbiology, 61(9):e02336–21.
Caball
´
e-Cervig
´
on, N., Castillo-Sequera, J. L., G
´
omez-
Pulido, J. A., G
´
omez-Pulido, J. M., and Polo-Luque,
M. L. (2020). Machine learning applied to diagno-
sis of human diseases: A systematic review. Applied
Sciences, 10(15):5135.
Dong, M., Wang, C., Li, H., Yan, Y., Ma, X., Li, H., Li,
X., Wang, H., Zhang, Y., Qi, W., et al. (2022). Aer-
obic vaginitis diagnosis criteria combining gram stain
with clinical features: an establishment and prospec-
tive validation study. Diagnostics, 12(1):185.
Gonc¸alves, B., Ferreira, C., Alves, C. T., Henriques, M.,
Azeredo, J., and Silva, S. (2016). Vulvovaginal can-
didiasis: Epidemiology, microbiology and risk fac-
tors. Critical reviews in microbiology, 42(6):905–927.
Hao, R., Liu, L., Zhang, J., Wang, X., Liu, J., Du, X., He,
W., Liao, J., Liu, L., and Mao, Y. (2022). A data-
efficient framework for the identification of vaginitis
based on deep learning. Journal of Healthcare Engi-
neering, 2022.
Kalia, N., Singh, J., and Kaur, M. (2020). Microbiota in
vaginal health and pathogenesis of recurrent vulvo-
vaginal infections: a critical review. Annals of clinical
microbiology and antimicrobials, 19(1):1–19.
Lam, L. H. T., Do, D. T., Diep, D. T. N., Nguyet, D.
L. N., Truong, Q. D., Tri, T. T., Thanh, H. N., and
Le, N. Q. K. (2022). Molecular subtype classifica-
tion of low-grade gliomas using magnetic resonance
imaging-based radiomics and machine learning. NMR
in Biomedicine, 35(11):e4792.
LeCun, Y., Bottou, L., Bengio, Y., and Haffner, P. (1998).
Gradient-based learning applied to document recogni-
tion. Proceedings of the IEEE, 86(11):2278–2324.
Ledeboer, N. A. and Dallas, S. D. (2014). Point-
counterpoint: the automated clinical microbiology
laboratory: fact or fantasy? Journal of clinical mi-
crobiology, 52(9):3140–3146.
Lev-Sagie, A., Strauss, D., and Ben Chetrit, A. (2023).
Diagnostic performance of an automated microscopy
and ph test for diagnosis of vaginitis. NPJ Digital
Medicine, 6(1):66.
Peiffer-Smadja, N., Delli
`
ere, S., Rodriguez, C., Birgand, G.,
Lescure, F.-X., Fourati, S., and Rupp
´
e, E. (2020). Ma-
chine learning in the clinical microbiology laboratory:
has the time come for routine practice? Clinical Mi-
crobiology and Infection, 26(10):1300–1309.
Sirohi, M., Lall, M., Yenishetti, S., Panat, L., and Ku-
mar, A. (2022). Development of a machine learn-
ing image segmentation-based algorithm for the de-
termination of the adequacy of gram-stained sputum
smear images. Medical Journal Armed Forces India,
78(3):339–344.
Smith, K. P., Kang, A. D., and Kirby, J. E. (2018). Auto-
mated interpretation of blood culture gram stains by
use of a deep convolutional neural network. Journal
of Clinical Microbiology, 56(3):e01521–17.
Smith, K. P. and Kirby, J. E. (2020). Image analysis and ar-
tificial intelligence in infectious disease diagnostics.
Clinical Microbiology and Infection, 26(10):1318–
1323.
Smith, K. P., Wang, H., Durant, T. J., Mathison, B. A.,
Sharp, S. E., Kirby, J. E., Long, S. W., and Rhoads,
D. D. (2020). Applications of artificial intelligence in
clinical microbiology diagnostic testing. Clinical Mi-
crobiology Newsletter, 42(8):61–70.
Verhelst, R., Verstraelen, H., Claeys, G., Verschraegen, G.,
Van Simaey, L., De Ganck, C., De Backer, E., Tem-
merman, M., and Vaneechoutte, M. (2005). Compari-
son between gram stain and culture for the character-
ization of vaginal microflora: definition of a distinct
grade that resembles grade i microflora and revised
categorization of grade i microflora. BMC microbiol-
ogy, 5:1–11.
Zhang, J., Lu, S., Wang, X., Du, X., Ni, G., Liu, J., Liu,
L., and Liu, Y. (2017). Automatic identification of
fungi in microscopic leucorrhea images. JOSA A,
34(9):1484–1489.
Zhao, K., Gao, P., Liu, S., Wang, Y., Li, G., and Wang,
Y. (2022). A vaginitis classification method based
on multi-spectral image feature fusion. Sensors,
22(3):1132.
BIOINFORMATICS 2025 - 16th International Conference on Bioinformatics Models, Methods and Algorithms
578
